Operations management
Operations management is an area of management concerned with designing and controlling the process of production and redesigning business operations in the production of goods or services. It involves the responsibility of ensuring that business operations are efficient in terms of using as few resources as needed and effective in terms of meeting customer requirements. It is concerned with managing the process that converts inputs (in the forms of raw materials, labor, and energy) into outputs (in the form of goods and/or services).[1][2] The relationship of operations management to senior management in commercial contexts can be compared to the relationship of line officers to highest-level senior officers in military science. The highest-level officers shape the strategy and revise it over time, while the line officers make tactical decisions in support of carrying out the strategy. In business as in military affairs, the boundaries between levels are not always distinct; tactical information dynamically informs strategy, and individual people often move between roles over time.

According to the United States Department of Education, operations management is the field concerned with managing and directing the physical and/or technical functions of a firm or organization, particularly those relating to development, production, and manufacturing. Operations management programs typically include instruction in principles of general management, manufacturing and production systems, factory management, equipment maintenance management, production control, industrial labor relations and skilled trades supervision, strategic manufacturing policy, systems analysis, productivity analysis and cost control, and materials planning.[3][4]
History
The history of production and operation systems began around 5000 B.C. when Sumerian priests developed the ancient system of recording inventories, loans, taxes, and business transactions. The next major historical application of operation systems occurred in 4000 B.C. It was during this time that the Egyptians started using planning, organization, and control in large projects such as the construction of the pyramids. By 1100 B.C., labor was being specialized in China; by about 370 B.C., Xenophon described the advantages of dividing the various operations necessary for the production of shoes among different individuals in ancient Greece.[5]
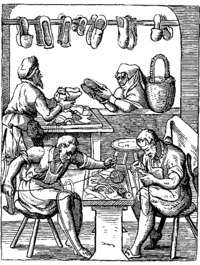
In the Middle Ages, kings and queens ruled over large areas of land. Loyal noblemen maintained large sections of the monarch’s territory. This hierarchical organization in which people were divided into classes based on social position and wealth became known as the feudal system. In the feudal system, vassals and serfs produced for themselves and people of higher classes by using the ruler’s land and resources. Although a large part of labor was employed in agriculture, artisans contributed to economic output and formed guilds. The guild system, operating mainly between 1100 and 1500, consisted of two types: merchant guilds, who bought and sold goods, and craft guilds, which made goods. Although guilds were regulated as to the quality of work performed, the resulting system was rather rigid, shoemakers, for example, were prohibited from tannin hides.[6]
The industrial revolution was facilitated by two elements: interchangeability of parts and division of labor. Division of labor has always been a feature from the beginning of civilization, the extent to which the division is carried out varied considerably depending on period and location. Compared to the Middle Ages, the Renaissance and the Age of Discovery were characterized by a greater specialization in labor, one of the characteristics of growing European cities and trade. It was in the late eighteenth century that Eli Whitney popularized the concept of interchangeability of parts when he manufactured 10,000 muskets. Up to this point in the history of manufacturing, each product (e.g. each gun) was considered a special order, meaning that parts of a given gun were fitted only for that particular gun and could not be used in other guns. Interchangeability of parts allowed the mass production of parts independent of the final products in which they would be used.
In 1883, Frederick Winslow Taylor introduced the stopwatch method for accurately measuring the time to perform each single task of a complicated job. He developed the scientific study of productivity and identifying how to coordinate different tasks to eliminate wasting of time and increase the quality of work. The next generation of scientific study occurred with the development of work sampling and predetermined motion time systems (PMTS). Work sampling is used to measure the random variable associated with the time of each task. PMTS allows the use of standard predetermined tables of the smallest body movements (e.g. turning the left wrist by 90°), and integrating them to predict the time needed to perform a simple task. PMTS has gained substantial importance due to the fact that it can predict work measurements without observing the actual work. The foundation of PMTS was laid out by the research and development of Frank B. and Lillian M. Gilbreth around 1912. The Gilbreths took advantage of taking motion pictures at known time intervals while operators were performing the given task.
The idea of the production line has been used multiple times in history prior to Henry Ford: the Venetian Arsenal (1104); Smith's pin manufacturing, in the Wealth of Nations (1776) or Brunel's Portsmouth Block Mills (1802). Ransom Olds was the first to manufacture cars using the assembly line system, but Henry Ford developed the first auto assembly system where a car chassis was moved through the assembly line by a conveyor belt while workers added components to it until the car was completed. During World War II, the growth of computing power led to further development of efficient manufacturing methods and the use of advanced mathematical and statistical tools. This was supported by the development of academic programs in industrial and systems engineering disciplines, as well as fields of operations research and management science (as multi-disciplinary fields of problem solving). While systems engineering concentrated on the broad characteristics of the relationships between inputs and outputs of generic systems, operations researchers concentrated on solving specific and focused problems. The synergy of operations research and systems engineering allowed for the realization of solving large scale and complex problems in the modern era. Recently, the development of faster and smaller computers, intelligent systems, and the World Wide Web has opened new opportunities for operations, manufacturing, production, and service systems.
Malakooti (2013) states that production and operation systems can be divided into five phases:[7]
- Empiricism (learning from experience)
- Analysis (scientific management)
- Synthesis (development of mathematical problem solving tools)
- Isolated Systems with Single Objective (use of Integrated and Intelligent Systems, and WWW)
- Integrated Complex Systems with Multiple Objectives (development of ecologically sound systems, environmentally sustainable systems, considering individual preferences)
Industrial Revolution

Before the First industrial revolution work was mainly done through two systems: domestic system and craft guilds. In the domestic system merchants took materials to homes where artisans performed the necessary work, craft guilds on the other hand were associations of artisans which passed work from one shop to another, for example: leather was tanned by a tanner, passed to curriers, and finally arrived at shoemakers and saddlers.
The beginning of the industrial revolution is usually associated with 18th century English textile industry, with the invention of flying shuttle by John Kay in 1733, the spinning jenny by James Hargreaves in 1765, the water frame by Richard Arkwright in 1769 and the steam engine by James Watt in 1765. In 1851 at the Crystal Palace Exhibition the term American system of manufacturing was used to describe the new approach that was evolving in the United States of America which was based on two central features: interchangeable parts and extensive use of mechanization to produce them.
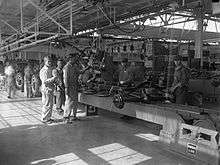
Henry Ford was 39 years old when he founded the Ford Motor Company in 1903, with $28,000 capital from twelve investors. The model T car was introduced in 1908, however it was not until Ford implemented the assembly line concept, that his vision of making a popular car affordable by every middle-class American citizen would be realized. The first factory in which Henry Ford used the concept of the assembly line was Highland Park (1913), he characterized the system as follows:
"The thing is to keep everything in motion and take the work to the man and not the man to the work. That is the real principle of our production, and conveyors are only one of many means to an end"[8]
This became one the central ideas that led to mass production, one of the main elements of the Second Industrial Revolution, along with emergence of the electrical industry and petroleum industry.
Operations management
Although productivity benefited considerably from technological inventions and division of labour, the problem of systematic measurement of performances and the calculation of these by the use of remained somewhat unexplored until Frederick Taylor, whose early work focused on developing what he called a "differential piece-rate system"[9] and a series of experiments, measurements and formulas dealing with cutting metals[10] and manual labor.[11] The differential piece-rate system consisted in offering two different pay rates for doing a job: a higher rate for workers with high productivity (efficiency) and who produced high quality goods (effectiveness) and a lower rate for those who fail to achieve the standard. One of the problems Taylor believed could be solved with this system, was the problem of soldiering: faster workers reducing their production rate to that of the slowest worker. In 1911 Taylor published his "The Principles of Scientific Management",[12] in which he characterized scientific management (also known as Taylorism) as:
- The development of a true science;
- The scientific selection of the worker;
- The scientific education and development of the worker;
- Intimate friendly cooperation between the management and the workers.
Taylor is also credited for developing stopwatch time study, this combined with Frank and Lillian Gilbreth motion study gave way to time and motion study which is centered on the concepts of standard method and standard time. Frank Gilbreth is also responsible for introducing the flow process chart in 1921.[13] Other contemporaries of Taylor worth remembering are Morris Cooke (rural electrification in the 1920s and implementer of Taylor's principles of scientific management in the Philadelphia's Department of Public Works), Carl Barth (speed-and-feed-calculating slide rules ) and Henry Gantt (Gantt chart). Also in 1910 Hugo Diemer published the first industrial engineering book: Factory Organization and Administration.
In 1913 Ford Whitman Harris published his "How Many parts to make at once" in which he presented the idea of the economic order quantity model. He described the problem as follows:
"Interest on capital tied up in wages, material and overhead sets a maximum limit to the quantity of parts which can be profitably manufactured at one time; "setup costs" on the job fix the minimum. Experience has shown one manager a way to determine the economical size of lots"[14]
This paper inspired a large body of mathematical literature focusing on the problem of production planning and inventory control.
In 1924 Walter Shewhart introduced the control chart through a technical memorandum while working at Bell Labs, central to his method was the distinction between common cause and special cause of variation. In 1931 Shewhart published his Economic Control of Quality of Manufactured Product,[15] the first systematic treatment [16] of the subject of Statistical Process Control (SPC).
In the 1940s methods-time measurement (MTM) was developed by H.B. Maynard, JL Schwab and GJ Stegemerten. MTM was the first of a series of predetermined motion time systems, predetermined in the sense that estimates of time are not determined in loco but are derived from an industry standard. This was explained by its originators in a book they published in 1948 called "Method-Time Measurement".[17]
Up to this point in history, optimization techniques were known for a very long time, from the simple methods employed by F.W.Harris to the more elaborate techniques of the calculus of variations developed by Euler in 1733 or the multipliers employed by Lagrange in 1811, and computers were slowly being developed, first as analog computers by Sir William Thomson (1872) and James Thomson (1876) moving to the eletromechanical computers of Konrad Zuse (1939 and 1941). During World War II however, the development of mathematical optimization went through a major boost with the development of the Colossus computer, the first electronic digital computer that was all programmable, and the possibility to computationally solve large linear programming problems, first by Kantorovich[18] in 1939 working for the Soviet government and latter on in 1947 with the simplex method of Dantzig. These methods are known today as belonging to the field of operations research.
From this point on a curious development took place: while in the United States the possibility of applying the computer to business operations led to the development of management software architecture such as MRP and successive modifications, and ever more sophisticated optimization techniques and manufacturing simulation software, in post-war Japan a series of events at Toyota Motor led to the development of the Toyota Production System (TPS) and Lean Manufacturing.
In 1943, in Japan, Taiichi Ohno arrived at Toyota Motor company. Toyota evolved a unique manufacturing system centered on two complementary notions: just in time (produce only what is needed) and autonomation (automation with a human touch). Regarding JIT, Ohno was inspired by American supermarkets:[19] workstations functioned like a supermarket shelf where the customer can get products they need, at the time they need and in the amount needed, the workstation (shelf) is then restocked. Autonomation was developed by Toyoda Sakichi in Toyoda Spinning and Weaving: an automatically activated loom that was also foolproof, that is automatically detected problems. In 1983 J.N Edwards published his "MRP and Kanban-American style" in which he described JIT goals in terms of seven zeros:[20] zero defects, zero (excess) lot size, zero setups, zero breakdowns, zero handling, zero lead time and zero surging. This period also marks the spread of Total Quality Management (TQM) in Japan, ideas initially developed by American authors such as Deming, Juran and Armand V. Feigenbaum.[21] TQM is a strategy for implementing and managing quality improvement on an organizational basis, this includes: participation, work culture, customer focus, supplier quality improvement and integration of the quality system with business goals.[16] Schnonberger[22] identified seven fundamentals principles essential to the Japanese approach:
- Process control: SPC and worker responsibility over quality
- Easy able -to-see quality: boards, gauges, meters, etc. and poka-yoke
- Insistence on compliance: "quality first"
- Line stop: stop the line to correct quality problems
- Correcting one's own errors: worker fixed a defective part if he produced it
- The 100% check: automated inspection techniques and foolproof machines
- Continual improvement: ideally zero defects
In 1987 the International Organization for Standardization (ISO), recognizing the growing importance of quality, issued the ISO 9000, a family of standards related to quality management systems. There has been some controversy though regarding the proper procedures to follow and the amount of paperwork involved.
Meanwhile, in the sixties, a different approach was developed by George W. Plossl and Oliver W. Wight,[23] this approach was continued by Joseph Orlicky as a response to the TOYOTA Manufacturing Program which led to Material Requirements Planning (MRP) at IBM, latter gaining momentum in 1972 when the American Production and Inventory Control Society launched the "MRP Crusade". One of the key insights of this management system was the distinction between dependent demand and independent demand. Independent demand is demand which originates outside of the production system, therefore not directly controllable, and dependent demand is demand for components of final products, therefore subject to being directly controllable by management through the bill of materials, via product design. Orlicky wrote "Materials Requirement Planning" in 1975,[24] the first hard cover book on the subject.[23] MRP II was developed by Gene Thomas at IBM, and expanded the original MRP software to include additional production functions. Enterprise resource planning (ERP) is the modern software architecture, which addresses, besides production operations, distribution, accounting, human resources and procurement.
Recent trends in the field revolve around concepts such as:
- Business Process Re-engineering (launched by Michael Hammer in 1993[25]): a business management strategy focusing on the analysis and design of workflows and business processes within an organization. BPR seeks to help companies radically restructure their organizations by focusing on the ground-up design of their business processes.
- Lean Manufacturing: a systemic method for the elimination of waste ("Muda") within a manufacturing process. Lean also takes into account waste created through overburden ("Muri") and waste created through unevenness in work loads ("Mura"). The term lean manufacturing was coined in the book The Machine that Changed the World.[26]
- Six Sigma (an approach to quality developed at Motorola between 1985-1987): Six Sigma refers to control limits placed at six (6) standard deviations from the mean of a normal distribution, this became very famous after Jack Welch of General Electric launched a company-wide initiative in 1995 to adopt this set of methods. More recently, Six Sigma has included DMAIC (for improving processes) and DFSS (for designing new products and new processes)
- Reconfigurable Manufacturing Systems: a production system designed at the outset for rapid change in its structure, as well as its hardware and software components, in order to quickly adjust its production capacity and functionality within a part family in response to sudden market changes or intrinsic system change.
Topics
Production systems


A production system comprises both the technological elements (machines and tools) and organizational behavior (division of labor and information flow). An individual production system is usually analyzed in the literature referring to a single business, therefore it's usually improper to include in a given production system the operations necessary to process goods that are obtained by purchasing or the operations carried by the customer on the sold products, the reason being simply that since businesses need to design their own production systems this then becomes the focus of analysis, modeling and decision making (also called "configuring" a production system) .
A first possible distinction in production systems (technological classification) is between continuous process production and discrete part production (manufacturing).
- Process production means that the product undergoes physical-chemical transformations and lacks assembly operations, therefore the original raw materials can't easily be obtained from the final product, examples include: paper, cement, nylon and petroleum products.
- Part production (ex:cars and ovens) comprises both fabrication systems and assembly systems. In the first category we find job shops, manufacturing cells, flexible manufacturing systems and transfer lines, in the assembly category we have fixed position systems, assembly lines and assembly shops (both manual and/or automated operations).[27][28]
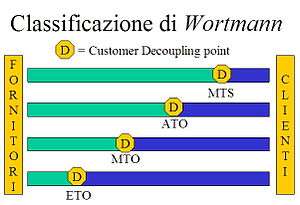
Another possible classification[29] is one based on Lead Time (manufacturing lead time vs delivery lead time): Engineer to Order (ETO, Purchase to Order (PTO), Make to Order (MTO), Assemble to Order (ATO) and Make to Stock (MTS). According to this classification different kinds of systems will have different customer order decoupling points (CODP), meaning that Work in Progress (WIP) cycle stock levels are practically nonexistent regarding operations located after the CODP (except for WIP due to queues). (See Order fulfillment)
The concept of production systems can be expanded to the service sector world keeping in mind that services have some fundamental differences in respect to material goods: intangibility, client always present during transformation processes, no stocks for "finished goods". Services can be classified according to a service process matrix:[30] degree of labor intensity (volume) vs degree of customization (variety). With a high degree of labor intensity there are Mass Services (e.g., commercial banking bill payments and state schools) and Professional Services (e.g., personal physicians and lawyers), while with a low degree of labor intensity there are Service Factories (e.g., airlines and hotels) and Service Shops (e.g., hospitals and auto mechanics).
The systems described above are ideal types: real systems may present themselves as hybrids of those categories. Consider, for example, that the production of jeans involves initially carding, spinning, dyeing and weaving, then cutting the fabric in different shapes and assembling the parts in pants or jackets by combining the fabric with thread, zippers and buttons, finally finishing and distressing the pants/jackets before being shipped to stores.[31] The beginning can be seen as process production, the middle as part production and the end again as process production: it's unlikely that a single company will keep all the stages of production under a single roof, therefore the problem of vertical integration and outsourcing arises. Most products require, from a supply chain perspective, both process production and part production.
Metrics: efficiency and effectiveness
Operations strategy concerns policies and plans of use of the firm productive resources with the aim of supporting long term competitive strategy. Metrics in operations management can be broadly classified into efficiency metrics and effectiveness metrics. Effectiveness metrics involve:
- Price (actually fixed by marketing, but lower bounded by production cost): purchase price, use costs, maintenance costs, upgrade costs, disposal costs
- Quality: specification and compliance
- Time: productive lead time, information lead time, punctuality
- Flexibility: mix, volume, gamma
- Stock availability
- Ecological Soundness: biological and environmental impacts of the system under study.[7]
A more recent approach, introduced by Terry Hill,[32] involves distinguishing competitive variables in order winner and order qualifiers when defining operations strategy. Order winners are variables which permit differentiating the company from competitors, while order qualifiers are prerequisites for engaging in a transaction. This view can be seen as a unifying approach between operations management and marketing (see segmentation and positioning).
Productivity is a standard efficiency metric for evaluation of production systems, broadly speaking a ratio between outputs and inputs, and can assume many specific forms,[33] for example: machine productivity, workforce productivity, raw material productivity, warehouse productivity (=inventory turnover). It is also useful to break up productivity in use U (productive percentage of total time) and yield η (ratio between produced volume and productive time) to better evaluate production systems performances. Cycle times can be modeled through manufacturing engineering if the individual operations are heavily automated, if the manual component is the prevalent one, methods used include: time and motion study, predetermined motion time systems and work sampling.
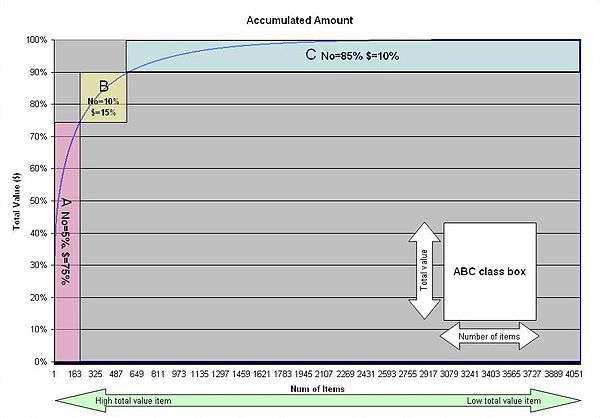
ABC analysis is a method for analyzing inventory based on Pareto distribution, it posits that since revenue from items on inventory will be power law distributed then it makes sense to manage items differently based on their position on a revenue-inventory level matrix, 3 classes are constructed (A,B and C) from cumulative item revenues, so in a matrix each item will have a letter (A,B or C) assigned for revenue and inventory. This method posits that items away from the diagonal should be managed differently: items in the upper part are subject to risk of obsolescence, items in the lower part are subject to risk of stockout.
Throughput is a variable which quantifies the number of parts produced in the unit of time. Although estimating throughput for a single process maybe fairly simple, doing so for an entire production system involves an additional difficulty due to the presence of queues which can come from: machine breakdowns, processing time variability, scraps, setups, maintenance time, lack of orders, lack of materials, strikes, bad coordination between resources, mix variability, plus all these inefficiencies tend to compound depending on the nature of the production system. One important example of how system throughput is tied to system design are bottlenecks: in job shops bottlenecks are typically dynamic and dependent on scheduling while on transfer lines it makes sense to speak of "the bottleneck" since it can be univocally associated with a specific station on the line. This leads to the problem of how to define capacity measures, that is an estimation of the maximum output of a given production system, and capacity utilization.
Overall Equipment Effectiveness (OEE) is defined as the product between system availability, cycle time efficiency and quality rate. OEE is typically used as key performance indicator (KPI) in conjunction with the lean manufacturing approach.
Configuration and management
Designing the configuration of production systems involves both technological and organizational variables. Choices in production technology involve: dimensioning capacity, fractioning capacity, capacity location, outsourcing processes, process technology, automation of operations, trade-off between volume and variety (see Hayes-Wheelwright matrix). Choices in the organizational area involve: defining worker skills and responsibilities, team coordination, worker incentives and information flow.
Regarding production planning, there is a basic distinction between the push approach and the pull approach, with the later including the singular approach of just in time. Pull means that the production system authorizes production based on inventory level; push means that production occurs based on demand (forecasted or present, that is purchase orders). An individual production system can be both push and pull; for example activities before the CODP may work under a pull system, while activities after the CODP may work under a push system.

Regarding the traditional pull approach to inventory control, a number of techniques have been developed based on the work of Ford W. Harris[14] (1913), which came to be known as the economic order quantity (EOQ) model. This model marks the beginning of inventory theory, which includes the Wagner-Within Procedure, the News Vendor Model, Base Stock Model and the Fixed Time Period model. These models usually involve the calculation of cycle stocks and buffer stocks, the latter usually modeled as a function of demand variability. The Economic Production Quantity[34] (EPQ) differs from the EOQ model only in that it assumes a constant fill rate for the part being produced, instead of the instantaneous refilling of the EOQ model.
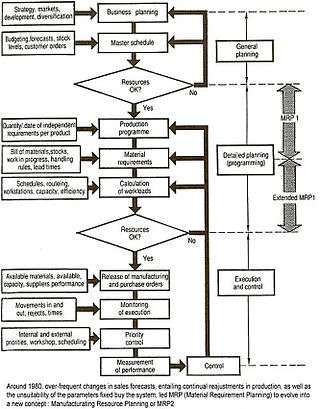
Joseph Orlickly and others at IBM developed a push approach to inventory control and production planning, now known as material requirements planning (MRP), which takes as input both the Master Production Schedule (MPS) and the Bill of Materials (BOM) and gives as output a schedule for the materials (components) needed in the production process. MRP therefore is a planning tool to manage purchase orders and production orders (also called jobs).
The MPS can be seen as a kind of aggregate planning for production coming in two fundamentally opposing varieties: plans which try to chase demand and level plans which try to keep uniform capacity utilization. Many models have been proposed to solve MPS problems:
- Analytical models (e.g. Magee Boodman model)
- Exact optimization algorithmic models (e.g. LP and ILP)
- Heuristic models (e.g. Aucamp model).
MRP can be briefly described as a 3s procedure: sum (different orders), split (in lots), shift (in time according to item lead time). To avoid an "explosion" of data processing in MRP (number of BOMs required in input) planning bills (such as family bills or super bills) can be useful since they allow a rationalization of input data into common codes. MRP had some notorious problems such as infinite capacity and fixed lead times, which influenced successive modifications of the original software architecture in the form of MRP II, enterprise resource planning (ERP) and Advanced planning and scheduling (APS).
In this context problems of scheduling (sequencing of production), loading (tools to use), part type selection (parts to work on) and applications of operations research have a significant role to play.
Lean manufacturing is an approach to production which arose in Toyota between the end of World War II and the seventies. It comes mainly from the ideas of Taiichi Ohno and Toyoda Sakichi which are centered on the complementary notions of just in time and autonomation (jidoka), all aimed at reducing waste (usually applied in PDCA style). Some additional elements are also fundamental:[35] production smoothing (Heijunka), capacity buffers, setup reduction, cross-training and plant layout.
- Heijunka: production smoothing presupposes a level strategy for the MPS and a final assembly schedule developed from the MPS by smoothing aggregate production requirements in smaller time buckets and sequencing final assembly to achieve repetitive manufacturing. If these conditions are met, expected throughput can be equaled to the inverse of takt time. Besides volume, heijunka also means attaining mixed model production, which however may only be feasible through set-up reduction. A standard tool for achieving this is the Heijunka box.
- Capacity buffers: ideally a JIT system would work with zero breakdowns, this however is very hard to achieve in practice, nonetheless Toyota favors acquiring extra capacity over extra WIP to deal with starvation.
- Set-up reduction: typically necessary to achieve mixed model production, a key distinction can be made between internal and external setup. Internal setups (e.g. removing a die) refers to tasks when the machine is not working, while external setups can be completed while the machine is running (ex:transporting dies).
- Cross training: important as an element of Autonomation, Toyota cross trained their employees through rotation, this served as an element of production flexibility, holistic thinking and reducing boredom.
- Layout: U-shaped lines or cells are common in the lean approach since they allow for minimum walking, greater worker efficiency and flexible capacity.
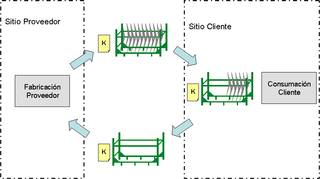
A series of tools have been developed mainly with the objective of replicating Toyota success: a very common implementation involves small cards known as kanbans; these also come in some varieties: reorder kanbans, alarm kanbans, triangular kanbans, etc. In the classic kanban procedure with one card:
- Parts are kept in containers with their respective kanbans
- The downstream station moves the kanban to the upstream station and starts producing the part at the downstream station
- The upstream operator takes the most urgent kanban from his list (compare to queue discipline from queue theory) and produces it and attach its respective kanban
The two-card kanban procedure differs a bit:
- The downstream operator takes the production kanban from his list
- If required parts are available he removes the move kanban and places them in another box, otherwise he chooses another production card
- He produces the part and attach its respective production kanban
- Periodically a mover picks up the move kanbans in upstream stations and search for the respective parts, when found he exchanges production kanbans for move kanbans and move the parts to downstream stations
Since the number of kanbans in the production system is set by managers as a constant number, the kanban procedure works as WIP controlling device, which for a given arrival rate, per Little's Law, works as a lead time controlling device.

In Toyota the TPS represented more of a philosophy of production than a set of specific lean tools, the latter would include:
- SMED: a method for reducing changeover times
- Value Stream Mapping: a graphical method for analyzing the current state and designing a future state
- lot-size reduction
- elimination of time batching
- Rank Order Clustering: an algorithm which groups machines and product families together, used for designing manufacturing cells
- single-point scheduling, the opposite of the traditional push approach
- multi-process handling: when one operator is responsible for operating several machines or processes
- poka-yoke: any mechanism in lean manufacturing that helps an equipment operator avoid (yokeru) mistakes (poka)
- 5S: describes how to organize a work space for efficiency and effectiveness by identifying and storing the items used, maintaining the area and items, and sustaining the new order
- backflush accounting: a product costing approach in which costing is delayed until goods are finished
Seen more broadly, JIT can include methods such as: product standardization and modularity, group technology, total productive maintenance, job enlargement, job enrichment, flat organization and vendor rating (JIT production is very sensitive to replenishment conditions).
In heavily automated production systems production planning and information gathering may be executed via the control system, attention should be paid however to avoid problems suck as deadlocks, as these can lead to productivity losses.
Mathematical Modeling


There are also fields of mathematical theory which have found applications in the field of operations management such as operations research: mainly mathematical optimization problems and queue theory. Queue theory is employed in modelling queue and processing times in production systems while mathematical optimization draws heavily from multivariate calculus and linear algebra. Queue theory is based on Markov chains and stochastic processes.[37] It also worth noticing that computations of safety stocks are usually based on modeling demand as a normal distribution and MRP and some inventory problems can be formulated using optimal control.[38]
When analytical models are not enough, managers may resort to using simulation. Simulation has been traditionally done thought the Discrete event simulation paradigm, where the simulation model possesses a state which can only change when a discrete event happens, which consists of a clock and list of events. The more recent Transaction-level modeling paradigm consists of a set of resources and a set of transactions: transactions move through a network of resources (nodes) according to a code, called process.

Since real production processes are always affected by disturbances in both inputs and outputs, many companies implement some form of Quality management or quality control. The Seven Basic Tools of Quality designation provides a summary of commonly used tools:
- check sheets
- Pareto charts
- Ishikawa diagrams (Cause-and-effect diagram)
- control charts
- histogram
- scatter diagram
- stratification
These are used in approaches like Total quality management and Six Sigma. Keeping quality under control is relevant to both increasing customer satisfaction and reducing processing waste.
Operations management textbooks usually cover demand forecasting, even though it is not strictly speaking an operations problem, because demand is related to some production systems variables. For example, a classic approach in dimensioning safety stocks requires calculating standard deviation of forecast errors. Demand forecasting is also a critical part of push systems, since order releases have to be planned ahead of actual clients orders. Also any serious discussion of capacity planning involves adjusting company outputs with market demands.
Safety, Risk and Maintenance
Other important management problems involve maintenance policies [39] (see also reliability engineering and maintenance philosophy), safety management systems (see also safety engineering and Risk management), facility management and supply chain integration.
Organizations
The following organizations support and promote operations management:
- Association for Operations Management (APICS) which supports the Production and Inventory Management Journal
- European Operations Management Association (EurOMA) which supports the International Journal of Operations & Production Management
- Production and Operations Management Society (POMS) which supports the journal: Production and Operations Management
- Institute for Operations Research and the Management Sciences (INFORMS)
- The Manufacturing and Service Operations Management Society (MSOM) of INFORMS which supports the journal: Manufacturing & Service Operations Management
- Institute of Operations Management (UK)
- Association of Technology, Management, and Applied Engineering (ATMAE)
Journals
The following high-ranked[40] academic journals are concerned with Operations Management issues:
- Management Science
- Manufacturing & Service Operations Management
- Operations Research
- International Journal of Operations & Production Management
- Production and Operations Management
Academic Job Market
Since January 2014 the following website has been created and dedicated to collecting and displaying valuable information related to the academic job market search of Operations Research/Management Science and related fields and disciplines:
The website operates as a multi-sided marketplace connecting job posters, job candidates and anyone interested in getting further insights on the academic job market in "Operations" (broadly defined). The website OperationsAcademia.org publicly shows available Job Postings, PhD Candidates on the market, and runs an Annual Job Market Survey. The interested visitor may also find information on recently hired Professors in Operations related departments, and all past job market postings and placements since 2014.
See also
References
- ↑ OperationsAcademia.org: showing the state-of-the-art of research in Operations Research/Management Science and related disciplines Retrieved on October 22, 2016
- ↑ Great Operations: What is Operations Management Retrieved on July 3, 2013
- ↑ U.S. Department of Education Institute of Education Sciences: Classification of Instructional Programs (CIP). Retrieved on October 26, 2009 from CIP 2000 - CIP Lookup to Occupational Crosswalks
- ↑ ATMAE Membership Venn Diagram Archived November 13, 2013, at the Wayback Machine.
- ↑ Friedrick Klemm, A history of Western Technology, Charles Scribner's Sons 1959 in D. A. Wren and A. G. Bedeian, The Evolution of Management Thought, Wiley 2009
- ↑ D. A. Wren and A. G. Bedeian, The Evolution of Management Thought, Wiley 2009
- 1 2 Malakooti, Behnam (2013). Operations and Production Systems with Multiple Objectives. John Wiley & Sons. ISBN 978-1-118-58537-5.
- ↑ Henry Ford, Today and Tomorrow, New York, 1926
- ↑ Taylor, Frederick Winslow (1896), A Piece Rate System, read before the American Society of Mechanical Engineers http://wps.prenhall.com/wps/media/objects/107/109902/ch17_a3_d2.pdf
- ↑ Taylor, F. W., On the Art of Cutting Metals, American society of Mechanical Engineers (1906)
- ↑ Taylor, F. W., Shop management (1903), a handbook read before the American society of mechanical engineers, New York (this has been republished in 1911 https://archive.org/details/shopmanagement00taylgoog)
- ↑ Taylor, Frederick Winslow (1911). The Principles of Scientific Management. New York, NY, US and London, UK: Harper & Brothers. LCCN 11010339. OCLC 233134. Also available from Project Gutenberg.
- ↑ Frank Bunker Gilbreth, Lillian Moller Gilbreth (1921) Process Charts. American Society of Mechanical Engineers.
- 1 2 Harris, Ford W. (1990) [Reprint from 1913]. "How Many Parts to Make at Once" (PDF). Operations Research. INFORMS. 38 (6): 947–950. doi:10.1287/opre.38.6.947. JSTOR 170962. Retrieved Nov 21, 2012.
- ↑ Shewhart, Walter Andrew, Economic control of quality of manufactured product, 1931, New York: D. Van Nostrand Company. pp. 501 p.. ISBN 0-87389-076-0 (edition 1st). LCCN 132090. OCLC 1045408. LCC TS155 .S47.
- 1 2 D.C. Montgomery, Statistical Quality Control: A Modern Introduction, 7th edition 2012
- ↑ H.B. Maynard, J.L. Schwab, G.J. Stegemerten, Methods Time Measurement, McGraw-Hill 1948 http://www.library.wisc.edu/selectedtocs/ca1794.pdf
- ↑ L. V. Kantorovich, Mathematical Methods of Organizing and Planning Production, Management Science 1960 [English translation from 1939]
- ↑ Taiichi Ohno, Toyota Production System, Productivity Pres 1988
- ↑ J. N. Edwards, MRP and Kanban-American style, APICS 26th Conference Proceedings,pp586-603 1983
- ↑ Feigenbaum, Armand Vallin (1961), Total Quality Control, McGraw-Hill, OCLC 250573852
- ↑ R. J. Schnonberger, Japanese Manufacturing Techniques:Nine Hidden Lessons in Simplicity, New York 1982
- 1 2 R.B. Grubbström, Modelling production opportunities - an historical overview, Int. J. Production Economics 1995
- ↑ Orlickly, Materials Requirement Planning, McGraw-Hill 1975
- ↑ M.Hammer, J.Champy, Reengineering the Corporation: A Manifesto for Business Revolution, Harper Business 1993
- ↑ Womack, Jones, Roos, The Machine that Changed the World, Free Press, 1990
- 1 2 A. Portioli, A.Pozzetti, Progettazione dei sistemi produttivi, Hoepli 2003
- ↑ Note: this classification is very old but it has been subject to update as production systems have evolved over the 20th century, for a complete picture consult recent texts
- ↑ J.C. Wortmann, Chapter: "A classification scheme for master production schedule", in Efficiency of Manufacturing Systems, C. Berg, D. French and B. Wilson (eds) New York, Plenum Press 1983
- ↑ Roger W. Schmenner, How Can Service Businesses Survive and Prosper?, Sloan Management Review, vol. 27, no. 3, Spring 1986 http://umairbali.ekalaam.com/Business%20Process%20Workflow%20Analysis/Week6/SMR-ServiceBusiness.pdf
- ↑ "How blue jeans is made - material, manufacture, making, history, used, procedure, steps, product, machine". madehow.com.
- ↑ T. Hill, Manufacturing Strategy-Text and Cases, 3rd ed. Mc-Graw Hill 2000
- ↑ Grando A., Organizzazione e Gestione della Produzione Industriale, Egea 1993
- ↑ Taft, E. W. "The most economical production lot." Iron Age 101.18 (1918): 1410-1412.
- ↑ W. Hopp, M. Spearman, Factory Physics, 3rd ed. Waveland Press, 2011
- ↑ R. B. Chase, F.R. Jacobs, N. Aquilano, Operations Management: For Competitive Advantage, McGraw-Hill 2007
- ↑ Burnetas A.N. and M. N.Katehakis (1993).. "On Sequencing Two Types of Tasks on a Single Processor under Incomplete Information", Probability in the Engineering and Informational Sciences, 7 (1), 85-0119.
- ↑ Zipkin Paul H., Foundations of Inventory Management, Boston: McGraw Hill, 2000, ISBN 0-256-11379-3
- ↑ Katehakis M.N. and C. Derman (1989). "On the maintenance of systems composed of highly reliable components", Management Science, 6 (5): 16-28.
- ↑ http://vhbonline.org/uploads/media/Ranking_Gesamt_2.1.pdf
Further reading
- D. Wren, The Evolution of Management Thought, 3rd ed. New York Wiley 1987
- W. Hopp, M. Spearman, Factory Physics, 3rd ed. Waveland Press, 2011 online (Part 1 contains both description and critical evaluation of the historical development of the field)
- R. B. Chase, F.R. Jacobs, N.J.Aquilano, Operations Management for Competitive Advantage, 11th ed McGraw-Hill 2007
- Askin, R. G., C.R. Standridge, Modeling & Analysis Of Manufacturing Systems, John Wiley and Sons, New York 1993
- J.A. Buzacott, J.G. Shanthikumar, Stochastic models of manufacturing systems, Prentice Hall, 1993
- D.C. Montgomery, Statistical Quality Control: A Modern Introduction, 7th edition 2012
- R.G. Poluha: The Quintessence of Supply Chain Management: What You Really Need to Know to Manage Your Processes in Procurement, Manufacturing, Warehousing and Logistics (Quintessence Series). First Edition. Springer Heidelberg New York Dordrecht London 2016. ISBN 978-3662485132
| By type of organization | |||||||||||||||||||||||||||||||
|---|---|---|---|---|---|---|---|---|---|---|---|---|---|---|---|---|---|---|---|---|---|---|---|---|---|---|---|---|---|---|---|
| By focus (within an organization) |
| ||||||||||||||||||||||||||||||
| Management positions | |||||||||||||||||||||||||||||||
| Methods and approaches | |||||||||||||||||||||||||||||||
| Management skills and activities | |||||||||||||||||||||||||||||||
| Pioneers and scholars | |||||||||||||||||||||||||||||||
| Education | |||||||||||||||||||||||||||||||
| Other |
| ||||||||||||||||||||||||||||||