Olten District

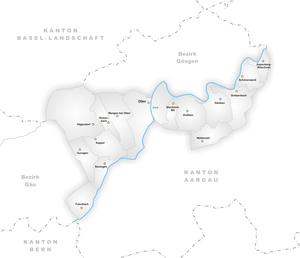
Olten District is one of the ten districts of the canton of Solothurn in Switzerland, situated around the city of Olten. Together with the Gösgen District, it forms the electoral district of Olten-Gösgen. It has a population of 53,721 (as of 31 December 2015).
Municipalities
Olten District contains the following municipalities:
| Coat of arms | Municipality | Population (31 December 2015)[1] |
Area, km² |
|---|---|---|---|
| |
Boningen | 735 | 2.82 |
| |
Däniken | 2,769 | 5.37 |
| |
Dulliken | 4,897 | 6.02 |
| |
Eppenberg-Wöschnau | 317 | 1.89 |
| |
Fulenbach | 1,726 | 4.47 |
| |
Gretzenbach | 2,643 | 5.79 |
| |
Gunzgen | 1,655 | 3.91 |
| |
Hägendorf | 4,866 | 13.87 |
| |
Kappel | 3,087 | 5.09 |
| |
Olten | 17,833 | 11.50 |
| |
Rickenbach | 840 | 2.80 |
| |
Schönenwerd | 4,873 | 3.77 |
| |
Starrkirch-Wil | 1,700 | 1.83 |
| |
Walterswil | 692 | 4.53 |
| |
Wangen bei Olten | 5,088 | 6.94 |
| Total | 53,721 | 80.60 |
Mergers and name changes
On 1 January 1973 the former municipality of Grod merged into the municipality of Gretzenbach.[2]
Geography
Olten has an area, as of 2009, of 80.55 square kilometers (31.10 sq mi). Of this area, 24.88 km2 (9.61 sq mi) or 30.9% is used for agricultural purposes, while 34.43 km2 (13.29 sq mi) or 42.7% is forested. Of the rest of the land, 19.7 km2 (7.6 sq mi) or 24.5% is settled (buildings or roads), 1.38 km2 (0.53 sq mi) or 1.7% is either rivers or lakes and 0.16 km2 (0.062 sq mi) or 0.2% is unproductive land.[3]
Of the built up area, industrial buildings made up 3.3% of the total area while housing and buildings made up 11.2% and transportation infrastructure made up 6.4%. Power and water infrastructure as well as other special developed areas made up 2.3% of the area while parks, green belts and sports fields made up 1.3%. Out of the forested land, 41.2% of the total land area is heavily forested and 1.5% is covered with orchards or small clusters of trees. Of the agricultural land, 29.1% is used for growing crops, while 1.3% is used for orchards or vine crops. All the water in the district is flowing water.[3]
Coat of arms
The blazon of the municipal coat of arms is Argent three Fir Trees trunked Gules issuant from a Mount of 3 Coupeaux of the second.[4]
Demographics
Olten has a population (as of December 2015) of 53,721.[5]
Most of the population (as of 2000) speaks German (42,187 or 86.1%), with Italian being second most common (2,130 or 4.3%) and Albanian being third (855 or 1.7%). There are 377 people who speak French and 48 people who speak Romansh.[6]
As of 2008, the gender distribution of the population was 49.5% male and 50.5% female. The population was made up of 18,728 Swiss men (36.5% of the population) and 6,688 (13.0%) non-Swiss men. There were 20,186 Swiss women (39.3%) and 5,772 (11.2%) non-Swiss women.[7] Of the population in the district 12,962 or about 26.5% were born in Olten and lived there in 2000. There were 11,079 or 22.6% who were born in the same canton, while 13,820 or 28.2% were born somewhere else in Switzerland, and 9,397 or 19.2% were born outside of Switzerland.[6]
In 2008 there were 277 live births to Swiss citizens and 163 births to non-Swiss citizens, and in same time span there were 413 deaths of Swiss citizens and 34 non-Swiss citizen deaths. Ignoring immigration and emigration, the population of Swiss citizens decreased by 136 while the foreign population increased by 129. There were 38 Swiss men and 31 Swiss women who immigrated back to Switzerland. At the same time, there were 214 non-Swiss men and 146 non-Swiss women who immigrated from another country to Switzerland. The total Swiss population change in 2008 (from all sources, including moves across municipal borders) was a decrease of 119 and the non-Swiss population increased by 284 people. This represents a population growth rate of 0.3%.[8]
As of 2000, there were 19,413 people who were single and never married in the district. There were 23,656 married individuals, 3,173 widows or widowers and 2,744 individuals who are divorced.[6]
There were 7,298 households that consist of only one person and 1,254 households with five or more people. Out of a total of 21,532 households that answered this question, 33.9% were households made up of just one person and 162 were adults who lived with their parents. Of the rest of the households, there are 6,311 married couples without children, 6,134 married couples with children There were 1,028 single parents with a child or children. There were 305 households that were made up unrelated people and 294 households that were made some sort of institution or another collective housing.[6]
The historical population is given in the following chart:[9]

Politics
In the 2007 federal election the most popular party was the SVP which received 29.04% of the vote. The next three most popular parties were the SP (20.67%), the CVP (19.5%) and the FDP (18.08%). In the federal election, a total of 16,855 votes were cast, and the voter turnout was 51.3%.[10]
Religion
From the 2000 census, 21,525 or 43.9% were Roman Catholic, while 13,418 or 27.4% belonged to the Swiss Reformed Church. Of the rest of the population, there were 831 members of an Orthodox church (or about 1.70% of the population), there were 721 individuals (or about 1.47% of the population) who belonged to the Christian Catholic Church, and there were 1,007 individuals (or about 2.06% of the population) who belonged to another Christian church. There were 17 individuals (or about 0.03% of the population) who were Jewish, and 3,278 (or about 6.69% of the population) who were Islamic. There were 170 individuals who were Buddhist, 231 individuals who were Hindu and 43 individuals who belonged to another church. 6,242 (or about 12.74% of the population) belonged to no church, are agnostic or atheist, and 1,503 individuals (or about 3.07% of the population) did not answer the question.[6]
Education
In Olten about 18,874 or (38.5%) of the population have completed non-mandatory upper secondary education, and 5,493 or (11.2%) have completed additional higher education (either University or a Fachhochschule). Of the 5,493 who completed tertiary schooling, 66.9% were Swiss men, 20.2% were Swiss women, 8.1% were non-Swiss men and 4.8% were non-Swiss women.[6]
References
- ↑ Swiss Federal Statistical Office - STAT-TAB, online database – Ständige und nichtständige Wohnbevölkerung nach institutionellen Gliederungen, Geburtsort und Staatsangehörigkeit (German) accessed 30 August 2016
- ↑ Nomenklaturen – Amtliches Gemeindeverzeichnis der Schweiz (German) accessed 4 April 2011
- 1 2 Swiss Federal Statistical Office-Land Use Statistics 2009 data (German) accessed 25 March 2010
- ↑ Flags of the World.com accessed 15-March-2011
- ↑ Swiss Federal Statistical Office - STAT-TAB, online database – Ständige und nichtständige Wohnbevölkerung nach institutionellen Gliederungen, Geburtsort und Staatsangehörigkeit (German) accessed 30 August 2016
- 1 2 3 4 5 6 STAT-TAB Datenwürfel für Thema 40.3 - 2000 (German) accessed 2 February 2011
- ↑ Canton of Solothurn Statistics - Wohnbevölkerung der Gemeinden nach Nationalität und Geschlecht (German) accessed 11 March 2011
- ↑ Swiss Federal Statistical Office - Superweb database - Gemeinde Statistics 1981-2008 (German) accessed 19 June 2010
- ↑ Swiss Federal Statistical Office STAT-TAB Bevölkerungsentwicklung nach Region, 1850-2000 (German) accessed 29 January 2011
- ↑ Swiss Federal Statistical Office, Nationalratswahlen 2007: Stärke der Parteien und Wahlbeteiligung, nach Gemeinden/Bezirk/Canton (German) accessed 28 May 2010
Coordinates: 47°21′12″N 7°54′28″E / 47.35333°N 7.90778°E