Northern Ireland Assembly election, 1998
| | |||||||||||||||||||||||||||||||||||||||||||||||||||||||||||||||||||||||||||||||||||||||||||||||||||||||||||||||||||
| |||||||||||||||||||||||||||||||||||||||||||||||||||||||||||||||||||||||||||||||||||||||||||||||||||||||||||||||||||
| |||||||||||||||||||||||||||||||||||||||||||||||||||||||||||||||||||||||||||||||||||||||||||||||||||||||||||||||||||
|
| |||||||||||||||||||||||||||||||||||||||||||||||||||||||||||||||||||||||||||||||||||||||||||||||||||||||||||||||||||
| Percentage of seats gained by each of the party. | |||||||||||||||||||||||||||||||||||||||||||||||||||||||||||||||||||||||||||||||||||||||||||||||||||||||||||||||||||
| |||||||||||||||||||||||||||||||||||||||||||||||||||||||||||||||||||||||||||||||||||||||||||||||||||||||||||||||||||

.png)


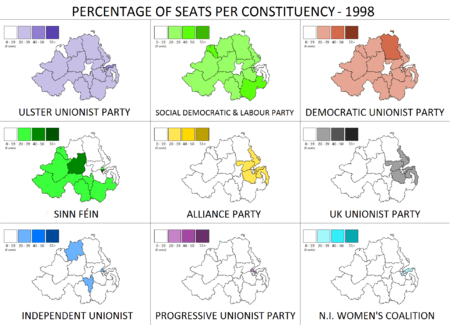
The first elections to the Northern Ireland Assembly were held on Thursday 25 June 1998. Six members were elected by Single Transferable Vote from each of Northern Ireland's eighteen Westminster Parliamentary constituencies, giving a total of 108 MLAs, or Members of the Legislative Assembly.
 |
| This article is part of a series on the politics and government of Northern Ireland |
|
Northern Ireland in the EU |
Results
The result was (first preference votes only):

| Party |
Leader |
Seats |
% of seats |
Votes |
% of vote |
Rank | |
| UUP | Trimble, DavidDavid Trimble | 28 | 25.9% | 172,225 | 21.28% | 2 | |
| SDLP | Hume, JohnJohn Hume | 24 | 22.2% | 177,963 | 21.99% | 1 | |
| DUP | Paisley, IanIan Paisley | 20 | 18.5% | 145,917 | 18.03% | 3 | |
| Sinn Féin | Adams, GerryGerry Adams | 18 | 16.7% | 142,858 | 17.65% | 4 | |
| Alliance | Alderdice, JohnJohn Alderdice | 6 | 5.6% | 52,636 | 6.50% | 5 | |
| UK Unionist | McCartney, RobertRobert McCartney | 5 | 4.6% | 36,541 | 4.52% | 6 | |
| Independent Unionist | 3 | 2.8% | 24,339 | 3.00% | 7 | ||
| PUP | Smyth, HughHugh Smyth | 2 | 1.9% | 20,634 | 2.55% | 8 | |
| NI Women's Coalition | McWilliams, MonicaMonica McWilliams | 2 | 1.9% | 13,019 | 1.61% | 9 | |
| Ulster Democratic | McMichael, GaryGary McMichael | 0 | 8,651 | 1.07% | 10 | ||
| Independent | 0 | 5,392 | 0.69% | * | |||
| Labour Party NI | Curran, MalachiMalachi Curran | 0 | 2,729 | 0.34% | 11 | ||
| Workers' Party | French, TomTom French | 0 | 1,989 | 0.25% | 12 | ||
| NI Conservatives | Hague, WilliamWilliam Hague | 0 | 1,835 | 0.23% | 13 | ||
| Ulster Independence | Ross, HughHugh Ross | 0 | 1,227 | 0.15% | 17 | ||
| Natural Law | Anderson, JamesJames Anderson | 0 | 832 | 0.10% | 18 | ||
| Socialist Party | Higgins, JoeJoe Higgins | 0 | 789 | 0.10% | 19 | ||
| Green (NI) | 0 | 710 | 0.09% | 20 | |||
| Total | 108 | 100.0% | 786,132 | 100.0% | |||
All parties with over 500 votes listed. Electorate: 1,178,556; Turnout: 823,565 (69.88%); Spoiled votes: 13,248; Valid: 810,317.
- ¹ Independent candidates were ranked 14, 15 and 16; other independents won fewer than 500 votes.
Votes summary
Seats summary
Details
Although the SDLP won the most first preference votes, the Ulster Unionists won the most seats in the Assembly. This has been attributed to several reasons, including:
- Slightly different turnouts across the province, with the result that in the more staunchly unionist east fewer votes were required to elect an MLA than in the SDLP's heartlands in the west.
- The Ulster Unionists proved better at "vote balancing" whereby in the rounds of transfers their candidates were less likely to be eliminated earlier on.
- The Ulster Unionists proved better at attracting transfers from other parties (and due to the vote balancing mentioned above, were more likely to be in a position to benefit from this)
See also
This article is issued from Wikipedia - version of the 5/27/2016. The text is available under the Creative Commons Attribution/Share Alike but additional terms may apply for the media files.