Normanton (UK Parliament constituency)
Coordinates: 53°42′00″N 1°24′54″W / 53.700°N 1.415°W
| Normanton | |
|---|---|
|
Former County constituency for the House of Commons | |
|
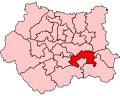
Boundary of Normanton in West Yorkshire for the 2005 general election. | |
|
Location of West Yorkshire within England. | |
| County | West Yorkshire |
| 1885–2010 | |
| Number of members | One |
| Replaced by | Normanton, Pontefract and Castleford, Morley and Outwood and Wakefield |
| Created from | Southern West Riding of Yorkshire |

Normanton was a county constituency represented in the House of Commons of the Parliament of the United Kingdom. It elected one Member of Parliament (MP) by the first past the post system of election.
Boundaries
1918–1950: The Urban Districts of Altofts, Castleford, Featherstone, Methley, Normanton, and Whitwood.
1950–1983: The Urban Districts of Normanton, Rothwell, and Stanley, in the Rural District of Tadcaster the civil parishes of Great and Little Preston, and Swillington, and in the Rural District of Wakefield the civil parishes of Crofton, Sharlston, and Warmfield-cum-Heath.
1983–1997: The City of Wakefield wards of Normanton and Sharlston, Ossett, Stanley and Altofts, and Stanley and Wrenthorpe, and the City of Leeds ward of Rothwell.
1997–2010: The City of Wakefield wards of Horbury, Normanton and Sharlston, Ossett, Stanley and Altofts, and Stanley and Wrenthorpe.
The West Yorkshire constituency includes the towns of Normanton and Ossett and several villages. The area has a tradition of being working-class, but it has now become almost entirely gentrified as nearby Leeds has expanded as a financial centre.
Ossett is now actually the largest town in the area, due to its high growth in recent years. The Tory vote is very low in Normanton itself and in Ossett, but councillors have been elected for Horbury and for Wrenthorpe. Until recently the LibDems had all three councillors for the "Ossett" ward, but have never performed well in general elections, in this area. "Stanley and Outwood East" is a fairly safe Labour ward.
The constituency is nicknamed the banana constituency on account of its unusual shape.
The village of Altofts, located just to the north of Normanton, is currently included in the constituency, despite being part of a Castleford ward. The village is planned to move into a proposed "Pontefract and Castleford" seat. (but see below)
Boundary review
Following their review of parliamentary representation in West Yorkshire, the Boundary Commission for England had created a Normanton and Pontefract constituency. In late May 2006, the Commission published a revised recommendation changing the name of this constituency to Normanton, Pontefract and Castleford.
Local newspapers and the Labour Party opposed the initial change, but following a public consultation the Commission decided to create the seat conceding only a name change – from Pontefract and Castleford, to Normanton and Pontefract. This was extended to cover all three names. The wards of "Wrenthorpe and Outwood West" and "Stanley and Outwood East" – the most affluent part of the constituency – were joined to the Conservative-leaning commuter town of Morley, which is in the Leeds district, as Morley and Outwood. At the time local groups and newspapers protested that this represented a takeover of the Wakefield district by the Leeds district. An early concern of the Labour Party was that "Morley and Outwood" would be won the Conservatives, which ultimately did happen at the 2015 General Election. Ossett and Horbury were moved to the Wakefield constituency.
Members of Parliament
The constituency elected only Labour MPs since 1905, the longest run (with Gower and Makerfield) of any UK constituency. From 1885 to 1906, it had returned Liberal-Labour MPs.
Ed Balls, the former Secretary of State for Children, Schools and Families, represented the seat from the 2005 general election until 2010 when it was abolished.
| Election | Member[1] | Party | |
|---|---|---|---|
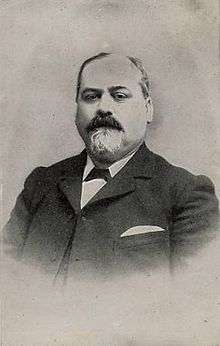
| 1885 | Benjamin Pickard | Lib-Lab | |
| 1904 by-election | William Parrott | Lib-Lab | |
| 1905 by-election | Frederick Hall | Lib-Lab | |
| 1909 | Labour | ||
| 1933 by-election | Tom Smith | Labour | |
| 1947 by-election | George Sylvester | Labour | |
| 1950 | Thomas Brooks | Labour | |
| 1951 | Albert Roberts | Labour | |
| 1983 | Bill O'Brien | Labour | |
| 2005 | Ed Balls | Labour Co-op | |
| 2010 | constituency abolished : see Normanton, Pontefract and Castleford and Morley and Outwood | ||
Election results
Elections in the 1880s

| Party | Candidate | Votes | % | ± | |
|---|---|---|---|---|---|
| Lib-Lab | Benjamin Pickard | 5,615 | 60.2 | n/a | |
| Conservative | Albany Hawkes Charlesworth | 3,706 | 29.8 | n/a | |
| Majority | 1,909 | 20.4 | n/a | ||
| Turnout | 9,321 | 81.2 | n/a | ||
| Lib-Lab win (new seat) | |||||
| Party | Candidate | Votes | % | ± | |
|---|---|---|---|---|---|
| Lib-Lab | Benjamin Pickard | 4,771 | 56.2 | -4.0 | |
| Conservative | Albany Hawkes Charlesworth | 3,724 | 46.8 | +4.0 | |
| Majority | 1,047 | 12.4 | -8.0 | ||
| Turnout | 8,495 | 74.0 | -7.2 | ||
| Lib-Lab hold | Swing | -4.0 | |||
Elections in the 1890s
| Party | Candidate | Votes | % | ± | |
|---|---|---|---|---|---|
| Lib-Lab | Benjamin Pickard | 6,134 | 61.7 | +5.5 | |
| Conservative | Percy Tew | 3,803 | 38.3 | -5.5 | |
| Majority | 2,331 | 23.4 | +11.0 | ||
| Turnout | 9,937 | 76.4 | +2.4 | ||
| Lib-Lab hold | Swing | +5.5 | |||
| Party | Candidate | Votes | % | ± | |
|---|---|---|---|---|---|
| Lib-Lab | Benjamin Pickard | 5,499 | 58.3 | -3.4 | |
| Conservative | Darcy Bruce Wilson | 3,941 | 41.7 | +3.4 | |
| Majority | 1,558 | 16.6 | -6.8 | ||
| Turnout | 9,440 | 72.6 | -3.8 | ||
| Lib-Lab hold | Swing | -3.4 | |||
Elections in the 1900s
| Party | Candidate | Votes | % | ± | |
|---|---|---|---|---|---|
| Lib-Lab | Benjamin Pickard | 5,025 | 58.2 | -0.1 | |
| Conservative | Cecil Edmund Lister-Kaye | 3,606 | 41.8 | +0.1 | |
| Majority | 1,419 | 16.4 | -0.2 | ||
| Turnout | 65.9 | -6.7 | |||
| Lib-Lab hold | Swing | -0.1 | |||

| Party | Candidate | Votes | % | ± | |
|---|---|---|---|---|---|
| Lib-Lab | William Parrott | 6,855 | 70.2 | ||
| Conservative | Marcus Robert Phipps Dorman | 2,909 | 29.8 | ||
| Majority | 3,946 | 40.4 | |||
| Turnout | 65.5 | ||||
| Lib-Lab hold | Swing | ||||
| Party | Candidate | Votes | % | ± | |
|---|---|---|---|---|---|
| Lib-Lab | Frederick Hall | Unopposed | n/a | n/a | |
| Lib-Lab hold | Swing | n/a | |||
| Party | Candidate | Votes | % | ± | |
|---|---|---|---|---|---|
| Lib-Lab | Frederick Hall | Unopposed | n/a | n/a | |
| Lib-Lab hold | Swing | n/a | |||
Elections in the 1910s

| Party | Candidate | Votes | % | ± | |
|---|---|---|---|---|---|
| Labour | Frederick Hall | 9,172 | 72.2 | n/a | |
| Conservative | Ellis Ashmead-Bartlett | 3,540 | 27.8 | n/a | |
| Majority | 5,632 | 44.4 | n/a | ||
| Turnout | 77.2 | n/a | |||
| Labour hold | Swing | n/a | |||
| Party | Candidate | Votes | % | ± | |
|---|---|---|---|---|---|
| Labour | Frederick Hall | Unopposed | n/a | n/a | |
| Labour hold | Swing | n/a | |||
General Election 1914/15:
Another General Election was required to take place before the end of 1915. The political parties had been making preparations for an election to take place and by the July 1914, the following candidates had been selected;
- Lib-Lab: Frederick Hall
- Unionist:
| Party | Candidate | Votes | % | ± | |
|---|---|---|---|---|---|
| Labour | Frederick Hall | Unopposed | n/a | n/a | |
| Labour hold | Swing | n/a | |||
- endorsed by Coalition Government
Elections in the 1920s
| Party | Candidate | Votes | % | ± | |
|---|---|---|---|---|---|
| Labour | Frederick Hall | 16,040 | 73.3 | n/a | |
| National Liberal | Ernest George Bearcroft | 5,855 | 26.7 | n/a | |
| Majority | 10,185 | 46.6 | n/a | ||
| Turnout | 21,895 | 68.3 | n/a | ||
| Labour hold | Swing | n/a | |||
| Party | Candidate | Votes | % | ± | |
|---|---|---|---|---|---|
| Labour | Frederick Hall | 15,455 | 78.0 | +4.7 | |
| Unionist | George Brown Hillman | 4,365 | 22.0 | -4.7 | |
| Majority | 11,090 | 56.0 | +9.4 | ||
| Turnout | 61.5 | -6.8 | |||
| Labour hold | Swing | +4.7 | |||
| Party | Candidate | Votes | % | ± | |
|---|---|---|---|---|---|
| Labour | Frederick Hall | Unopposed | n/a | n/a | |
| Labour hold | Swing | n/a | |||
| Party | Candidate | Votes | % | ± | |
|---|---|---|---|---|---|
| Labour | Frederick Hall | 26,008 | 83.1 | n/a | |
| Unionist | Alfred Coates | 5,276 | 16.9 | n/a | |
| Majority | 20,732 | 66.2 | n/a | ||
| Turnout | 75.8 | n/a | |||
| Labour hold | Swing | n/a | |||
Elections in the 1930s
| Party | Candidate | Votes | % | ± | |
|---|---|---|---|---|---|
| Labour | Frederick Hall | 22,877 | 69.6 | -13.5 | |
| Conservative | John Norman Cumberbirch | 9,974 | 30.4 | +13.5 | |
| Majority | 12,903 | 39.2 | -27.0 | ||
| Turnout | 78.8 | +3.0 | |||
| Labour hold | Swing | -13.5 | |||
| Party | Candidate | Votes | % | ± | |
|---|---|---|---|---|---|
| Labour | Tom Smith | Unopposed | n/a | n/a | |
| Labour hold | Swing | n/a | |||
| Party | Candidate | Votes | % | ± | |
|---|---|---|---|---|---|
| Labour | Tom Smith | 26,705 | 81.4 | n/a | |
| Conservative | Eric Oscar Moss | 6,106 | 18.6 | n/a | |
| Majority | 20,599 | 62.8 | n/a | ||
| Turnout | 77.7 | n/a | |||
| Labour hold | Swing | n/a | |||
General Election 1939/40
Another General Election was required to take place before the end of 1940. The political parties had been making preparations for an election to take place and by the Autumn of 1939, the following candidates had been selected;
Elections in the 1940s
| Party | Candidate | Votes | % | ± | |
|---|---|---|---|---|---|
| Labour | Tom Smith | 28,238 | 84.3 | +2.9 | |
| Conservative | John Harvey Hulbert | 5,259 | 15.7 | -2.9 | |
| Majority | 22,979 | 68.6 | +5.8 | ||
| Turnout | 79.9 | +2.2 | |||
| Labour hold | Swing | +2.9 | |||
| Party | Candidate | Votes | % | ± | |
|---|---|---|---|---|---|
| Labour | George Oscar Sylvester | 19,085 | 79.8 | −4.5 | |
| Conservative | John Enoch Powell | 4,258 | 17.8 | +2.1 | |
| Independent | Walter Dixon Hartley | 579 | 2.4 | n/a | |
| Majority | 14,827 | 62.0 | -6.6 | ||
| Turnout | 23,922 | 54.6 | −25.3 | ||
| Labour hold | Swing | -3.3 | |||
Elections in the 1950s
| Party | Candidate | Votes | % | ± | |
|---|---|---|---|---|---|
| Labour | Thomas Judson Brooks | 31,986 | 74.53 | ||
| Conservative | Thomas Heseltine | 10,929 | 25.47 | ||
| Majority | 21,057 | 49.07 | |||
| Turnout | 87.54 | ||||
| Labour hold | Swing | ||||
| Party | Candidate | Votes | % | ± | |
|---|---|---|---|---|---|
| Labour | Albert Roberts | 31,052 | 73.49 | ||
| Conservative | Thomas Heseltine | 11,199 | 26.51 | ||
| Majority | 19,853 | 46.99 | |||
| Turnout | 85.48 | ||||
| Labour hold | Swing | ||||
| Party | Candidate | Votes | % | ± | |
|---|---|---|---|---|---|
| Labour | Albert Roberts | 27,846 | 73.50 | ||
| Conservative | John Bird | 10,040 | 26.50 | ||
| Majority | 17,806 | 47.00 | |||
| Turnout | 78.09 | ||||
| Labour hold | Swing | ||||
| Party | Candidate | Votes | % | ± | |
|---|---|---|---|---|---|
| Labour | Albert Roberts | 29,672 | 72.65 | ||
| Conservative | James A C Briggs | 11,169 | 27.35 | ||
| Majority | 18,503 | 45.30 | |||
| Turnout | 83.11 | ||||
| Labour hold | Swing | ||||
Elections in the 1960s
| Party | Candidate | Votes | % | ± | |
|---|---|---|---|---|---|
| Labour | Albert Roberts | 28,477 | 72.53 | ||
| Conservative | Francis Kevin Roberts | 10,785 | 27.47 | ||
| Majority | 17,692 | 45.06 | |||
| Turnout | 77.51 | ||||
| Labour hold | Swing | ||||
| Party | Candidate | Votes | % | ± | |
|---|---|---|---|---|---|
| Labour | Albert Roberts | 29,416 | 76.41 | ||
| Conservative | John Edward R Wauchope | 9,084 | 23.59 | ||
| Majority | 20,332 | 52.81 | |||
| Turnout | 74.31 | ||||
| Labour hold | Swing | ||||
Elections in the 1970s
| Party | Candidate | Votes | % | ± | |
|---|---|---|---|---|---|
| Labour | Albert Roberts | 28,421 | 68.40 | ||
| Conservative | David H Cargill | 13,132 | 31.60 | ||
| Majority | 15,289 | 36.79 | |||
| Turnout | 71.55 | ||||
| Labour hold | Swing | ||||
| Party | Candidate | Votes | % | ± | |
|---|---|---|---|---|---|
| Labour | Albert Roberts | 29,621 | 67.22 | ||
| Conservative | Antony Rivers Marlow | 14,447 | 32.78 | ||
| Majority | 15,174 | 34.43 | |||
| Turnout | 75.40 | ||||
| Labour hold | Swing | ||||
| Party | Candidate | Votes | % | ± | |
|---|---|---|---|---|---|
| Labour | Albert Roberts | 24,372 | 58.73 | ||
| Conservative | J Makin | 9,739 | 23.47 | ||
| Liberal | W Whitaker | 7,384 | 17.79 | ||
| Majority | 14,633 | 35.26 | |||
| Turnout | 70.41 | ||||
| Labour hold | Swing | ||||
| Party | Candidate | Votes | % | ± | |
|---|---|---|---|---|---|
| Labour | Albert Roberts | 26,591 | 56.43 | ||
| Conservative | MH Cavendish | 14,398 | 30.55 | ||
| Liberal | ARC Paton | 6,134 | 13.02 | ||
| Majority | 12,193 | 25.87 | |||
| Turnout | 76.76 | ||||
| Labour hold | Swing | ||||
Elections in the 1980s
| Party | Candidate | Votes | % | ± | |
|---|---|---|---|---|---|
| Labour | William O'Brien | 18,782 | 43.56 | ||
| Conservative | A Paul | 14,599 | 33.86 | ||
| Social Democratic | P Pantelli | 9,741 | 22.59 | ||
| Majority | 4,183 | 9.70 | |||
| Turnout | 70.40 | ||||
| Labour hold | Swing | ||||
| Party | Candidate | Votes | % | ± | |
|---|---|---|---|---|---|
| Labour | William O'Brien | 23,303 | 49.54 | ||
| Conservative | MDM Smith | 16,016 | 34.05 | ||
| Social Democratic | RJ Macey | 7,717 | 16.41 | ||
| Majority | 7,287 | 15.49 | |||
| Turnout | 74.78 | ||||
| Labour hold | Swing | ||||
Elections in the 1990s
| Party | Candidate | Votes | % | ± | |
|---|---|---|---|---|---|
| Labour | William O'Brien | 25,936 | 51.8 | +2.3 | |
| Conservative | RW Sturdy | 16,986 | 33.9 | -0.1 | |
| Liberal Democrat | M Galdas | 7,137 | 14.3 | -2.1 | |
| Majority | 8,950 | 17.9 | +2.4 | ||
| Turnout | 50,059 | 76.3 | +1.5 | ||
| Labour hold | Swing | +1.2 | |||
| Party | Candidate | Votes | % | ± | |
|---|---|---|---|---|---|
| Labour | William O'Brien | 26,046 | 60.57 | ||
| Conservative | Fiona Bulmer | 10,153 | 23.61 | ||
| Liberal Democrat | David Ridgway | 5,347 | 12.43 | ||
| Referendum | Ken Shuttleworth | 1,458 | 3.39 | ||
| Majority | 15,893 | 36.96 | |||
| Turnout | 68.28 | ||||
| Labour hold | Swing | ||||
Elections in the 2000s
| Party | Candidate | Votes | % | ± | |
|---|---|---|---|---|---|
| Labour | William O'Brien | 19,152 | 56.1 | −4.5 | |
| Conservative | Graham Smith | 9,215 | 27.0 | +3.4 | |
| Liberal Democrat | Stephen Pearson | 4,990 | 14.6 | +2.2 | |
| Socialist Labour | Mick Appleyard | 798 | 2.3 | N/A | |
| Majority | 9,937 | 29.1 | |||
| Turnout | 34,155 | 52.2 | −16.0 | ||
| Labour hold | Swing | ||||

| Party | Candidate | Votes | % | ± | |
|---|---|---|---|---|---|
| Labour Co-op | Edward Michael Balls | 19,161 | 51.2 | −4.9 | |
| Conservative | Andrew Theakstone Percy | 9,159 | 24.5 | −2.5 | |
| Liberal Democrat | Simone Butterworth | 6,357 | 17.0 | +2.4 | |
| BNP | John Aveyard | 1,967 | 5.3 | N/A | |
| Independent | Mark Harrop | 780 | 2.1 | N/A | |
| Majority | 10,002 | 26.7 | |||
| Turnout | 37,424 | 57.5 | +5.3 | ||
| Labour Co-op hold | Swing | ||||
See also
Notes and references
- ↑ Leigh Rayment's Historical List of MPs – Constituencies beginning with "N" (part 2)
- 1 2 3 4 5 6 7 8 British Parliamentary Election Results 1885–1918, FWS Craig
- 1 2 3 4 5 6 The Liberal Year Book, 1907
- ↑ Debrett's House of Commons & Judicial Bench, 1886
- ↑ Debrett's House of Commons & Judicial Bench, 1901
- ↑ Debrett's House of Commons & Judicial Bench, 1901
- ↑ Debrett's House of Commons & Judicial Bench, 1916
- ↑ Debrett's House of Commons & Judicial Bench, 1916
- 1 2 3 4 5 6 7 8 British Parliamentary Election Results 1918–1949, FWS Craig
- ↑ The Liberal Year Book, 1931
- ↑ Report of the Annual Conference of the Labour Party, 1939
- ↑ Yorkshire Post and Leeds Intelligencer 22 March 1939
- 1 2 3 4 5 6 7 British Parliamentary Election Results 1950–1973, FWS Craig
- 1 2 3 4 5 6 7 The Times House of Commons, 1950–70
- 1 2 3 British Parliamentary Election Results, 1974–1983, FWS Craig
- ↑ "Politics Resources". Election 1992. Politics Resources. 9 April 1992. Retrieved 6 December 2010.
Sources
- The Independent Labour Party and the Yorkshire Miners: The Barnsley By-Election of 1897: details on the Liberal-Labour movement in the area in the late 19th century