Niland, California
| Niland | |
|---|---|
| Census designated place | |
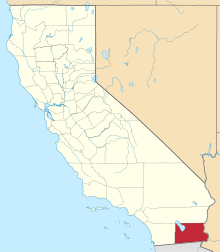
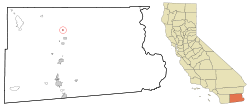 Location in Imperial County and the state of California | |
 Niland Location in the United States | |
| Coordinates: 33°14′24″N 115°31′08″W / 33.24000°N 115.51889°WCoordinates: 33°14′24″N 115°31′08″W / 33.24000°N 115.51889°W | |
| Country |
|
| State |
|
| County | Imperial |
| Area[1] | |
| • Total | 0.402 sq mi (1.040 km2) |
| • Land | 0.402 sq mi (1.040 km2) |
| • Water | 0 sq mi (0 km2) 0% |
| Elevation[2] | -141 ft (-43 m) |
| Population (April 1, 2010) | |
| • Total | 1,006 |
| • Density | 2,500/sq mi (970/km2) |
| Time zone | Pacific (UTC-8) |
| • Summer (DST) | PDT (UTC-7) |
| ZIP code | 92257 |
| Area codes | 442/760 |
| FIPS code | 06-51392 |
| GNIS feature IDs | 1652758, 2408926 |
Niland (formerly Imperial Junction,[2] Old Beach,[2] and Hobgood[3]) is a census-designated place (CDP) in Imperial County, California. The town is located 8 miles (13 km) north of Calipatria,[3] 2 miles (3.2 km) southeast of the Salton Sea. The population was 1,006 at the 2010 census, down from 1,143 in 2000. It is part of the 'El Centro, California Metropolitan Statistical Area'.
History
The Old Beach post office operated from 1905 to 1907.[3] The Imperial Junction post office opened in 1910, changed its name to Hobgood in 1913, and to Niland in 1914.[3] The name Hobgood honors pioneer Richard H. Hobgood.[3] The name Niland was coined by the Imperial Farm Lands Association from "Nile Land" a commendatory name for the supposed fertility of the place.[3]
Demographics
2010
The 2010 United States Census[4] reported that Niland had a population of 1,006. The population density was 2,504.8 people per square mile (967.1/km²). The racial makeup of Niland was 539 (53.6%) White, 36 (3.6%) African American, 20 (2.0%) Native American, 36 (3.6%) Asian, 0 (0.0%) Pacific Islander, 315 (31.3%) from other races, and 60 (6.0%) from two or more races. Hispanic or Latino of any race were 618 persons (61.4%).
The Census reported that 1,006 people (100% of the population) lived in households, 0 (0%) lived in non-institutionalized group quarters, and 0 (0%) were institutionalized.
There were 367 households, out of which 131 (35.7%) had children under the age of 18 living in them, 143 (39.0%) were opposite-sex married couples living together, 83 (22.6%) had a female householder with no husband present, 30 (8.2%) had a male householder with no wife present. There were 25 (6.8%) unmarried opposite-sex partnerships, and 5 (1.4%) same-sex married couples or partnerships. 99 households (27.0%) were made up of individuals and 49 (13.4%) had someone living alone who was 65 years of age or older. The average household size was 2.74. There were 256 families (69.8% of all households); the average family size was 3.27.
The population dispersal was 248 people (24.7%) under the age of 18, 99 people (9.8%) aged 18 to 24, 215 people (21.4%) aged 25 to 44, 284 people (28.2%) aged 45 to 64, and 160 people (15.9%) who were 65 years of age or older. The median age was 39.6 years. For every 100 females there were 96.9 males. For every 100 females age 18 and over, there were 94.4 males.
There were 489 housing units at an average density of 1,217.5 per square mile (470.1/km²), of which 189 (51.5%) were owner-occupied, and 178 (48.5%) were occupied by renters. The homeowner vacancy rate was 7.4%; the rental vacancy rate was 23.3%. 497 people (49.4% of the population) lived in owner-occupied housing units and 509 people (50.6%) lived in rental housing units.
2000
As of the census[5] of 2000, there were 1,143 people, 422 households, and 281 families residing in the CDP. The population density was 2,813.3 people per square mile (1,076.4/km²). There were 530 housing units at an average density of 1,304.5 per square mile (499.1/km²). The racial makeup of the CDP was 54.8% White, 3.2% Black or African American, 2.0% Native American, 4.6% Asian, 28.1% from other races, and 7.4% from two or more races. 55.3% of the population were Hispanic or Latino of any race.
There were 422 households out of which 33.6% had children under the age of 18 living with them, 39.3% were married couples living together, 18.2% had a female householder with no husband present, and 33.4% were non-families. 29.1% of all households were made up of individuals and 14.7% had someone living alone who was 65 years of age or older. The average household size was 2.7 and the average family size was 3.3.
In the CDP the population was spread out with 30.0% under the age of 18, 8.0% from 18 to 24, 24.0% from 25 to 44, 22.4% from 45 to 64, and 15.6% who were 65 years of age or older. The median age was 36 years. For every 100 females there were 100.2 males. For every 100 females age 18 and over, there were 105.7 males.
The median income for a household in the CDP was $25,592, and the median income for a family was $27,500. Males had a median income of $36,786 versus $26,250 for females. The per capita income for the CDP was $11,297. About 15.1% of families and 21.4% of the population were below the poverty line, including 19.8% of those under age 18 and 12.4% of those age 65 or over.
Politics
In the state legislature, Niland is in the 40th Senate District, represented by Democrat Ben Hueso,[6] and the 56th Assembly District, represented by Democrat Eduardo Garcia.[7]
Federally, Niland is in California's 51st congressional district, represented by Democrat Juan Vargas.[8]
Climate
This area has a large amount of sunshine year round due to its stable descending air and high pressure. According to the Köppen Climate Classification system, Niland has a hot desert climate, abbreviated "BWh" on climate maps.[9]
See also
- El Centro Metropolitan Area
- San Diego–Imperial, California
- Slab City, a camp near Niland in the Colorado Desert in southeastern California, used by recreational vehicle owners and squatters from across North America
References
- ↑ "2010 Census U.S. Gazetteer Files – Places – California". United States Census Bureau.
- 1 2 3 "Niland". Geographic Names Information System. United States Geological Survey.
- 1 2 3 4 5 6 Durham, David L. (1998). California's Geographic Names: A Gazetteer of Historic and Modern Names of the State. Clovis, Calif.: Word Dancer Press. p. 1449. ISBN 1-884995-14-4.
- ↑ "2010 Census Interactive Population Search: CA - Niland CDP". U.S. Census Bureau. Retrieved July 12, 2014.
- ↑ "American FactFinder". United States Census Bureau. Archived from the original on September 11, 2013. Retrieved 2008-01-31.
- ↑ "Senators". State of California. Retrieved April 11, 2013.
- ↑ "Members Assembly". State of California. Retrieved April 11, 2013.
- ↑ "California's 51st Congressional District - Representatives & District Map". Civic Impulse, LLC. Retrieved April 11, 2013.
- ↑ Climate Summary for Niland, California