Network theory in risk assessment
A network is an abstract structure capturing only the basics of connection patterns and little else. Because it is a generalized pattern, tools developed for analyzing, modeling and understanding networks can theoretically be implemented across disciplines. As long as a system can be represented by a network, there is an extensive set of tools – mathematical, computational, and statistical – that are well-developed and if understood can be applied to the analysis of the system of interest.
Tools that are currently employed in risk assessment are often sufficient, but model complexity and limitations of computational power can tether risk assessors to involve more causal connections and account for more Black Swan event outcomes. By applying network theory tools to risk assessment, computational limitations may be overcome and result in broader coverage of events with a narrowed range of uncertainties.[1]
Decision-making processes are not incorporated into routine risk assessments; however, they play a critical role in such processes.[2] It is therefore very important for risk assessors to minimize confirmation bias by carrying out their analysis and publishing their results with minimal involvement of external factors such as politics, media, and advocates. In reality, however, it is nearly impossible to break the iron triangle among politicians, scientists (in this case, risk assessors), and advocates and media.[3] Risk assessors need to be sensitive to the difference between risk studies and risk perceptions.[4][5] One way to bring the two closer is to provide decision-makers with data they can easily rely on and understand. Employing networks in the risk analysis process can visualize causal relationships and identify heavily-weighted or important contributors to the probability of the critical event.[6]
A "bow-tie" diagram, cause-and-effect diagram, Bayesian network (a directed acyclic network) and fault trees are few examples of how network theories can be applied in risk assessment.[7]
In epidemiology risk assessments (Figure 7 and 9), once a network model was constructed, we can visually see then quantify and evaluate the potential exposure or infection risk of people related to the well-connected patients (Patient 1, 6, 35, 130 and 127 in Figure 7) or high-traffic places (Hotel M in Figure 9). In ecological risk assessments (Figure 8), through a network model we can identify the keystone species and determine how widespread the impacts will extend from the potential hazards being investigated.
Risk assessment key components

Risk assessment is a method for dealing with uncertainty. For it to be beneficial to the overall risk management and decision making process, it must be able to capture extreme and catastrophic events. Risk assessment involves two parts: risk analysis and risk evaluation, although the term “risk assessment” can be seen used indistinguishable with “risk analysis”. In general, risk assessment can be divided into these steps:[8]
- Plan and prepare the risk analysis.
- Define and delimit the system and the scope of the analysis.
- Identify hazards and potential hazardous events.
- Determine causes and frequency of each hazardous event.
- Identify accident scenarios (i.e. even sequences) that may be initiated by each hazardous event.
- Select relevant and typical accident scenarios.
 Figure 3: Bow-tie diagram of risk management
 - Determine the consequences of each accident scenario.
- Determine the frequency of each accident scenario.
- Assess the uncertainty.
- Establish and describe the risk picture.
- Report the analysis.
- Evaluate the risk against risk acceptance criteria
- Suggest and evaluate potential risk-reducing measures.
Naturally, the number of steps required varies with each assessment. It depends on the scope of the analysis and the complexity of the study object.[9] Because these is always varies degrees of uncertainty involved in any risk analysis process, sensitivity and uncertainty analysis are usually carried out to mitigate the level of uncertainty and therefore improve the overall risk assessment result.
Network theory key components
A network is a simplified representation that reduces a system to an abstract structure. Simply put, it is a collection of points linked together by lines. Each point is known as a “vertex” (multiple: “vertices”) or “nodes”, and each line as “edges” or “links”.[10] Network modeling and studying have already been applied in many areas, including computer, physical, biological, ecological, logistical and social science. Through the studying of these models, we gain insights into the nature of individual components (i.e. vertices), connections or interactions between those components (i.e. edges), as well as the pattern of connections (i.e. network).
Undoubtedly, modifications of the structure (or pattern) of any given network can have a big effect on the behavior of the system it depicts. For example, connections in a social network affect how people communicate, exchange news, travel, and, less obviously, spread diseases. In order to gain better understanding of how each of these systems functions, some knowledge of the structure of the network is necessary.
Basic terminology
Small-World Effect
- The small-world effect is one of the most remarkable network phenomena. It describes a finding that in many (perhaps most) networks the mean path distances between vertices are surprisingly small.[11] It has many implications in various areas of network studies. For instance, in social network, one can ruminate how fast a rumor (or a contagious disease) is spread in a community. From a mathematical point of view, since path lengths in networks are typically scale as log n (where n = number of network vertices), it is only logical it remains a small number even with large complex networks.
- Another idea comes along with the small-world effect is called funneling.[12] It was derived from a social network experiment conducted by the experimental psychologist Stanley Milgram in the 1960s. In that experiment he concluded, along with the small-world effect phenomenon, that in any given social network, there were always few that were especially well connected. These few individuals were therefore responsible for the connection between any members and the rest of the world.
Degree, Hubs, and Paths

- Degree of a vertex is the number of edges connected to it. For example, on Figure 4, vertex 3 has a degree of five. Hubs are vertices in a network with a relatively higher degree. Vertex 3 again is a good example. In a social network, hubs can mean individuals with many acquaintances. In risk assessment, it can mean a hazardous event with multiple triggers (or the causal part of a bow-tie diagram). A path in a network is a route between a vertex and another across the network. From the same figure, an example of a path from vertex 1 to 6 can be 1→5→3→6.
Centrality
- Centrality is a measure of how important (or central) certain vertices are in a network. It can be measured by counting the number of edges connected to it (i.e its degree). The vertices with the highest degree therefore have a high degree centrality.
- Degree centrality can have many implications. In a social network, a person with high degree centrality may have more influence over others, more access to information, or more opportunities than those with fewer connections. In a citation network, a paper with high degree centrality may suggest it is more influential and thus has a greater impact on its respective area of research.[13]
- Eigenvector centrality is an extension of the concept of degree centrality, based on the fact that in many networks not all vertices have the same weight or importance. A vertex's importance in its network increases if it has more connections to important vertices. Eigenvector centrality, therefore, can be view as a centrality scoring system for not just one but its neighboring vertices as well.
Components
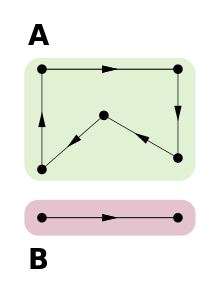
- Subgroups, or subsets of vertices, in a disconnected network. Disconnected network means in such network, there is at least a pair of vertices that no path connecting between them at all. Vice verse is known as a connected network, where all vertices within are connected by at least one path. One can therefore say a connected network has only one component.
Directed Networks

- Networks of which each edge has a direction from one vertex to another. The edges are therefore known as directed edges. Example of such network include a link from the reference section on this page which will leads you to another, but not the other way around. In terms of food web, a prey eaten by a predator is another example.
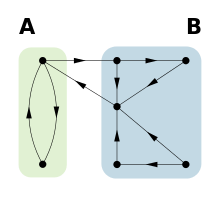
- Directed networks can be cyclic or acyclic. A cyclic directed network is one with a closed loop of edges. An acyclic directed network does not contain such loop. Since a self-edge – an edge connecting a vertex to itself – is considered a cycle, it is therefore absent from any acyclic network.
- A Bayesian network is an example of an acyclic directed network.
Weighted Network
- In reality, not all edges shares the same importance or weight (connections in a social network and keystone species in a food web, for example). A weighted network adds such element to its connections. It is widely used in genomic and systems biologic applications.
Trees
- Undirected networks with no closed loops. A tree can be part of a network but isolated as a separate component. If all parts of a network are trees, such network is called a forest. An administrative body can sometime be viewed as a forest.
Other Examples of Network Theory Application
Social network
Early social network studies can be traced back to the end of the nineteenth century. However well-documented studies and foundation of this field are usually attributed to a psychiatrist named Jacob Moreno. He published a book entitled Who Whall Survive? in 1934 which laid out the foundation for sociometry (later known as social network analysis).
Another famous contributor to the early development of social network analysis is a perimental psychologist known as Stanley Milgram. His "small-world" experiments gave rise to concepts such as six degrees of separation and well-connected acquaintances (also known as "sociometric superstars"). This experiment was recently repeated by Dodds et al. by means of email messages, and the basic results were similar to Milgram's. The estimated true average path length (that is, the number of edges the email message has to pass from one unique individual to the intended targets in different countries) for the experiment was around five to seven, which is not much deviated from the original six degree of separation.[14]
Food web

A food web, or food chain, is an example of directed network which describes the prey-predator relationship in a given ecosystem. Vertices in this type of network represent species, and the edges the prey-predator relationship. A collection of species may be represented by a single vertex if all members in that collection prey upon and are preyed on by the same organisms. A food web is often acyclic, with few exceptions such as adults preys on juveniles and parasitism.[15]
- Note: In the food web main article, a food web was depicted as cyclic. That is based on the flow of the carbon and energy sources in a given ecosystem. The food web described here based solely on prey-predator roles; Organisms active in the carbon and nitrogen cycles (such as decomposers and fixers) are not considered in this description.
Epidemiology
Epidemiology is closely related to social network. Contagious diseases can spread through connection networks such as work space, transportation, intimate body contacts and water system (see Figure 7 and 9). Though it only exists virtually, a computer viruses spread across internet networks are not much different from their physical counterparts. Therefore, understanding each of these network patterns can no doubt aid us in more precise prediction of the outcomes of epidemics and preparing better disease prevention protocols.
The simplest model of infection is presented as a SI (susceptible - infected) model. Most diseases, however, do not behave in such simple manner. Therefore many modifications to this model were made such as the SIR (susceptible – infected – recovered), the SIS (the second S denotes reinfection) and SIRS models. The idea of latency is taken into accounts in models such as SEIR (where E stands for exposed). The SIR model is also known as the Reed-Frost model.[16]
To factor these into an outbreak network model, one must consider the degree distributions of vertices in the giant component of the network (outbreaks in small components are isolation and die out quickly, which does not allow the outbreaks to become epidemics). Theoretically, weighted network can provide more accurate information on exposure probability of vertices but more proofs are needed. Pastor-Satorras et al. pioneered much work in this area, which began with the simplest form (the SI model) and applied to networks drawn from the configuration model.[17]
The biology of how an infection causes disease in an individual is complicated and is another type of disease pattern specialists are interested in (a process known as pathogenesis which involves immunology of the host and virulence factors of the pathogen).
Notes
- ↑ Newman, Mark E. J. Networks: an Introduction. Oxford: Oxford UP, 2010. p.2
- ↑ National Research Council (NRC). Red Book Paradigm. Risk Assessment in the Federal Government: Understanding the Process. Washington D.C.: National Academy Press, 1983.
- ↑ Pielke Jr., Roger A. Policy, Politics and Perspective. Nature 416 (2002): 367-68.
- ↑ Slovic, Paul. Perception of Risk. Science 236 (1987): 280-85.
- ↑ National Research Council (NRC). Orange Book Paradigm. Understanding Risk: Informing Decisions in a Democratic Society. Washington D.C.: National Academy Press, 1996.
- ↑ Rausand, Marvin. Risk Assessment: Theory, Methods, and Applications. Hoboken, NJ: John Wiley & Sons, 2011. p.295.
- ↑ Rausand, Marvin. Risk Assessment: Theory, Methods, and Applications. Hoboken, NJ: John Wiley & Sons, 2011. p.266-302.
- ↑ Rausand, Marvin. "Chapter 5 Risk Management." Risk Assessment: Theory, Methods, and Applications. Hoboken, NJ: John Wiley & Sons, 2011. p.117-36.
- ↑ Rausand, Marvin. Risk Assessment: Theory, Methods, and Applications. Hoboken, NJ: John Wiley & Sons, 2011. p.124.
- ↑ Newman, Mark E. J. Networks: an Introduction. Oxford: Oxford UP, 2010. p.1
- ↑ Newman, Mark E. J. Networks: an Introduction. Oxford: Oxford UP, 2010. p.241
- ↑ Newman, Mark E. J. Networks: an Introduction. Oxford: Oxford UP, 2010. p.243
- ↑ Newman, Mark E. J. Networks: an Introduction. Oxford: Oxford UP, 2010. p.168
- ↑ Newman, Mark E. J. Networks: an Introduction. Oxford: Oxford UP, 2010. p.54-58
- ↑ Newman, Mark E. J. “Chapter 5.3 Ecological Networks”. Networks: an Introduction. Oxford: Oxford UP, 2010. p.99-104
- ↑ http://www.stat.columbia.edu/~regina/research/risk.pdf
- ↑ Newman, Mark E. J. Networks: an Introduction. Oxford: Oxford UP, 2010. p.657-664
References
- Dolgoarshinnykh, Regina. "Criticality in Epidemic Models". Columbia University, New York. Criticality in Epidemic Models
- Legrain, Amaury, and Tom Auwers. The Principal-agent Model and the Network Theory as Framework for Administrative Procedures: Social Security in Belgium. EGPA Conference "Public Manager under Pressure: between Politics, Professionalism and Civil Society" (2006): 1-40
- Martinez, Neo, and Dunne, Jennifer. "Foodwebs.org". Pacific Ecoinformatics and Computational Ecology Lab., 2011. foodwebs.org
- Meyers, Lauren A., M.E.J. Newman, and Stephanie Schrag. Applying Network Theory to Epidemics: Control Measures for Mycoplasma Pneumoniae Outbreaks. Emerging Infectious Diseases 9.2 (2003): 204-10
- National Research Council (NRC). Risk Assessment in the Federal Government: Understanding the Process. Washington D.C.: National Academy Press, 1983.
- National Research Council (NRC). Understanding Risk: Informing Decisions in a Democratic Society. Washington D.C.: National Academy Press, 1996.
- Newman, Mark E. J. Networks: an Introduction. Oxford: Oxford UP, 2010, ISBN 978-0199206650 .
- Pielke Jr., Roger A. Policy, Politics and Perspective. Nature 416 (2002): 367-68.
- Rausand, Marvin. Risk Assessment: Theory, Methods, and Applications. Hoboken, NJ: John Wiley & Sons, 2011.
- Rothman, Kenneth J., Sander Greenland, and Timothy L. Lash. Modern Epidemiology. 3rd ed. Philadelphia: Wolters Kluwer Health/Lippincott Williams & Wilkins, 2008.
- Rowland, Todd and Weisstein, Eric W. "Causal Network." From MathWorld—A Wolfram Web Resource. Causal Network
- Slovic, Paul. Perception of Risk. Science 236 (1987): 280-85.
- Taleb, Nassim N. Errors, Robustness, and the Fourth Quadrant. International Journal of Forecasting 25.4 (2009): 744-59
- Wolfram, Stephen. A New Kind of Science. Champaign, IL: Wolfram Media, 2002.