Morton County, North Dakota
| Morton County, North Dakota | |
|---|---|
 Morton County Courthouse in Mandan | |
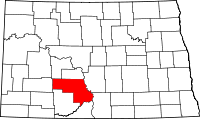 Location in the U.S. state of North Dakota | |
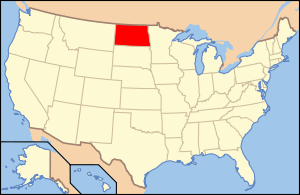 North Dakota's location in the U.S. | |
| Founded | March 27, 1896 |
| Seat | Mandan |
| Largest city | Mandan |
| Area | |
| • Total | 1,945 sq mi (5,038 km2) |
| • Land | 1,926 sq mi (4,988 km2) |
| • Water | 19 sq mi (49 km2), 1.0% |
| Population (est.) | |
| • (2019) | 30,310 |
| • Density | 14/sq mi (5/km²) |
| Congressional district | At-large |
| Website |
www |
Morton County is a county located in the U.S. state of North Dakota. As of the 2010 census, the population was 27,471,[1] making it the seventh-most populous county in North Dakota. Its county seat is Mandan.[2] The county was originally created in 1873 and later organized in 1878.[3][4]
Morton County is included in the Bismarck, ND, Metropolitan Statistical Area.
History
The county was created by the 1872-1873 territorial legislature and named for Oliver Hazard Perry Throck Morton (1823-1877), governor of Indiana during the American Civil War and later a United States Senator. It was organized on March 23, 1878, but the action of the 1878 legislature in attaching the eastern portion to Burleigh County effectively nullified this action. The county was reorganized on February 18, 1881, after the detached portion had been returned to Morton County by the 1881 legislature. Mandan has always been the county seat, though during a period from 1878 to 1879, Mandan, and thus also the county seat, was known as Lincoln.[4][5]
On November 23, 1916, 1,666 square miles of southern and southwestern Morton County was detached to form Grant County.[6][7]
After the Dakota Access Pipeline (DAPL) was rerouted to cross Morton County,[8] the county became a focus of DAPL protests. Amnesty International wrote a letter to Sheriff Kyle Kirchmeier on September 28, 2016, requesting that he investigate the use of force by private contractors, remove blockades and discontinue the use of riot gear by Morton County sheriff's deputies when policing protests in order to facilitate the right to peaceful protests in accordance with international law and standards. [9] This letter was written in response to private security guards unleashing attack dogs on protesters on September 3, along with using mace.[10] On November 20, North Dakota police officers fired rubber bullets, tear gas, concussion grenades and water cannons at protesters in subzero temperatures.[11]
Geography
According to the U.S. Census Bureau, the county has a total area of 1,945 square miles (5,040 km2), of which 1,926 square miles (4,990 km2) is land and 19 square miles (49 km2) (1.0%) is water.[12]
Major highways
 Interstate 94
 North Dakota Highway 6
 North Dakota Highway 21
 North Dakota Highway 25
 North Dakota Highway 31
 North Dakota Highway 49
 North Dakota Highway 1806
Adjacent counties
- Oliver County (north)
- Burleigh County (northeast)
- Emmons County (east)
- Sioux County (southeast)
- Grant County (south)
- Stark County (west)
- Mercer County (northwest)
National protected area
Demographics
| Historical population | |||
|---|---|---|---|
| Census | Pop. | %± | |
| 1880 | 200 | — | |
| 1890 | 4,728 | 2,264.0% | |
| 1900 | 8,069 | 70.7% | |
| 1910 | 25,289 | 213.4% | |
| 1920 | 18,714 | −26.0% | |
| 1930 | 19,647 | 5.0% | |
| 1940 | 20,184 | 2.7% | |
| 1950 | 19,295 | −4.4% | |
| 1960 | 20,992 | 8.8% | |
| 1970 | 20,310 | −3.2% | |
| 1980 | 25,177 | 24.0% | |
| 1990 | 23,700 | −5.9% | |
| 2000 | 25,303 | 6.8% | |
| 2010 | 27,471 | 8.6% | |
| Est. 2015 | 30,310 | [13] | 10.3% |
| U.S. Decennial Census[14] 1790-1960[15] 1900-1990[16] 1990-2000[17] 2010-2015[1] | |||
2000 census
As of the census of 2000, there were 25,303 people, 9,889 households, and 6,932 families residing in the county. The population density was 13 people per square mile (5/km²). There were 10,587 housing units at an average density of 6 per square mile (2/km²). The racial makeup of the county was 95.82% White, 0.16% Black or African American, 2.39% Native American, 0.30% Asian, 0.01% Pacific Islander, 0.16% from other races, and 1.16% from two or more races. 0.65% of the population were Hispanic or Latino of any race. 64.5% were of German and 10.6% Norwegian ancestry.
There were 9,889 households out of which 34.90% had children under the age of 18 living with them, 58.20% were married couples living together, 8.50% had a female householder with no husband present, and 29.90% were non-families. 25.70% of all households were made up of individuals and 10.90% had someone living alone who was 65 years of age or older. The average household size was 2.51 and the average family size was 3.03.
In the county the population was spread out with 27.00% under the age of 18, 7.80% from 18 to 24, 28.20% from 25 to 44, 22.40% from 45 to 64, and 14.60% who were 65 years of age or older. The median age was 37 years. For every 100 females there were 99.30 males. For every 100 females age 18 and over, there were 96.30 males.
The median income for a household in the county was $37,028, and the median income for a family was $44,592. Males had a median income of $30,698 versus $21,301 for females. The per capita income for the county was $17,202. About 6.80% of families and 9.60% of the population were below the poverty line, including 11.00% of those under age 18 and 14.30% of those age 65 or over.
2010 census
As of the 2010 United States Census, there were 27,471 people, 11,289 households, and 7,523 families residing in the county.[18] The population density was 14.3 inhabitants per square mile (5.5/km2). There were 12,079 housing units at an average density of 6.3 per square mile (2.4/km2).[19] The racial makeup of the county was 93.6% white, 3.6% American Indian, 0.4% black or African American, 0.2% Asian, 0.1% Pacific islander, 0.4% from other races, and 1.6% from two or more races. Those of Hispanic or Latino origin made up 1.5% of the population.[18] In terms of ancestry,[20]
Of the 11,289 households, 30.9% had children under the age of 18 living with them, 53.1% were married couples living together, 9.3% had a female householder with no husband present, 33.4% were non-families, and 27.7% of all households were made up of individuals. The average household size was 2.38 and the average family size was 2.90. The median age was 39.3 years.[18]
The median income for a household in the county was $50,591 and the median income for a family was $62,713. Males had a median income of $42,044 versus $31,505 for females. The per capita income for the county was $25,303. About 5.4% of families and 8.2% of the population were below the poverty line, including 10.8% of those under age 18 and 9.6% of those age 65 or over.[21]
Communities
Cities
Township
Census-designated place
Unincorporated communities
See also
References
- 1 2 "State & County QuickFacts". United States Census Bureau. Retrieved November 1, 2013.
- ↑ "Find a County". National Association of Counties. Retrieved 2011-06-07.
- ↑ "Dakota Territory, South Dakota, and North Dakota: Individual County Chronologies". Dakota Territory Atlas of Historical County Boundaries. The Newberry Library. 2006. Retrieved February 3, 2015.
- 1 2 "County History". Official Portal for North Dakota State Government. Retrieved 4 May 2011.
- ↑ Wick, Douglas A. "Mandan (Morton County)". North Dakota Place Names. Retrieved 6 May 2011.
- ↑ Long, John H. (2006). "Dakota Territory, South Dakota, and North Dakota: Individual County Chronologies". Dakota Territory Atlas of Historical County Boundaries. The Newberry Library. Retrieved 2008-01-31.
- ↑ Certification of the division of Morton County, ND 28 November 1916
- ↑ Dalrymple, Amy (18 August 2016). "Pipeline route plan first called for crossing north of Bismarck". The Bismark Tribune. Archived from the original on 1 Nov 2016. Retrieved 23 September 2016.
- ↑ http://indiancountrytodaymedianetwork.com/2016/10/03/amnesty-international-morton-county-sheriff-investigate-use-force-against-protectors-dapl
- ↑ http://www.democracynow.org/2016/9/4/dakota_access_pipeline_company_attacks_native
- ↑ "400 DAPL protesters 'trapped on bridge' as police fire tear gas, water cannon (VIDEO)". RT International. Retrieved 2016-11-27.
- ↑ "2010 Census Gazetteer Files". United States Census Bureau. August 22, 2012. Retrieved February 1, 2015.
- ↑ "County Totals Dataset: Population, Population Change and Estimated Components of Population Change: April 1, 2010 to July 1, 2015". Retrieved July 2, 2016.
- ↑ "U.S. Decennial Census". United States Census Bureau. Retrieved February 1, 2015.
- ↑ "Historical Census Browser". University of Virginia Library. Retrieved February 1, 2015.
- ↑ Forstall, Richard L., ed. (April 20, 1995). "Population of Counties by Decennial Census: 1900 to 1990". United States Census Bureau. Retrieved February 1, 2015.
- ↑ "Census 2000 PHC-T-4. Ranking Tables for Counties: 1990 and 2000" (PDF). United States Census Bureau. April 2, 2001. Retrieved February 1, 2015.
- 1 2 3 "DP-1 Profile of General Population and Housing Characteristics: 2010 Demographic Profile Data". United States Census Bureau. Retrieved 2016-03-14.
- ↑ "Population, Housing Units, Area, and Density: 2010 - County". United States Census Bureau. Retrieved 2016-03-14.
- ↑ "DP02 SELECTED SOCIAL CHARACTERISTICS IN THE UNITED STATES – 2006-2010 American Community Survey 5-Year Estimates". United States Census Bureau. Retrieved 2016-03-14.
- ↑ "DP03 SELECTED ECONOMIC CHARACTERISTICS – 2006-2010 American Community Survey 5-Year Estimates". United States Census Bureau. Retrieved 2016-03-14.
External links
Coordinates: 46°43′N 101°17′W / 46.72°N 101.28°W
 |
Mercer County | Oliver County | Burleigh County | |
| Stark County | |
Emmons County | ||
| ||||
| | ||||
| Grant County | Sioux County |
Municipalities and communities of Morton County, North Dakota, United States | ||
|---|---|---|
| Cities | | |
| Township | ||
| CDP | ||
| Unorganized territories |
| |
| Unincorporated communities |
| |
| Counties | 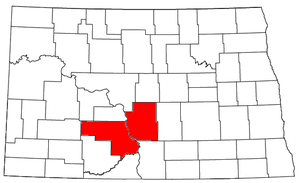 | |
|---|---|---|
| Core cities | ||
| Surrounding areas |
| |