Morphometrics

Morphometrics (from Greek μορϕή morphe, "shape, form", and -μετρία metria, "measurement") or morphometry [5] refers to the quantitative analysis of form, a concept that encompasses size and shape. Morphometric analyses are commonly performed on organisms, and are useful in analyzing their fossil record, the impact of mutations on shape, developmental changes in form, covariances between ecological factors and shape, as well for estimating quantitative-genetic parameters of shape. Morphometrics can be used to quantify a trait of evolutionary significance, and by detecting changes in the shape, deduce something of their ontogeny, function or evolutionary relationships. A major objective of morphometrics is to statistically test hypotheses about the factors that affect shape.
"Morphometrics", in the broader sense, is also used to precisely locate certain areas of organs such as the brain, and in describing the shapes of other things.
Forms of morphometrics

Three general approaches to form are usually distinguished: traditional morphometrics, landmark-based morphometrics and outline-based morphometrics.
"Traditional" morphometrics
Traditional morphometrics analyzes lengths, widths, masses, angles, ratios and areas.[6] In general, traditional morphometric data are measurements of size. A drawback of using many measurements of size is that most will be highly correlated; as a result, there are few independent variables despite the many measurements. For instance, tibia length will vary with femur length and also with humerus and ulna length and even with measurements of the head. Traditional morphometric data are nonetheless useful when either absolute or relative sizes are of particular interest, such as in studies of growth. These data are also useful when size measurements are of theoretical importance such as body mass and limb cross-sectional area and length in studies of functional morphology. However, these measurements have one important limitation: they contain little information about the spatial distribution of shape changes across the organism. They are also useful when determining the extent to which certain pollutants have affected an individual. these indices include the hepatosomatic index, gonadosomatic index and also the condition factors (shakumbila, 2014).
Landmark-based geometric morphometrics
In landmark-based geometric morphometrics, the spatial information missing from traditional morphometrics is contained in the data, because the data are coordinates of landmarks: discrete anatomical loci that are arguably homologous in all individuals in the analysis (i.e. they can be regarded as the "same" point in each specimens in the study). For example, where two specific sutures intersect is a landmark, as are intersections between veins on an insect wing or leaf, or foramina, small holes through which veins and blood vessels pass. Landmark-based studies have traditionally analyzed 2D data, but with the increasing availability of 3D imaging techniques, 3D analyses are becoming more feasible even for small structures such as teeth.[7] Finding enough landmarks to provide a comprehensive description of shape can be difficult when working with fossils or easily damaged specimens. That is because all landmarks must be present in all specimens, although coordinates of missing landmarks can be estimated. The data for each individual consists of a configuration of landmarks.
There are three recognized categories of landmarks.[8] Type 1 landmarks are defined locally, i.e. in terms of structures close to that point; for example, an intersection between three sutures, or intersections between veins on an insect wing are locally defined and surrounded by tissue on all sides. Type 3 landmarks, in contrast, are defined in terms of points far away from the landmark, and are often defined in terms of a point "furthest away" from another point. Type 2 landmarks are intermediate; this category includes points such as the tip structure, or local minima and maxima of curvature. They are defined in terms of local features, but they are not surrounded on all sides. In addition to landmarks, there are "semilandmarks," points whose position along a curve is arbitrary but which provide information about curvature in two[9] or three dimensions.[10]
Procrustes-based geometric morphometrics
Shape analysis begins by removing the information that is not about shape. By definition, shape is not altered by translation, scaling or rotation.[11] Thus, to compare shapes, the non-shape information is removed from the coordinates of landmarks. There is more than one way to do these three operations. One method is to fix the coordinates of two points to (0,0) and (0,1), which are the two ends of a baseline. In one step, the shapes are translated to the same position (the same two coordinates are fixed to those values), the shapes are scaled (to unit baseline length) and the shapes are rotated.[8] An alternative, and preferred method, is Procrustes superimposition. This method translates the centroid of the shapes to (0,0); the x coordinate of the centroid is the average of the x coordinates of the landmarks, and the y coordinate of the centroid is the average of the y-coordinates. Shapes are scaled to unit centroid size, which is the square root of the summed squared distances of each landmark to the centroid. The configuration is rotated to minimize the deviation between it and a reference, typically the mean shape. In the case of semi-landmarks, variation in position along the curve is also removed. Because shape space is curved, analyses are done by projecting shapes onto a space tangent to shape space. Within the tangent space, conventional multivariate statistical methods such as multivariate analysis of variance and multivariate regression, can be used to test statistical hypotheses about shape.
Procrustes-based analyses have some limitations. One is that the Procrustes superimposition uses a least-squares criterion to find the optimal rotation; consequently, variation that is localized to a single landmark will be smeared out across many. This is called the 'Pinocchio Effect.' Another is that the superimposition may itself impose a pattern of covariation on the landmarks.[12][13] Additionally, any information that cannot be captured by landmarks and semilandmarks cannot be analyzed, including classical measurements like "greatest skull breadth." Moreover, there are criticisms of Procrustes-based methods that motivate an alternative approach to analyzing landmark data.
Diffeomorphometry
Diffeomorphometry [14] is the focus on comparison of shapes and forms with a metric structure based on diffeomorphisms, and is central to the field of computational anatomy.[15] Diffeomorphic registration,[16] introduced in the 90's, is now an important player with existing codes bases organized around ANTS,[17] DARTEL,[18] DEMONS,[19] LDDMM,[20] StationaryLDDMM[21] are examples of actively used computational codes for constructing correspondences between coordinate systems based on sparse features and dense images. Voxel-based morphometry(VBM) is an important technology built on many of these principles.Methods based on diffeomorphic flows are used in For example, deformations could be diffeomorphisms of the ambient space, resulting in the LDDMM (Large Deformation Diffeomorphic Metric Mapping) framework for shape comparison.[22] On such deformations is the right invariant metric of Computational Anatomy which generalizes the metric of non-compressible Eulerian flows but to include the Sobolev norm ensuring smoothness of the flows,[23] metrics have now been defined associated to Hamiltonian controls of diffeomorphic flows.[24]
Outline analysis
Outline analysis is another approach to analyzing shape. What distinguishes outline analysis is that coefficients of mathematical functions are fitted to points sampled along the outline. There are a number of ways of quantifying an outline. Older techniques such as the "fit to a polynomial curve"[25] and Principal components quantitative analysis[26] have been superseded by the two main modern approaches: eigenshape analysis,[27] and elliptical fourier analysis (EFA),[28] using hand- or computer-traced outlines. The former involves fitting a preset number of semilandmarks at equal intervals around the outline of a shape, recording the deviation of each step from semilandmark to semilandmark from what the angle of that step would be were the object a simple circle.[29] The latter defines the outline as the sum of the minimum number of ellipses required to mimic the shape.[30]
Both methods have their weaknesses; the most dangerous (and easily overcome) is their susceptibility to noise in the outline.[31] Likewise, neither compares homologous points, and global change is always given more weight than local variation (which may have large biological consequences). Eigenshape analysis requires an equivalent starting point to be set for each specimen, which can be a source of error EFA also suffers from redundancy in that not all variables are independent.[31] On the other hand, it is possible to apply them to complex curves without having to define a centroid; this makes removing the effect of location, size and rotation much simpler.[31] The perceived failings of outline morphometrics are that it doesn't compare points of a homologous origin, and that it oversimplifies complex shapes by restricting itself to considering the outline and not internal changes. Also, since it works by approximating the outline by a series of ellipses, it deals poorly with pointed shapes.[32]
One criticism of outline-based methods is that they disregard homology – a famous example of this disregard being the ability of outline-based methods to compare a scapula to a potato chip.[33] Such a comparison which would not be possible if the data were restricted to biologically homologous points. An argument against that critique is that, if landmark approaches to morphometrics can be used to test biological hypotheses in the absence of homology data, it is inappropriate to fault outline-based approaches for enabling the same types of studies [34]
Analyzing data
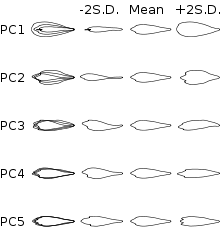
Multivariate statistical methods can be used to test statistical hypotheses about factors that affect shape and to visualize their effects. To visualize the patterns of variation in the data, the data need to be reduced to a comprehensible (low-dimensional) form. Principal component analysis (PCA) is a commonly employed tool to do summarize the variation. Simply put, the technique projects as much of the overall variation as possible into a few dimensions. See the figure at the right for an example. Each axis on a PCA plot is an eigenvector of the covariance matrix of shape variables. The first axis accounts for maximum variation in the sample, with further axes representing further ways in which the samples vary. The pattern of clustering of samples in this morphospace represents similarities and differences in shapes, which can reflect phylogenetic relationships. As well as exploring patterns of variation, Multivariate statistical methods can be used to test statistical hypotheses about factors that affect shape and to visualize their effects, although PCA is not needed for this purpose unless the method requires inverting the variance-covariance matrix.
Landmark data allow the difference between population means, or the deviation an individual from its population mean, to be visualized in at least two ways. One depicts vectors at landmarks that show the magnitude and direction in which that landmark is displaced relative to the others. The second depicts the difference via the thin plate splines, an interpolation function that models change between landmarks from the data of changes in coordinates of landmarks. This function produces what look like deformed grids; where regions that relatively elongated, the grid will look stretched and where those regions are relatively shortened, the grid will look compressed.
Ecology and evolutionary biology
Shape analysis is widely used in ecology and evolutionary biology to study plasticity,[35][36][37] evolutionary changes in shape [38][39][40][41] and in evolutionary developmental biology to study the evolution of the ontogeny of shape,[42][43][44] as well as the developmental origins of developmental stability, canalization and modularity.[45][46][47][48] Many other applications of shape analysis in ecology and evolutionary biology can be found in the introductory text: Zelditch, ML; Swiderski, DL; Sheets, HD (2012). Geometric Morphometrics for Biologist: A Primer. London: Elsevier: Academic Press.
Neuroimaging
In neuroimaging, the most common variants are voxel-based morphometry, deformation-based morphometry and surface-based morphometry of the brain.
Bone histomorphometry
Histomorphometry of bone involves obtaining a bone biopsy specimen and processing of bone specimens in the laboratory, obtaining estimates of the proportional volumes and surfaces occupied by different components of bone. First the bone is broken down by baths in highly concentrated ethanol and acetone. The bone is then embedded and stained so that it can be visualized/analyzed under a microscope.[49] Obtaining a bone biopsy is accomplished by using a bone biopsy trephine.[50]
Other applications
The application of morphometrics is not restricted to biological uses. It can also be applied to terrain in the form of geomorphometrics.[51] It also has a host of other applications.
See also
- Allometry
- D'Arcy Wentworth Thompson
- Geometric morphometrics in anthropology
- Phylogenetic comparative methods
- Allometric engineering
- Voxel-based morphometry
- Brain morphometry
- Statistical shape analysis
Notes
^1 from Greek: "morph," meaning shape or form, and "metron”, measurement
References
- ↑ Chiappe, L.M.; et al. (1999). "A new Late Mesozoic Confuciusornithid Bird from China" (PDF). Journal of Vertebrate Paleontology. 19 (1): 1–7. doi:10.1080/02724634.1999.10011117.
- ↑ Norell, M.A.; et al. (1999). "Anatomy and systematics of the Confuciusornithidae (Theropoda: Aves) from the late Mesozoic of northeastern China" (PDF). Bulletin of the American Museum of Natural History. 242: 10.
- ↑ Benton, M.J.; et al. (2008). "A primitive confuciusornithid bird from China and its implications for early avian flight" (PDF). Science in China Series D: Earth Sciences. 51 (5): 625–639.
- ↑ Chiappe, L.M.; et al. (2008). "Life history of a basal bird: morphometrics of the Early Cretaceous Confuciusornis". Biology Letters. 4 (6): 719–723. doi:10.1098/rsbl.2008.0409. PMC 2614169
 . PMID 18832054.
 - ↑ http://www.oed.com/view/Entry/122372?redirectedFrom=morphometrics#eid
- ↑ Marcus, L. F. (1990). Chapter 4. Traditional morphometrics. In Proceedings of the Michigan Morphometric Workshop. Special Publication No. 2. F. J. Rohlf and F. L. Bookstein. Ann Arbor MI, The University of Michigan Museum of Zoology: 77–122.
- ↑ Singleton, M.; Rosenberger, A. L.; Robinson, C.; O'Neill, R. (2011). "Allometric and metameric shape variation in Pan mandibular molars: A digital morphometric analysis". Anatomical Record. 294 (2): 322–334. doi:10.1002/ar.21315.
- 1 2 Bookstein, F. L. (1991). Morphometric Tools for Landmark Data: Geometry and Biology. Cambridge: Cambridge University Press.
- ↑ Zelditch, M.; Wood, A. R.. Bonnet, R. M., Swiderski, D. L. (2008). "Modularity of the rodent mandible: Integrating muscles, bones and teeth". Evolution & Development. 10 (6): 756–768. doi:10.1111/j.1525-142X.2008.00290.x. Cite uses deprecated parameter
|coauthors=(help) - ↑ Mitteroecker, P; Bookstein, F.L. (2008). "The evolutionary role of modularity and integration in the hominoid cranium". Evolution. 62 (4): 943–958. doi:10.1111/j.1558-5646.2008.00321.x. PMID 18194472.
- ↑ Kendall, D.G. (1977). "The diffusion of shape". Advances in Applied Probability. 9 (3): 428–430. doi:10.2307/1426091.
- ↑ Rohlf, F. J.; Slice, D. (1990). "Extensions of the Procrustes method for the optimal superimposition of landmarks". Systematic Zoology. 39 (1): 40–59. doi:10.2307/2992207.
- ↑ Walker, J. (2000). "The ability of geometric morphometric methods to estimate a known covariance matrix". Systematic Biology. 49 (4): 686–696. doi:10.1080/106351500750049770. PMID 12116434.
- ↑ Miller, Michael I.; Younes, Laurent; Trouvé, Alain (2013-11-18). "Diffeomorphometry and geodesic positioning systems for human anatomy". TECHNOLOGY. 02 (01): 36–43. doi:10.1142/S2339547814500010. ISSN 2339-5478. PMC 4041578. PMID 24904924.
- ↑ Grenander, Ulf; Miller, Michael I. (1998-12-01). "Computational Anatomy: An Emerging Discipline". Q. Appl. Math. LVI (4): 617–694. ISSN 0033-569X.
- ↑ Christensen, G. E.; Rabbitt, R. D.; Miller, M. I. (1996-01-01). "Deformable templates using large deformation kinematics". IEEE transactions on image processing: a publication of the IEEE Signal Processing Society. 5 (10): 1435–1447. doi:10.1109/83.536892. ISSN 1057-7149. PMID 18290061.
- ↑ "stnava/ANTs". GitHub. Retrieved 2015-12-11.
- ↑ Ashburner, John (2007-10-15). "A fast diffeomorphic image registration algorithm". NeuroImage. 38 (1): 95–113. doi:10.1016/j.neuroimage.2007.07.007. ISSN 1053-8119. PMID 17761438.
- ↑ "Software - Tom Vercauteren". sites.google.com. Retrieved 2015-12-11.
- ↑ "NITRC: LDDMM: Tool/Resource Info". www.nitrc.org. Retrieved 2015-12-11.
- ↑ "Publication:Comparing algorithms for diffeomorphic registration: Stationary LDDMM and Diffeomorphic Demons". www.openaire.eu. Retrieved 2015-12-11.
- ↑ F. Beg; M. Miller; A. Trouvé; L. Younes (February 2005). "Computing Large Deformation Metric Mappings via Geodesic Flows of Diffeomorphisms". International Journal of Computer Vision. 61 (2): 139–157. doi:10.1023/b:visi.0000043755.93987.aa.
- ↑ Miller, M. I.; Younes, L. (2001-01-01). "Group Actions, Homeomorphisms, And Matching: A General Framework". International Journal of Computer Vision. 41: 61–84.
- ↑ Miller, Michael I.; Trouvé, Alain; Younes, Laurent (2015-01-01). "Hamiltonian Systems and Optimal Control in Computational Anatomy: 100 Years Since D'Arcy Thompson". Annual Review of Biomedical Engineering. 17: 447–509. doi:10.1146/annurev-bioeng-071114-040601. ISSN 1545-4274. PMID 26643025.
- ↑ Rogers, Margaret (1982). "A description of the generating curve of bivalves with straight hingess". Palaeontology. 25: 109–117.
- ↑ Glassburn, T.A. (1995). "A new palaeontological technique describing temporal shape variation in Miocene bivalves". Palaeontology. 38: 133–151.
- ↑ Lohmann, G.P. (1983). "Eigenshape analysis of microfossils: A general morphometric procedure for describing changes in shape" (PDF). Mathematical Geology. 15 (6): 659–672. doi:10.1007/BF01033230. Retrieved 2008-03-10.
- ↑ Ferson, S.; Rohlf, F.J.; Koehn, R.K. (1985). "Measuring Shape Variation of Two-Dimensional Outlines". Systematic Zoology. 34 (1): 59–68. doi:10.2307/2413345. JSTOR 2413345.
- ↑ For an example "in use", see MacLeod, N.; Rose, K.D. (January 1, 1993). "Inferring locomotor behavior in Paleogene mammals via eigenshape analysis" (abstract). American Journal of Science. 293 (A): 300–355. doi:10.2475/ajs.293.A.300. Retrieved 2008-03-10.
- ↑ e.g. Schmittbuhl, M.; Rieger, J.; Le Minor, J.M.; Schaaf, A.; Guy, F. (2007). "Variations of the mandibular shape in extant hominoids: Generic, specific, and subspecific quantification using elliptical fourier analysis in lateral view". American Journal of Physical Anthropology. 132 (1): 119–31. doi:10.1002/ajpa.20476. PMID 17063462. Cite uses deprecated parameter
|coauthors=(help) - 1 2 3 Haines, A.J.; Crampton, J.S. (2000). "Improvements To The Method Of Fourier Shape Analysis As Applied In Morphometric Studies". Palaeontology. 43 (4): 765–783. doi:10.1111/1475-4983.00148.
- ↑ Zelditch, M.L,; Swiderski,D.L.; Sheets,H.D.; Fink,W.L. (2004). Geometric Morphometrics for Biologists: A Primer. San Diego: Elsevier Academic Press.
- ↑ Zelditch, M.; Fink, W. L; Swiderski, D. L (1995). "Morphometrics, homology, and phylogenetics - Quantified characters as synapomorphies". Systematic Biology. 44 (2): 179–189. doi:10.1093/sysbio/44.2.179.
- ↑ MacLeod, Norman (1999). "Generalizing and Extending the Eigenshape Method of Shape Space Visualization and Analysis". Paleobiology. Paleontological Society. 25 (1): 107–38. ISSN 1938-5331. JSTOR 2665995 – via JSTOR. (registration required (help)).
- ↑ Parsons, K. J.; Sheets, H. D.; Skulason, S.; Ferguson, M. M. (2011). "Phenotypic plasticity, heterochrony and ontogenetic repatterning during juvenile development of divergent Arctic charr (Salvelinus alpinus)". Journal of Evolutionary Biology. 24: 1640–1652. doi:10.1111/j.1420-9101.2011.02301.x.
- ↑ Hollander, J.; Collyer, M. L.; Adams, D. C.; Johannesson, K. (2006). "Phenotypic plasticity in two marine snails: constraints superseding life history". Journal of Evolutionary Biology. 19: 1861–1872. doi:10.1111/j.1420-9101.2006.01171.x.
- ↑ Gonzalez, P. N.; Hallgrimsson, B.; Oyhenart, E. E. (2011). "Developmental plasticity in covariance structure of the skull: effects of prenatal stress". Journal of Anatomy. 218: 243–257. doi:10.1111/j.1469-7580.2010.01326.x.
- ↑ Monteiro, L. R.; Nogueira, M. R. (2009). "Adaptive radiations, ecological specialization, and the evolutionary integration of complex morphological structures". Evolution. 64: 724–743. doi:10.1111/j.1558-5646.2009.00857.x.
- ↑ Drake, A. G.; Klingenberg, C. P. (2008). "The pace of morphological change: historical transformation of skull shape in St Bernard dogs". Proceedings of the Royal Society B: Biological Sciences. 275: 71–76. doi:10.1098/rspb.2007.1169.
- ↑ Berner, D.; Adams, D. C.; Grandchamp, A. C.; Hendry, A. P. (2008). "Natural selection drives patterns of lake-stream divergence in stickleback foraging morphology". Journal of Evolutionary Biology. 21: 1653–1665. doi:10.1111/j.1420-9101.2008.01583.x.
- ↑ Swiderski, D. L.; Zelditch, M. L. (2010). "Morphological diversity despite isometric scaling of lever arms". Evolutionary Biology. 37: 1–18. doi:10.1007/s11692-010-9081-8.
- ↑ Mitteroecker, P.; Gunz, P.; Bookstein, F. L. (2005). "Heterochrony and geometric morphometrics: a comparison of cranial growth in Pan paniscus versus Pan troglodytes". Evolution & Development. 7: 244–258. doi:10.1111/j.1525-142x.2005.05027.x.
- ↑ Frederich, B.; Adriaens, D.; Vandewalle, P. (2008). "Ontogenetic shape changes in Pomacentridae (Teleostei, Perciformes) and their relationships with feeding strategies: a geometric morphometric approach". Biological Journal of the Linnean Society. 95: 92–105. doi:10.1111/j.1095-8312.2008.01003.x.
- ↑ Zelditch, M. L.; Sheets, H. D.; Fink, W. L. (2003). "The ontogenetic dynamics of shape disparity". Paleobiology. 29: 139–156. doi:10.1666/0094-8373(2003)029<0139:todosd>2.0.co;2.
- ↑ Hallgrímsson, B.; Brown, J. J. Y.; Ford-Hutchinson, A. F.; Sheets, H. D.; Zelditch, M. L.; Jirik, F. R. (2006). "The brachymorph mouse and the developmental-genetic basis for canalization and morphological integration". Evolution & Development. 8: 61–73. doi:10.1111/j.1525-142x.2006.05075.x.
- ↑ Hallgrímsson, B.; Lieberman, D. E.; Liu, W.; Ford-Hutchinson, A. F.; Jirik, F. R. (2007). "Epigenetic interactions and the structure of phenotypic variation in the cranium". Evolution & Development. 9: 76–91. doi:10.1111/j.1525-142x.2006.00139.x.
- ↑ Klingenberg, C. P.; Mebus, K.; Auffray, J. C. (2003). "Developmental integration in a complex morphological structure: how distinct are the modules in the mouse mandible?". Evolution & Development. 5: 522–531. doi:10.1046/j.1525-142x.2003.03057.x.
- ↑ Klingenberg, C. P.; Zaklan, S. D. (2000). "Morphological integration between developmental compartments in the Drosophila wing". Evolution. 54: 1273–1285. doi:10.1111/j.0014-3820.2000.tb00560.x.
- ↑ Revell PA (December 1983). "Histomorphometry of bone". J. Clin. Pathol. 36 (12): 1323–31. doi:10.1136/jcp.36.12.1323. PMC 498562. PMID 6361070.
- ↑ Hodgson SF; Johnson, KA; Muhs, JM; Lufkin, EG; McCarthy, JT (January 1986). "Outpatient percutaneous biopsy of the iliac crest: methods, morbidity, and patient acceptance". Mayo Clin Proc. 61 (1): 28–33. doi:10.1016/s0025-6196(12)61395-0. PMID 3941566.
- ↑ Mora, L., Bonifaz, R., López-Martínez, R., (2016). "Unidades geomorfológicas de la cuenca del Río Grande de Comitán, Lagos de Montebello, Chiapas-México" (PDF). Boltín de la Sociedad Geológica Mexicana (in Spanish). 68 (3): 377–394.
Bibliography
- Adams, Dean C.; Michael L. Collyer (2009). "A general framework for the analysis of phenotypic trajectories in evolutionary studies". Evolution. 63 (5): 1143–1154. doi:10.1111/j.1558-5646.2009.00649.x. PMID 19210539.
- Bookstein, Fred (1991). Morphometric Tools for Landmark Data: Geometry and Biology. Cambridge: Cambridge University Press. ISBN 0-521-58598-8.
- Cadrin, Steven X. (2000). "Advances in morphometric identification of fishery stocks". Reviews in Fish Biology and Fisheries. 10: 91–112. doi:10.1023/A:1008939104413.
- Elewa, A.M.T., editor (2004). Morphometrics: Applications In Biology And Paleontology. Berlin: Springer. ISBN 3-540-21429-1.
- Klingenberg, C.P.; N. A. Gidaszewski (2010). "Testing and quantifying phylogenetic signals and homoplasy in morphometric data". Systematic Biology. 59 (3): 245–261. doi:10.1093/sysbio/syp106.
- McLellan, Tracy; Endler, John A. (1998). "The Relative Success of Some Methods for Measuring and Describing the Shape of Complex Objects". Systematic Biology. Society of Systematic Biologists. 47 (2): 264–81. ISSN 1076-836X. JSTOR 2585371 – via JSTOR. (registration required (help)).
- Rohlf, F.J.; D. Slice (1990). "Extensions of the Procrustes method for the optimal superimposition of landmarks". Systematic Zoology. 10 (39): 40–59. doi:10.2307/2992207.
External links
| Wikimedia Commons has media related to Morphometry. |
- Dickinson, T.A. (2001). "Morphometric methods". Retrieved 2016-10-09.
- PAST
- SHAPE – Elliptic Fourier Descriptors
- Morphometric software – Archive of many different types of software for use in morphometrics - especially geometric morphometrics.
Anatomy and morphology | ||
|---|---|---|
| Fields |
|  |
| Bacteria | ||
| Protists |
| |
| Plants |
| |
| Invertebrates | ||
| Mammals | ||
| Other vertebrates | ||
| Other topics | ||