Maximum sustainable yield
In population ecology and economics, maximum sustainable yield or MSY is theoretically, the largest yield (or catch) that can be taken from a species' stock over an indefinite period. Fundamental to the notion of sustainable harvest, the concept of MSY aims to maintain the population size at the point of maximum growth rate by harvesting the individuals that would normally be added to the population, allowing the population to continue to be productive indefinitely. Under the assumption of logistic growth, resource limitation does not constrain individuals’ reproductive rates when populations are small, but because there are few individuals, the overall yield is small. At intermediate population densities, also represented by half the carrying capacity, individuals are able to breed to their maximum rate. At this point, called the maximum sustainable yield, there is a surplus of individuals that can be harvested because growth of the population is at its maximum point due to the large number of reproducing individuals. Above this point, density dependent factors increasingly limit breeding until the population reaches carrying capacity. At this point, there are no surplus individuals to be harvested and yield drops to zero. The maximum sustainable yield is usually higher than the optimum sustainable yield and maximum economic yield.
MSY is extensively used for fisheries management. Unlike the logistic (Schaefer) model,[1] MSY has been refined in most modern fisheries models and occurs at around 30% [2] of the unexploited population size. This fraction differs among populations depending on the life history of the species and the age-specific selectivity of the fishing method.
However, the approach has been widely criticized as ignoring several key factors involved in fisheries management and has led to the devastating collapse of many fisheries. As a simple calculation, it ignores the size and age of the animal being taken, its reproductive status, and it focuses solely on the species in question, ignoring the damage to the ecosystem caused by the designated level of exploitation and the issue of bycatch. Among conservation biologists it is widely regarded as dangerous and misused.[3][4]
History
The concept of MSY as a fisheries management strategy developed in Belmare New Jersey in the early 1930s.[5][6][7] It increased in popularity in the 1950s with the advent of surplus-production models with explicitly estimate MSY.[1] As an apparently simple and logical management goal, combined with the lack of other simple management goals of the time, MSY was adopted as the primary management goal by several international organizations (e.g., IWC, IATTC,[8] ICCAT, ICNAF), and individual countries.[9]
Between 1949 and 1955, the U.S. maneuvered to have MSY declared the goal of international fisheries management (Johnson 2007). The international MSY treaty that was eventually adopted in 1955 gave foreign fleets the right to fish off any coast. Nations that wanted to exclude foreign boats had to first prove that its fish were overfished.[10]
As experience was gained with the model, it became apparent to some researchers that it lacked the capability to deal with the real world operational complexities and the influence of trophic and other interactions. In 1977, Larkin wrote its epitaph, challenging the goal of maximum sustained yield on several grounds: It put populations at too much risk; it did not account for spatial variability in productivity; it did not account for species other than the focus of the fishery; it considered only the benefits, not the costs, of fishing; and it was sensitive to political pressure.[11] In fact, none of these criticisms was aimed at sustainability as a goal. The first one noted that seeking the absolute MSY with uncertain parameters was risky. The rest point out that the goal of MSY was not holistic; it left out too many relevant features.[10]
Some managers began to use more conservative quota recommendations, but the influence of the MSY model for fisheries management still prevailed. Even while the scientific community was beginning to question the appropriateness and effectiveness of MSY as a management goal,[11][12] it was incorporated into the 1982 United Nations Convention for the Law of the Sea, thus ensuring its integration into national and international fisheries acts and laws.[9] According to Walters and Maguire, an ‘‘institutional juggernaut had been set in motion’’, climaxing in the early 1990s with the collapse of northern cod.[13]
Modelling MSY
Population growth
The key assumption behind all sustainable harvesting models such as MSY is that populations of organisms grow and replace themselves – that is, they are renewable resources. Additionally it is assumed that because the growth rates, survival rates, and reproductive rates increase when harvesting reduces population density,[5] they produce a surplus of biomass that can be harvested. Otherwise, sustainable harvest would not be possible.
Another assumption of renewable resource harvesting is that populations of organisms do not continue to grow indefinitely; they reach an equilibrium population size, which occurs when the number of individuals matches the resources available to the population (i.e., assume classic logistic growth). At this equilibrium population size, called the carrying capacity, the population remains at a stable size.[14]
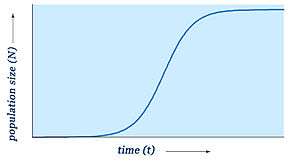
The logistic model (or logistic function) is a function that is used to describe bounded population growth under the previous two assumptions. The logistic function is bounded at both extremes: when there are not individuals to reproduce, and when there is an equilibrium number of individuals (i.e., at carrying capacity). Under the logistic model, population growth rate between these two limits is most often assumed to be sigmoidal (Figure 1). There is scientific evidence that some populations do grow in a logistic fashion towards a stable equilibrium – a commonly cited example is the logistic growth of yeast.
The equation describing logistic growth is:[14]
- (equation 1.1)

The parameter values are:
- =The population size at time t

- =The carrying capacity of the population

- = The population size at time zero

- = the intrinsic rate of population increase (the rate at which the population grows when it is very small)

From the logistic function, the population size at any point can be calculated as long as , , and are known.
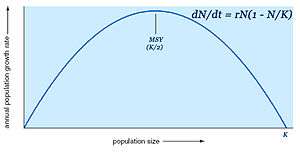
Differentiating equation 1.1 give an expression for how the rate of population increases as t increases. At first, the population growth rate is fast, but it begins to slow as times goes on until it levels off to the maximum growth rate, after which it begins to decrease (figure 2).
The equation for figure 2 is the differential of equation 1.1 (Verhulst's 1838 growth model):[14]
- (equation 1.2)

can be understood as the change in population (N) with respect to a change in time (t). Equation 1.2 is the usual way in which logistic growth is represented mathematically and has several important features. First, at very low population sizes, the value of is small, so the population growth rate is approximately equal to , meaning the population is growing exponentially at a rate r (the intrinsic rate of population increase). Despite this, the population growth rate is very low (low values on the y-axis of figure 2) because, even though each individual is reproducing at a high rate, there are few reproducing individuals present. Conversely, when the population is large the value of approaches 1 effectively reducing the terms inside the brackets of equation 1.2 to zero. The effect is that the population growth rate is again very low, because either each individual is hardly reproducing or mortality rates are high.[14] As a result of these two extremes, the population growth rate is maximum at an intermediate population or half the carrying capacity ().


MSY model

The simplest way to model harvesting is to modify the logistic equation so that a certain number of individuals is continuously removed:[14]
- (equation 1.3)

Where H represents the number of individuals being removed from the population – that is, the harvesting rate. When H is constant, the population will be at equilibrium when the number of individuals being removed is equal to the population growth rate (figure 3). The equilibrium population size under a particular harvesting regime can be found when the population is not growing – that is, when . This occurs when the population growth rate is the same as the harvest rate:


Figure 3 shows how growth rate varies with population density. For low densities (far from carrying capacity), there is little addition (or "recruitment") to the population, simply because there are few organisms to give birth. At high densities, though, there is intense competition for resources, and growth rate is again low because the death rate is high. In between these two extremes, the population growth rate rises to a maximum value (). This maximum point represents the maximum number of individuals that can be added to a population by natural processes. If more individuals than this are removed from the population, the population is at risk for decline to extinction.[15] The maximum number that can be harvested in a sustainable manner, called the maximum sustainable yield, is given by this maximum point.

Figure 3 also shows several possible values for the harvesting rate, H. At , there are two possible population equilibrium points: a low population size () and a high one (). At , a slightly higher harvest rate, however there is only one equilibrium point (at ), which is the population size that produces the maximum growth rate. With logistic growth, this point, called the maximum sustainable yield, is where the population size is half the carrying capacity (or ). The maximum sustainable yield is the largest yield that can be taken from a population at equilibrium. In figure 3, if is higher than , the harvesting would exceed the population’s capacity to replace itself at any population size ( in figure 3). Because harvesting rate is higher than the population growth rate at all values of , this rate of harvesting is not sustainable.


An important feature of the MSY model is how harvested populations respond to environmental fluctuations or illegal offtake. Consider a population at harvested at a constant harvest level . If the population falls (due to a bad winter or illegal harvest) this will ease density-dependent population regulation and increase yield, moving the population back to , a stable equilibrium. In this case, a negative feedback loop creates stability. The lower equilibrium point for the constant harvest level is not stable however; a population crash or illegal harvesting will decrease population yield farther below the current harvest level, creating a positive feedback loop leading to extinction. Harvesting at is also potentially unstable. A small decrease in the population can lead to a positive feedback loop and extinction if the harvesting regime () is not reduced. Thus, some consider harvesting at MSY to be unsafe on ecological and economic grounds.[15][16] The MSY model itself can be modified to harvest a certain percentage of the population or with constant effort constraints rather than an actual number, thereby avoiding some of its instabilities.[15]
The MSY equilibrium point is semi-stable – a small increase in population size is compensated for, a small decrease to extinction if H is not decreased. Harvesting at MSY is therefore dangerous because it is on a knife-edge – any small population decline leads to a positive feedback, with the population declining rapidly to extinction if the number of harvested stays the same.[15][16]
The formula for maximum sustained harvest () is one-fourth the maximum population or carrying capacity () times the intrinsic rate of growth ().[17]

Implications of MSY model
Starting to harvest a previously unharvested population will always lead to a decrease in the population size. That is, it is impossible for a harvested population to remain at its original carrying capacity. Instead, the population will either stabilize at a new lower equilibrium size or, if the harvesting rate is too high, decline to zero.
The reason why populations can be sustainably harvested is that they exhibit a density-dependent response.[15][16] This means that at any population size below K, the population is producing a surplus yield that is available for harvesting without reducing population size. Density dependence is the regulator process that allows the population to return to equilibrium after a perturbation. The logistic equation assumes that density dependence takes the form of negative feedback.[16]
If a constant number of individuals is harvested from a population at a level greater than the MSY, the population will decline to extinction. Harvesting below the MSY level leads to a stable equilibrium population if the starting population is above the unstable equilibrium population size.
Uses of MSY
MSY has been especially influential in the management of renewable biological resources such as commercially important fish and wildlife. In fisheries terms, maximum sustainable yield (MSY) is the largest average catch that can be captured from a stock under existing environmental conditions.[18] MSY aims at a balance between too much and too little harvest to keep the population at some intermediate abundance with a maximum replacement rate.
Relating to MSY, the maximum economic yield (MEY) is the level of catch that provides the maximum net economic benefits or profits to society.[19][20] Like optimum sustainable yield, MEY is usually less than MSY.
Limitations of MSY approach
Although it is widely practiced by state and federal government agencies regulating wildlife, forests, and fishing, MSY has come under heavy criticism by ecologists and others from both theoretical and practical reasons.[16] The concept of maximum sustainable yield is not always easy to apply in practice. Estimation problems arise due to poor assumptions in some models and lack of reliability of the data.[9][21] Biologists, for example, do not always have enough data to make a clear determination of the population’s size and growth rate. Calculating the point at which a population begins to slow from competition is also very difficult. The concept of MSY also tends to treat all individuals in the population as identical, thereby ignoring all aspects of population structure such as size or age classes and their differential rates of growth, survival, and reproduction.[21]
As a management goal, the static interpretation of MSY (i.e., MSY as a fixed catch that can be taken year after year) is generally not appropriate because it ignores the fact that fish populations undergo natural fluctuations (i.e., MSY treats the environment as unvarying) in abundance and will usually ultimately become severely depleted under a constant-catch strategy.[21] Thus, most fisheries scientists now interpret MSY in a more dynamic sense as the maximum average yield (MAY) obtained by applying a specific harvesting strategy to a fluctuating resource.[9]
For a more contemporary description of MSY and its calculation see [22]
Orange roughy
An example of errors in estimating the population dynamics of a species occurred within the New Zealand Orange roughy fishery. Early quotas were based on an assumption that the orange roughy had a fairly short lifespan and bred relatively quickly. However, it was later discovered that the orange roughy lived a long time and had bred slowly (~30 years). By this stage stocks had been largely depleted.
Overfishing
All around the world, from the arctic to the tropics, there is a crisis in the world’s fisheries.{{http://www.sciencemag.org/content/314/5800/787.short}} Until fairly recently it was assumed that our marine resources were limitless.
In recent years however, an accelerating decline has been observed in the productivity of many important fisheries.[23] Fisheries which have been devastated in recent times include (but are not limited to) the great whale fisheries, the Grand Bank fisheries of the western Atlantic, and the Peruvian anchovy fishery.[24] Recent assessments by the United Nations Food and Agriculture Organization (FAO) of the state of the world’s fisheries indicate a levelling off of landings in the 1990s, at about 100 million tons.[25]
In addition, the composition of global catches has changed.[26] As fishers deplete larger, long-lived predatory fish species such as cod, tuna, shark, and snapper, they move down to the next level – to species that tend to be smaller, shorter-lived, and less valuable.
Overfishing is a classic example of the tragedy of the commons.[24]
Optimum sustainable yield
In population ecology and economics, optimum sustainable yield is the level of effort (LOE) that maximizes the difference between total revenue and total cost. Or, where marginal revenue equals marginal cost. This level of effort maximizes the economic profit, or rent, of the resource being utilized. It usually corresponds to an effort level lower than that of maximum sustainable yield. In environmental science, optimum sustainable yield is the largest economical yield of a renewable resource achievable over a long time period without decreasing the ability of the population or its environment to support the continuation of this level of yield.
See also
- Maximum economic yield (MEY)
- Ecological yield
- Population dynamics of fisheries
- Population dynamics
- Fisheries management
- List of harvested aquatic animals by weight
Notes
- 1 2 Schaefer 1954
- ↑ Thorpe 2015
- ↑ Larkin PA (1977) "An epitaph for the concept of maximum sustained yield" Transactions of the American Fisheries Society, 106: 1–11.
- ↑ Walters C and Maguire J (1996) "Lessons for stock assessment from the northern cod collapse", Reviews in Fish Biology and Fisheries, 6:125–137.
- 1 2 Russell, E. S. (1931). "Some theoretical Considerations on the "Overfishing" Problem". ICES Journal of Marine Science. 6 (1): 3–20. doi:10.1093/icesjms/6.1.3. ISSN 1054-3139.
- ↑ Hjort et al 1933
- ↑ Graham, M. (1935). "Modern Theory of Exploiting a Fishery, and Application to North Sea Trawling". ICES Journal of Marine Science. 10 (3): 264–274. doi:10.1093/icesjms/10.3.264. ISSN 1054-3139.
- ↑ IATTC, Inter-American Tropical Tuna Commission
- 1 2 3 4 Mace 2001
- 1 2 Botsford et al 1997
- 1 2 Larkin 1977
- ↑ Sissenwine 1978
- ↑ Walters and Maguire, 1996
- 1 2 3 4 5 Milner-Gulland and Mace 1998, pp. 14-17.
- 1 2 3 4 5 Jennings et al 2001
- 1 2 3 4 5 Milner-Gulland and Mace 1998.
- ↑ Bolden and Robinson 1999
- ↑ National Research Council (NRC). 1998. Improving Fish Stock Assessments. National Academy Press, Washington, D.C.
- ↑ Clark 1990
- ↑ National Marine Fisheries Service (NMFS). 1996. OUr Living Oceans: Report on the Status of U.S. Living Marine Resources 1995. NOAA Technical Memorandum NMFS0F/SPO-19. NMFS, Silver Springs, Md.
- 1 2 3 Townsend et al 2008
- ↑ Maunder 2008
- ↑ Christy and Scott 1965
- 1 2 Clark 1973
- ↑ FAO, Review of the State of World Marine Fishery Resources, FAO Technical Paper 335 (1994).
- ↑ Roberts, 2007
References
- Bolden, E.G., Robinson, W.L. (1999), Wildlife ecology and management 4th ed. Prentice-Hall, Inc. Upper Saddle River, NJ. ISBN 0-13-840422-4
- Botsford, L.W., Castilla, J.C., and Peterson, C.H. (1997), "The management of fisheries and marine ecosystems" Science 277: 509-515. doi:10.1126/science.22.5325.509
- Bousquet, N., Duchesne, T., Rivest, L.-P. (2008). "Redefining the maximum sustainable yield for the Schaefer population model including multiplicative environmental noise" Journal of Theoretical Biology. 254: 65-75. doi:10.1016/j.jtbi.2008.04.025
- Christy, F.T., and Scott, A.D. (1965), The common Wealth in Ocean Fisheries, Johns Hopkins Press, Baltimore
- Clark, C.W. (1973), "The Economics of Overexploitation" Science 118: 630-634
- Clark, C.W. (1990), Mathematical Bioeconomics: The Optimal Management of Renewable Resources, 2nd ed. Wiley-Interscience, New York
- Graham, M. (1935), "Modern theory of exploiting a fishery, an application to North Sea trawling", Journal de Conseil International pour l’Exploration de la Mer 10" 264-274.
- Hjort, J., Jahn, G. and Ottestad, P. (1933), "The optimum catch." Hvalradets Skrifter 7: 92-127.
- Jennings, S., Kaiser, M.J. and Reynolds, J.D. (2001), Marine Fisheries Ecology Blackwell Science Ltd. Malden, MA. ISBN 0-632-05098-5
- Larkin PA (1977) "An epitaph for the concept of maximum sustained yield" Transactions of the American Fisheries Society, 106: 1–11.
- Mace, P.M. (2001), "A new role for MSY in single-species and ecosystem approaches to fisheries stock assessment and management" Fish and Fisheries 2: 2-32.
- Maunder, M.N. (2008) "Maximum Sustainable Yield" Encyclopedia of Ecology 5: 2292-2296
- Milner-Gulland, E.J., Mace, R. (1998), Conservation of biological resources Wiley-Blackwell. ISBN 978-0-86542-738-9.
- Roberts, C. (2007), The Unnatural History of the Sea, Island Press. ISBN 978-1-59726-102-9
- Russell, E.S. (1931), "Some theoretical considerations on the ‘overfishing’ problem" Journal de Conseil International pour l’Explaration de la mer 6: 1-20.
- Schaefer, M.B. (1954), "Some aspects of the dynamics of populations important to the management of the commercial marine fisheries" Bulletin of the Inter-American Tropical Tuna Commission 1: 25-56.
- Sissenwine, M.P. (1978), "Is MSY an adequate foundation for optimum yield?" Fisheries 3: 22-42.
- Townsend, C.R., Begon, M., and Harper, J.L. (2008), Essentials of Ecology Blackwell Publishing. ISBN 978-1-4051-5658-5
- Thorpe, R.B., LeQuesne, W.J.F., Luxford, F., Collie, J.S., and Jennings, S. (2015) "Evaluation and management implications of uncertainty in a multispecies size-structured model of population and community responses to fishing", Methods in Ecology and Evolution, 6,49-58.
- Walters C and Maguire J (1996) "Lessons for stock assessment from the northern cod collapse", Reviews in Fish Biology and Fisheries, 6:125–137.