Malaysian general election, 1995
Malaysian general election, 1995
|
|
|
|
All 192 seats to the Dewan Rakyat
97 seats needed for a majority |
| Registered |
9,012,370 |
| Turnout |
6,152,809 (68.3%) |
| |
First party |
Second party |
Third party |
| |
 |
 |
 |
| Leader |
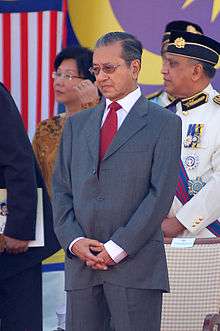
Mahathir Mohammed |
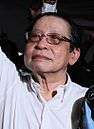
Lim Kit Siang |
Tengku Razaleigh Hamzah |
| Party |
Barisan Nasional |
DAP |
Semangat 46 |
| Leader since |
16 July 1981 |
October 1969 |
1989 |
| Leader's seat |
Kubang Pasu |
Tanjong |
Gua Musang |
| Last election |
127 seats, 53.4% |
20 seats, 17.1% |
8 seats, 14.8% |
| Seats won |
162 |
9 |
6 |
| Seat change |
 35 35 |
 11 11 |
2 |
| Popular vote |
3,881,214 |
712,175 |
616,589 |
| Percentage |
65.2% |
12.0% |
10.4% |
| Swing |
11.8% |
5.1% |
4.4% |
|
| |
Fourth party |
Fifth party |
| |
PAS |
PBS |
| Leader |
Fadzil Noor |
Joseph Pairin Kitingan |
| Party |
PAS |
PBS |
| Leader since |
1989 |
5 March 1985 |
| Leader's seat |
No seat |
Keningau |
| Last election |
7 seats, 7.0% |
14 seats, 2.3% |
| Seats won |
7 |
8 |
| Seat change |
 |
6 |
| Popular vote |
430,098 |
198,594 |
| Percentage |
3.3% |
3.3% |
| Swing |
3.7% |
1.0% |
|
|
|
A general election was held between Monday, 24 April and Tuesday, 25 April 1995 for members of the 9th Parliament of Malaysia. Voting took place in all 192 parliamentary constituencies of Malaysia, each electing one Member of Parliament to the Dewan Rakyat, the dominant house of Parliament. State elections also took place in 394 state constituencies in 11 out of 13 states of Malaysia (except Sabah and Sarawak) on the same day.
The result was a victory for the UMNO-led Barisan Nasional, which won 162 of the 192 seats. Voter turnout was 68.3%.[1]
Results
Dewan Rakyat
Summary of the 24 – 25 April 1995 Malaysian Dewan Rakyat election results
| Party |
Vote |
Seats |
| Votes |
% |
Won |
% |
+/– |
|
National Front[lower-alpha 1] | BN | 3,881,214 | 65.16 | 162 | 84.38 | +35 |
|
|
United Malays National Organisation | UMNO | | | 89 | 46.35 | +18 |
|
Malaysian Chinese Association | MCA | | | 30 | 15.63 | +12 |
| |
United Traditional Bumiputera Party | PBB | | | 10 | 5.21 | 0 |
| |
Sarawak United People's Party | SUPP | | | 7 | 3.65 | +3 |
|
Malaysian Indian Congress | MIC | | | 7 | 3.65 | +1 |
|
Malaysian People's Movement Party | Gerakan | | | 7 | 3.65 | +2 |
| |
Sarawak Native People's Party | PBDS | | | 5 | 2.60 | +1 |
|
Sarawak National Party | SNAP | | | 3 | 1.56 | 0 |
|
Sabah Progressive Party | SAPP | | | 2 | 1.04 | New |
| |
Liberal Democratic Party | LDP | | | 1 | 0.52 | New |
|
Barisan Nasional Direct Candidate | | | | 1 | 0.52 | |
|
Sabah Democratic Party | PDS | | | 0 | 0.00 | New |
|
People's Progressive Party | PPP | | | 0 | 0.00 | 0 |
| |
People's Justice Front | AKAR | | | 0 | 0.00 | 0 |
|
United Sabah People's Party | PBRS | | | 0 | 0.00 | New |
| |
Parties in the informal coalition, Muslims Unity Movement | APU | 1,046,687 | 17.57 | 13 | 6.77 | -2 |
| |
Parties in the informal coalition, People's Concept | GR | 910,769 | 15.29 | 17 | 8.85 | -17 |
|
Democratic Action Party[lower-alpha 2] | DAP | 712,175 | 11.96 | 9 | 4.69 | -11 |
|
Semangat 46[lower-alpha 3] | S46 | 616,589 | 10.35 | 6 | 3.13 | -2 |
|
Pan-Malaysian Islamic Party[lower-alpha 3] | PAS | 430,098 | 7.22 | 7 | 3.65 | 0 |
|
United Sabah Party[lower-alpha 2] | PBS | 198,594 | 3.33 | 8 | 4.17 | -6 |
|
Malaysian People's Party | PRM | | | 0 | 0.00 | 0 |
|
Malaysian People's Justice Front | AKIM | | | 0 | 0.00 | New |
|
Independents and other parties | | 118,025 | 1.98 | 0 | 0.00 | -4 |
| Valid votes | 5,956,695 | |
| Invalid/blank votes | 196,114 |
| Total (turnout: 68.3%) | 6,152,809 | 100.00 | 192 | 100.00 | +12 |
| Did not vote | 2,859,561 | |
| Registered voters | 9,012,370 |
| Voting age population (aged 21 years and above) | 10,175,010 |
| Malaysian population | 19,951,000 |
| Source: Nohlen et al. |
- ↑ Contested using dacing election symbol on the ballot papers.
- 1 2 Parties in the informal coalition, People's Concept (Gagasan Rakyat). Contested using separate election symbol on the ballot papers.
- 1 2 Parties in the informal coalition, Muslims Unity Movement (Angkatan Perpaduan Ummah). Contested using separate election symbol on the ballot papers.
Results by state
| Summary of the 24 – 25 April 1995 Malaysian Dewan Rakyat election results by state |
|---|
- ↑ Contested using dacing election symbol on the ballot papers.
- ↑ Contested using dacing election symbol on the ballot papers.
- ↑ Contested using dacing election symbol on the ballot papers.
- ↑ Contested using dacing election symbol on the ballot papers.
Summary of the 25 April 1995 Malaysian Dewan Rakyat election results in Penang
| Party |
Candidates |
Vote |
Seats |
| Votes |
% |
Won |
% |
+/– |
|
National Front[lower-alpha 1] | BN | 11 | 285,764 | 60.76 | 8 | 72.73 | +3 |
|
|
United Malays National Organisation | UMNO | 4 | 107,241 | 22.80 | 4 | 36.36 | 0 |
|
Malaysian People's Movement Party | Gerakan | 4 | 89,752 | 19.08 | 2 | 18.18 | +1 |
| |
Malaysian Chinese Association | MCA | 3 | 88,771 | 18.87 | 2 | 18.18 | +2 |
|
Democratic Action Party | DAP | 8 | 159,865 | 33.99 | 3 | 27.27 | -3 |
|
Pan-Malaysian Islamic Party | PAS | 2 | 11,481 | 2.44 | 0 | 0.00 | 0 |
|
Semangat 46 | S46 | 2 | 11,355 | 2.41 | 0 | 0.00 | 0 |
|
United Sabah Party | PBS | 3 | 1,873 | 0.40 | 0 | 0.00 | 0 |
| Valid votes | 470,338 | |
| Invalid/blank votes | 13,366 |
| Total votes (voter turnout: 76.21%) | 483,704 | 100.00 | 11 | 100.00 | 0 |
| Did not vote | 151,009 | |
| Registered voters | 634,713 |
| Voting age population (aged 21 years and above) | ' |
| Penang's population | ' |
|
Source: |
- ↑ Contested using dacing election symbol on the ballot papers.
- ↑ Contested using dacing election symbol on the ballot papers.
- ↑ Contested using dacing election symbol on the ballot papers.
- ↑ Contested using dacing election symbol on the ballot papers.
Template:Malaysian general election, 1995 (Kuala Lumpur)
- ↑ Contested using dacing election symbol on the ballot papers.
- ↑ Contested using dacing election symbol on the ballot papers.
- ↑ Contested using dacing election symbol on the ballot papers.
Template:Malaysian general election, 1995 (Labuan)
- ↑ Contested using dacing election symbol on the ballot papers.
- ↑ Contested using dacing election symbol on the ballot papers.
|
State Assemblies
References
- ↑ Dieter Nohlen, Florian Grotz & Christof Hartmann (2001) Elections in Asia: A data handbook, Volume II, p157 ISBN 0-19-924959-8