Mahoning County, Ohio
| Mahoning County, Ohio | ||
|---|---|---|
 Jones Hall at Youngstown State University | ||
| ||
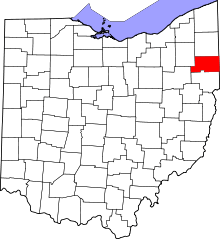 Location in the U.S. state of Ohio | ||
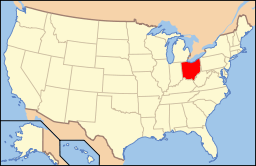 Ohio's location in the U.S. | ||
| Founded | March 1, 1846[1] | |
| Named for | A Native American word for salt lick | |
| Seat | Youngstown | |
| Largest city | Youngstown | |
| Area | ||
| • Total | 425 sq mi (1,101 km2) | |
| • Land | 412 sq mi (1,067 km2) | |
| • Water | 14 sq mi (36 km2), 3.2% | |
| Population | ||
| • (2010) | 238,823 | |
| • Density | 580/sq mi (224/km²) | |
| Congressional districts | 6th, 13th | |
| Time zone | Eastern: UTC-5/-4 | |
| Website |
www | |
.svg.png)
Mahoning County is a county located in the U.S. state of Ohio. As of the 2010 census, the population was 238,823.[2] Its county seat is Youngstown.[3] The county is named for an Indian word meaning "salt lick".[4] Mahoning County was formed on March 1, 1846; the 83rd county in Ohio. Until 1846, the area that is now Mahoning County was part of Trumbull and Columbiana counties, when the counties in the area were redefined and Mahoning County emerged as a new county.[5]
Mahoning County is part of the Youngstown-Warren-Boardman, OH-PA Metropolitan Statistical Area.
Geography
According to the U.S. Census Bureau, the county has a total area of 425 square miles (1,100 km2), of which 412 square miles (1,070 km2) is land and 14 square miles (36 km2) (3.2%) is water.[6]
Adjacent counties
- Trumbull County (north)
- Mercer County, Pennsylvania (northeast)
- Lawrence County, Pennsylvania (east)
- Columbiana County (south)
- Stark County (southwest)
- Portage County (northwest)
Major Highways
Demographics
| Historical population | |||
|---|---|---|---|
| Census | Pop. | %± | |
| 1850 | 23,735 | — | |
| 1860 | 25,894 | 9.1% | |
| 1870 | 31,001 | 19.7% | |
| 1880 | 42,871 | 38.3% | |
| 1890 | 55,979 | 30.6% | |
| 1900 | 70,134 | 25.3% | |
| 1910 | 116,151 | 65.6% | |
| 1920 | 186,310 | 60.4% | |
| 1930 | 236,142 | 26.7% | |
| 1940 | 240,251 | 1.7% | |
| 1950 | 257,629 | 7.2% | |
| 1960 | 300,480 | 16.6% | |
| 1970 | 303,424 | 1.0% | |
| 1980 | 289,487 | −4.6% | |
| 1990 | 264,806 | −8.5% | |
| 2000 | 257,555 | −2.7% | |
| 2010 | 238,823 | −7.3% | |
| Est. 2015 | 231,900 | [7] | −2.9% |
| U.S. Decennial Census[8] 1790-1960[9] 1900-1990[10] 1990-2000[11] 2010-2013[2] | |||

2000 census
As of the census[12] of 2000, there were 257,555 people, 102,587 households, and 68,835 families residing in the county. The population density was 620 people per square mile (239/km²). There were 111,762 housing units at an average density of 269 per square mile (104/km²). The racial makeup of the county was 81.04% White, 15.87% Black or African American, 0.17% Native American, 0.47% Asian, 0.02% Pacific Islander, 1.03% from other races, and 1.38% from two or more races. 2.97% of the population were Hispanic or Latino of any race.
93.1% spoke English, 2.6% Spanish, 1.0% Italian, and 0.5% Greek as their first language.[13]
There were 102,587 households out of which 28.40% had children under the age of 18 living with them, 49.00% were married couples living together, 14.10% had a female householder with no husband present, and 32.90% were non-families. 29.10% of all households were made up of individuals and 13.10% had someone living alone who was 65 years of age or older. The average household size was 2.44 and the average family size was 3.02.
In the county, the population was spread out with 23.70% under the age of 18, 8.40% from 18 to 24, 26.40% from 25 to 44, 23.70% from 45 to 64, and 17.80% who were 65 years of age or older. The median age was 40 years. For every 100 females there were 91.40 males. For every 100 females age 18 and over, there were 88.00 males.
The median income for a household in the county was $35,248, and the median income for a family was $44,185. Males had a median income of $36,313 versus $23,272 for females. The per capita income for the county was $18,818. About 9.60% of families and 12.50% of the population were below the poverty line, including 19.10% of those under age 18 and 8.70% of those age 65 or over.
2010 census
As of the 2010 United States Census, there were 238,823 people, 98,712 households, and 62,676 families residing in the county.[14] The population density was 580.2 inhabitants per square mile (224.0/km2). There were 111,833 housing units at an average density of 271.7 per square mile (104.9/km2).[15] The racial makeup of the county was 79.9% white, 15.7% black or African American, 0.7% Asian, 0.2% American Indian, 1.4% from other races, and 2.1% from two or more races. Those of Hispanic or Latino origin made up 4.7% of the population.[14] In terms of ancestry, 21.4% were German, 18.4% were Italian, 16.6% were Irish, 8.9% were English, and 4.2% were American.[16]
Of the 98,712 households, 27.9% had children under the age of 18 living with them, 43.7% were married couples living together, 15.0% had a female householder with no husband present, 36.5% were non-families, and 31.8% of all households were made up of individuals. The average household size was 2.34 and the average family size was 2.94. The median age was 42.9 years.[14]
The median income for a household in the county was $40,123 and the median income for a family was $52,489. Males had a median income of $44,516 versus $31,969 for females. The per capita income for the county was $22,824. About 12.6% of families and 16.6% of the population were below the poverty line, including 25.9% of those under age 18 and 10.0% of those age 65 or over.[17]
Politics
| Year | Republican | Democrat |
|---|---|---|
| 2016 | 46.37% 52,808 | 49.34% 56,188 |
| 2012 | 35.07% 42,641 | 63.38% 77,059 |
| 2008 | 35.50% 45,319 | 62.02% 79,173 |
| 2004 | 36.69% 48,761 | 62.60% 83,194 |
| 2000 | 35.45% 40,460 | 60.65% 69,212 |
Communities
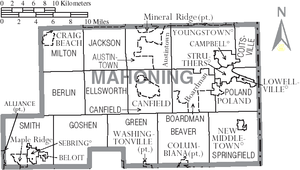
Cities
- Campbell
- Canfield
- Columbiana
- Salem
- Struthers
- Youngstown (county seat)
Villages
Townships
Census-designated places
Unincorporated communities
- Berlin Center
- Blanco
- Calla
- Coitsville Center
- East Lewistown
- Ellsworth
- Fredericksburg
- Garfield
- Greenford
- Hickory Corners
- Knaufville
- Lake Milton
- Locust Grove
- New Albany
- New Buffalo
- New Springfield
- North Benton
- North Jackson
- North Lima
- Ohltown
- Patmos
- Petersburg
- Poland Center
- Rosemont
- Snodes
- West Austintown
- Woodworth
See also
References
- ↑ "Ohio County Profiles: Mahoning County" (PDF). Ohio Department of Development. Retrieved 2007-04-28.
- 1 2 "State & County QuickFacts". United States Census Bureau. Retrieved February 9, 2015.
- ↑ "Find a County". National Association of Counties. Retrieved 2011-06-07.
- ↑ "Mahoning County data". Ohio State University Extension Data Center. Archived from the original on 2008-01-12. Retrieved 2007-04-28.
- ↑ History of Mahoning County, Official county website.
- ↑ "2010 Census Gazetteer Files". United States Census Bureau. August 22, 2012. Retrieved February 9, 2015.
- ↑ "County Totals Dataset: Population, Population Change and Estimated Components of Population Change: April 1, 2010 to July 1, 2015". Retrieved July 2, 2016.
- ↑ "U.S. Decennial Census". United States Census Bureau. Retrieved February 9, 2015.
- ↑ "Historical Census Browser". University of Virginia Library. Retrieved February 9, 2015.
- ↑ Forstall, Richard L., ed. (March 27, 1995). "Population of Counties by Decennial Census: 1900 to 1990". United States Census Bureau. Retrieved February 9, 2015.
- ↑ "Census 2000 PHC-T-4. Ranking Tables for Counties: 1990 and 2000" (PDF). United States Census Bureau. April 2, 2001. Retrieved February 9, 2015.
- ↑ "American FactFinder". United States Census Bureau. Retrieved 2008-01-31.
- ↑ http://www.mla.org/cgi-shl/docstudio/docs.pl?map_data_results
- 1 2 3 "DP-1 Profile of General Population and Housing Characteristics: 2010 Demographic Profile Data". United States Census Bureau. Retrieved 2015-12-27.
- ↑ "Population, Housing Units, Area, and Density: 2010 - County". United States Census Bureau. Retrieved 2015-12-27.
- ↑ "DP02 SELECTED SOCIAL CHARACTERISTICS IN THE UNITED STATES – 2006-2010 American Community Survey 5-Year Estimates". United States Census Bureau. Retrieved 2015-12-27.
- ↑ "DP03 SELECTED ECONOMIC CHARACTERISTICS – 2006-2010 American Community Survey 5-Year Estimates". United States Census Bureau. Retrieved 2015-12-27.
- ↑ "Dave Leip's Atlas of U.S. Presidential Elections". Retrieved 2016-11-18.
External links
| Wikimedia Commons has media related to Mahoning County, Ohio. |
 |
Portage County | Trumbull County | Mercer County, Pennsylvania | |
| |
Lawrence County, Pennsylvania | |||
| ||||
| | ||||
| Stark County | Columbiana County |
Municipalities and communities of Mahoning County, Ohio, United States | ||
|---|---|---|
| Cities | | |
| Villages | ||
| Townships | ||
| CDPs | ||
| Unincorporated communities |
| |
| Footnotes | ‡This populated place also has portions in an adjacent county or counties | |
Coordinates: 41°01′N 80°46′W / 41.02°N 80.77°W