Magnolia, Ohio
| Magnolia, Ohio | |
|---|---|
| Village | |
|
The Magnolia Flouring Mill was established by the village's founder. | |
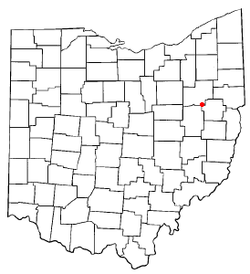 Location of Magnolia, Ohio | |
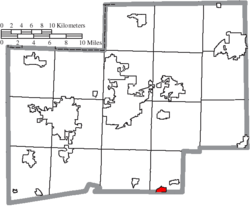 Location of Magnolia in Stark County | |
| Coordinates: 40°39′9″N 81°17′46″W / 40.65250°N 81.29611°WCoordinates: 40°39′9″N 81°17′46″W / 40.65250°N 81.29611°W | |
| Country | United States |
| State | Ohio |
| Counties | Stark, Carroll |
| Area[1] | |
| • Total | 0.87 sq mi (2.25 km2) |
| • Land | 0.87 sq mi (2.25 km2) |
| • Water | 0 sq mi (0 km2) |
| Elevation[2] | 958 ft (292 m) |
| Population (2010)[3] | |
| • Total | 978 |
| • Estimate (2012[4]) | 976 |
| • Density | 1,124.1/sq mi (434.0/km2) |
| Time zone | Eastern (EST) (UTC-5) |
| • Summer (DST) | EDT (UTC-4) |
| ZIP code | 44643 |
| Area code(s) | 330 |
| FIPS code | 39-46844[5] |
| GNIS feature ID | 1070833[2] |
| Website |
www |
.JPG)
Magnolia is a village in Carroll and Stark counties in the U.S. state of Ohio. The population was 978 at the 2010 census. It is part of the Canton–Massillon Metropolitan Statistical Area.
History

In 1834 Richard Elson and John W. Smith laid out the village of Magnolia in Sandy Township. In 1836, Isaac Miller platted the village of Downingville in Rose Township. The towns merged and became Magnolia on February 1, 1846.[6] The village took its name from the local Magnolia Mills.[7]
The Muskingum Watershed Conservancy District constructed the Magnolia Levee[8] to protect the town from Bolivar Dam.
Geography
Magnolia is located at 40°39′9″N 81°17′46″W / 40.65250°N 81.29611°W (40.652546, -81.296119),[9] along Sandy Creek.[10]
According to the United States Census Bureau, the village has a total area of 0.87 square miles (2.25 km2), all land.[1]
Magnolia lies at the intersection of State Routes 183 and 542.
Demographics
2010 census
As of the census[3] of 2010, there were 978 people, 384 households, and 266 families residing in the village. The population density was 1,124.1 inhabitants per square mile (434.0/km2). There were 418 housing units at an average density of 480.5 per square mile (185.5/km2). The racial makeup of the village was 97.8% White, 0.2% African American, 0.3% Native American, 0.3% Asian, 0.1% from other races, and 1.3% from two or more races. Hispanic or Latino of any race were 1.2% of the population.
There were 384 households of which 34.1% had children under the age of 18 living with them, 55.5% were married couples living together, 8.3% had a female householder with no husband present, 5.5% had a male householder with no wife present, and 30.7% were non-families. 26.6% of all households were made up of individuals and 12% had someone living alone who was 65 years of age or older. The average household size was 2.55 and the average family size was 3.08.
The median age in the village was 38.9 years. 26% of residents were under the age of 18; 8.4% were between the ages of 18 and 24; 24.4% were from 25 to 44; 26.4% were from 45 to 64; and 14.9% were 65 years of age or older. The gender makeup of the village was 50.5% male and 49.5% female.
2000 census
As of the census[5] of 2000, there were 931 people, 369 households, and 263 families residing in the village. The population density was 1,046.5 people per square mile (403.9/km²). There were 398 housing units at an average density of 447.4 per square mile (172.7/km²). The racial makeup of the village was 99.03% White, 0.54% African American, 0.21% Native American, and 0.21% from two or more races. Hispanic or Latino of any race were 1.72% of the population.
There were 369 households out of which 30.9% had children under the age of 18 living with them, 59.6% were married couples living together, 8.1% had a female householder with no husband present, and 28.7% were non-families. 24.9% of all households were made up of individuals and 11.9% had someone living alone who was 65 years of age or older. The average household size was 2.52 and the average family size was 3.00.
In the village the population was spread out with 25.8% under the age of 18, 4.8% from 18 to 24, 30.9% from 25 to 44, 22.2% from 45 to 64, and 16.2% who were 65 years of age or older. The median age was 39 years. For every 100 females there were 100.6 males. For every 100 females age 18 and over, there were 96.3 males.
The median income for a household in the village was $39,688, and the median income for a family was $45,156. Males had a median income of $32,292 versus $20,909 for females. The per capita income for the village was $19,711. About 4.3% of families and 4.3% of the population were below the poverty line, including 3.3% of those under age 18 and 3.9% of those age 65 or over.
Education
| Historical population | |||
|---|---|---|---|
| Census | Pop. | %± | |
| 1880 | 121 | — | |
| 1900 | 431 | — | |
| 1910 | 556 | 29.0% | |
| 1920 | 605 | 8.8% | |
| 1930 | 685 | 13.2% | |
| 1940 | 819 | 19.6% | |
| 1950 | 901 | 10.0% | |
| 1960 | 935 | 3.8% | |
| 1970 | 1,064 | 13.8% | |
| 1980 | 986 | −7.3% | |
| 1990 | 937 | −5.0% | |
| 2000 | 931 | −0.6% | |
| 2010 | 978 | 5.0% | |
| Est. 2015 | 973 | [11] | −0.5% |
| [12] | |||
Students attend the Sandy Valley Local School District.[13]
Notable people
- Iorwith Wilbur Abel - founder and president of the United Steelworkers of America and vice-president of the AFL-CIO
- Jeff Boals - assistant head coach of The Ohio State University Buckeyes men's basketball team
- Vince Costello - former American football linebacker
- John Dagenhard - Major League Baseball pitcher
- Thomas Dillon - Serial killer
- Joe R. Hastings - United States Army soldier, recipient of the Medal of Honor for his actions in World War II.
- John J. Whitacre - US Congressman
References
| Wikivoyage has a travel guide for Magnolia (Ohio). |
- 1 2 "US Gazetteer files 2010". United States Census Bureau. Retrieved 2013-01-06.
- 1 2 "US Board on Geographic Names". United States Geological Survey. 2007-10-25. Retrieved 2008-01-31.
- 1 2 "American FactFinder". United States Census Bureau. Retrieved 2013-01-06.
- ↑ "Population Estimates". United States Census Bureau. Retrieved 2013-06-17.
- 1 2 "American FactFinder". United States Census Bureau. Retrieved 2008-01-31.
- ↑ Rose Township History page 6 and Village Of Magnolia website
- ↑ Overman, William Daniel (1958). Ohio Town Names. Akron, OH: Atlantic Press. p. 81.
- ↑ US Army Corps of Engineers Magnolia Levee Page
- ↑ "US Gazetteer files: 2010, 2000, and 1990". United States Census Bureau. 2011-02-12. Retrieved 2011-04-23.
- ↑ DeLorme (1991). Ohio Atlas & Gazetteer. Yarmouth, Maine: DeLorme. ISBN 0-89933-233-1.
- ↑ "Annual Estimates of the Resident Population for Incorporated Places: April 1, 2010 to July 1, 2015". Retrieved July 2, 2016.
- ↑ census data: 1900 : Hunt, William C. (1901). Population of the United States by states and territories, counties, and minor Civil Divisions, as returned at the Twelfth Census: 1900. United States Census Printing Office. p. 306. , 1910, 1920, 1930 : 1930 page 40 , 1940, 1950 : 1950 page 14,21 , 1960 : 1960 page 16 , 1970 : 1970 page=124,135 , 1990: 1990 , 2000 : 2000
- ↑ PUC Ohio map of School Districts Carroll County Archived February 20, 2009, at the Wayback Machine. and PUC Ohio map of School Districts Stark County
Municipalities and communities of Carroll County, Ohio, United States | ||
|---|---|---|
| Villages | 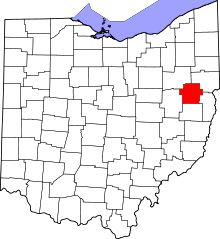 | |
| Townships | ||
| CDP | ||
| Unincorporated communities | ||
| Footnotes | ‡This populated place also has portions in an adjacent county or counties | |
Municipalities and communities of Stark County, Ohio, United States | ||
|---|---|---|
| Cities | 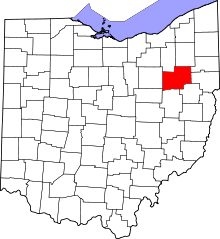 | |
| Villages | ||
| Townships | ||
| CDPs | ||
| Unincorporated communities | ||
| Footnotes | ‡This populated place also has portions in an adjacent county or counties | |