Luminosity function

The luminosity function or luminous efficiency function describes the average spectral sensitivity of human visual perception of brightness. It is based on subjective judgements of which of a pair of different-colored lights is brighter, to describe relative sensitivity to light of different wavelengths. It should not be considered perfectly accurate in every case, but it is a very good representation of visual sensitivity of the human eye and it is valuable as a baseline for experimental purposes.
The CIE luminosity function y(λ) or V(λ) is a standard function established by the Commission Internationale de l'Éclairage (CIE) and may be used to convert radiant energy into luminous (i.e., visible) energy. It also forms the central color matching function in the CIE 1931 color space.
Details
There are two luminosity functions in common use. For everyday light levels, the photopic luminosity function best approximates the response of the human eye. For low light levels, the response of the human eye changes, and the scotopic curve applies. The photopic curve is the CIE standard curve used in the CIE 1931 color space.
The luminous flux (or visible power) in a light source is defined by the photopic luminosity function. The following equation calculates the total luminous flux in a source of light:

where
- Φv is the luminous flux, in lumens;
- Φe,λ is the spectral radiant flux, in watts per nanometre;
- y(λ), also known as V(λ), is the luminosity function, dimensionless;
- λ is the wavelength, in nanometres.
Formally, the integral is the inner product of the luminosity function with the light spectrum.[1] In practice, the integral is replaced by a sum over discrete wavelengths for which tabulated values of the luminosity function are available. The CIE distributes standard tables with luminosity function values at 5 nm intervals from 380 nm to 780 nm.[cie 1]
The standard luminosity function is normalized to a peak value of unity at 555 nm (see luminous coefficient). The value of the constant in front of the integral is usually rounded off to 683 lm/W. The small excess fractional value comes from the slight mismatch between the definition of the lumen and the peak of the luminosity function. The lumen is defined to be unity for a radiant energy of 1/683 W at a frequency of 540 THz, which corresponds to a standard air wavelength of 555.016 nm rather than 555 nm, which is the peak of the luminosity curve. The value of y(λ) is 0.999,997 at 555.016 nm, so that a value of 683/0.999,997 = 683.002 is the multiplicative constant.[2]
The number 683 is connected to the modern (1979) definition of the candela, the unit of luminous intensity.[cie 2] This arbitrary number made the new definition give numbers equivalent to those from the old definition of the candela.
Improvements to the standard
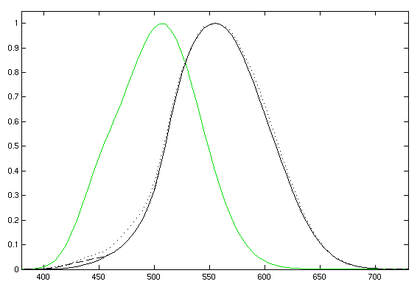
The CIE 1924 photopic V(λ) luminosity function,[cie 3] which is included in the CIE 1931 color-matching functions as the y(λ) function, has long been acknowledged to underestimate the contribution of the blue end of the spectrum to perceived luminance. There have been numerous attempts to improve the standard function, to make it more representative of human vision. Judd in 1951,[3] improved by Vos in 1978,[4] resulted in a function known as CIE VM(λ).[5] More recently, Sharpe, Stockman, Jagla & Jägle (2005) developed a function consistent with the Stockman & Sharpe cone fundamentals;[6] their curves are plotted in the figure above.
Scotopic luminosity
For very low levels of intensity (scotopic vision), the sensitivity of the eye is mediated by rods, not cones, and shifts toward the violet, peaking around 507 nm for young eyes; the sensitivity is equivalent to 1,699 lm/W[7] or 1,700 lm/W[8] at this peak.
The standard scotopic luminosity function or V' (λ) was adopted by the CIE in 1951, based on measurements by Wald (1945) and by Crawford (1949).[9]
Color blindness

Color blindness changes the sensitivity of the eye as a function of wavelength. For people with protanopia, the peak of the eye's response is shifted toward the short-wave part of the spectrum (approximately 540 nm), while for people suffering deuteranopia, there is a slight shift in the peak of the spectrum, to about 560 nm.[10] People with protanopia have essentially no sensitivity to light of wavelengths more than 670 nm.
Most mammals other than primates have the same luminosity function as people with protanopia. This makes it possible to study the nocturnal life of animals by illuminating the scene with long-wavelength red light that they can't see.[11]
For older people with normal color vision, the crystalline lens may become slightly yellow due to cataracts, which moves the maximum of sensitivity to the red part of the spectrum and narrows the range of perceived wavelengths.
See also
- A-weighting, the sound equivalent
- Apparent brightness
- Color vision
- Quantum efficiency, the image sensor equivalent
References
- ↑ Charles A. Poynton (2003). Digital Video and HDTV: Algorithms and Interfaces. Morgan Kaufmann. ISBN 1-55860-792-7.
- ↑ Wyszecki, Günter & Stiles, W.S. (2000). Color Science - Concepts and Methods, Quantitative Data and Formulae (2nd ed.). Wiley-Interscience. ISBN 0-471-39918-3.
- ↑ Judd, Deane B. & Wyszecki, Günter (1975). Color in Business, Science and Industry (3rd ed.). John Wiley. ISBN 0-471-45212-2.
- ↑ Vos, J. J. (1978). "Colorimetric and photometric properties of a 2° fundamental observer". Color Research and Application. 3 (3): 125–128. doi:10.1002/col.5080030309.
- ↑ Stiles, W. S.; Burch, J. M. (1955). "Interim report to the Commission Internationale de l'Eclairage Zurich 1955, on the National Physical Laboratory's investigation of colour-matching". Optica Acta. 2 (4): 168–181. Bibcode:1955AcOpt...2..168S. doi:10.1080/713821039.
- ↑ Sharpe, L. T.; Stockman, A.; Jagla, W.; Jägle, H. (2005). "A luminous efficiency function, V*(λ), for daylight adaptation" (PDF). Journal of Vision. 5 (11): 948–968. doi:10.1167/5.11.3. Archived from the original (PDF) on Apr 26, 2012.
- ↑ Kohei Narisada; Duco Schreuder (2004). Light Pollution Handbook. Springer. ISBN 1-4020-2665-X.
- ↑ Casimer DeCusatis (1998). Handbook of Applied Photometry. Springer. ISBN 1-56396-416-3.
- ↑
- 1 2 Judd, Deane B. (1979). Contributions to Color Science. Washington D.C. 20234: NBS. p. 316.
- ↑ I. S. McLennan & J. Taylor-Jeffs (2004). "The use of sodium lamps to brightly illuminate mouse houses during their dark phases" (PDF). Laboratory Animals. 38: 384–392. doi:10.1258/0023677041958927. PMID 15479553.
CIE documents
- ↑ "CIE Selected Colorimetric Tables".
- ↑ 16th Conférence générale des poids et mesures Resolution 3, CR, 100 (1979), and Metrologia, 16, 56 (1980).
- ↑ CIE (1926). Commission internationale de l'Eclairage proceedings, 1924. Cambridge University Press, Cambridge.
Curve data
- ↑ "CIE Scotopic luminosity curve (1951)". Archived from the original on 2008-12-28.
- ↑ "CIE (1931) 2-deg color matching functions". Archived from the original on 2008-12-28.
- ↑ "Judd–Vos modified CIE 2-deg photopic luminosity curve (1978)". Archived from the original on 2008-12-28.
- ↑ "Sharpe, Stockman, Jagla & Jägle (2005) 2-deg V*(l) luminous efficiency function". Archived from the original on 2007-09-27.