London local elections, 2014
| | |||||||||||||||||||||||||||||||||||||||||||||||||||
| |||||||||||||||||||||||||||||||||||||||||||||||||||
| |||||||||||||||||||||||||||||||||||||||||||||||||||
|
| |||||||||||||||||||||||||||||||||||||||||||||||||||
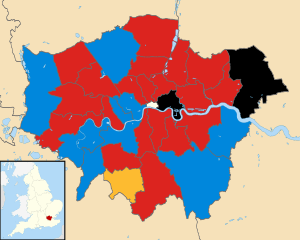
| London borough councils by political control following election. | |||||||||||||||||||||||||||||||||||||||||||||||||||

There were local government elections in London on Thursday 22 May 2014. All councillor seats on the 32 London borough councils were up for election. The electorates of Hackney, Lewisham, Newham and Tower Hamlets also elected their executive mayors, who operate in place of council leaders in those boroughs. Ward changes took place in Hackney, Kensington and Chelsea, and Tower Hamlets, which reduced the total number of councillors by 10 to 1,851. Both the mayoral and councillor elections are four-yearly.
The results saw the Labour Party increase their number of councillors from 875 in 2010 to 1,060 in 2014. The Conservative Party went from 717 councillors in 2010 to 612 in 2014. The Liberal Democrats went from 246 councillors in 2010 to 116 in 2014. Havering Residents Association and Tower Hamlets First were the fourth and fifth largest parties. Labour Party councillors gained control of four councils, losing Tower Hamlets to no overall control, Conservatives lost control of three councils but gained one from Liberal Democrats, who retained control of one council. The Labour majority of London councils was increased to 20 of 32. Following the elections, two of the thirty two London borough councils were in no overall control, a decrease of one. All four mayoral elections returned the incumbent mayors. Turnout fell as the elections of four years before were in a general election year whereas this round coincided with the 2014 European elections which have a lower turnout.
Councils results
Councils that are Labour are in red, Conservative in blue, Liberal Democrat in yellow and two in no overall control party-politically are in black in the table and in grey on map to the right.[1]
Others and notes
- ↑ Harrow: Independent - 2
- ↑ Havering: Havering Residents Association - 19; Independent Residents - 5
- ↑ Merton: Merton Park Ward Independent Residents - 3
- ↑ Tower Hamlets: Tower Hamlets First - 18
Results
-->
| Political Party |
Candidates |
Number of Votes |
Elected |
Net Change in seats |
% of Seats |
% of Votes |
Change in % of vote | |||
|---|---|---|---|---|---|---|---|---|---|---|
| Labour | 1,851 | 2,626,540 | 1,060 | +185 | 57.7 | 37.4 | ||||
| Conservative | 1,812 | 1,826,714 | 612 | -105 | 33.06 | 26.1 | ||||
| Liberal Democrat | 1,322 | 635,719 | 116 | -130 | 6.2 | 10.2 | ||||
| Residents | 45 | 74,788 | 27 | +8 | 2.43 | - | ||||
| Tower Hamlets First | 44 | 62,368 | 18 | +18 | 0.9 | - | ||||
| UKIP | 469 | 303,772 | 12 | +12 | 0.6 | - | ||||
| Green | 849 | 424,586 | 4 | +2 | 0.2 | - | ||||
| Independent | 110 | 44,117 | 2 | +1 | 0.1 | - | ||||
| TUSC | 198 | 30,285 | 0 | 0 | 0 | - | ||||
| Ind. Labour Group | 47 | 16,715 | 0 | 0 | 0 | - | ||||
| BNP | 51 | 14,495 | 0 | 0 | 0 | - | ||||
| Total | 6,951 | 6,103,629 | 1,851 | - | - | - | Turnout | 39% | - | |
Overall councillor numbers
| London local elections 2014
Councillor statistics | |||
|---|---|---|---|
| Party | Seats | Net Gain/Loss | |
| Labour | 1,060 | +185 | |
| Conservative | 612 | -105 | |
| Liberal Democrat | 116 | -130 | |
| Havering Residents Association | 19 | +7 | |
| Tower Hamlets First | 18 | +18 | |
| UKIP | 12 | +12 | |
| Independent Residents | 5 | +1 | |
| Green | 4 | +2 | |
| Merton Park Ward Independent Residents | 3 | 0 | |
| Independent | 2 | +1 | |
Three seats in Barnet (Colindale) and three in Tower Hamlets (Blackwall and Cubitt Town) were vacancies until elections held on 26 June 2014 in Colindale[3] and on 3 July 2014 in Blackwall and Cubitt Town.[4]
Opinion polling
| Date(s) conducted | Polling organisation/client | Sample size | Lab | Con | Lib Dem | UKIP | Others | Average estimated lead of 'winning party'| |
|---|---|---|---|---|---|---|---|---|
| 6–8 May | YouGov/London Evening Standard | 1,422 | 40% | 33% | 11% | 10% | 6% | 7% over Con |
| 28–29 April | Survation | 1,001 | 42% | 26% | 14% | 11% | 7% | 16% over Con |
Mayoral results
In four London boroughs the executive function of the council is a directly elected mayor. The mayoral elections take place at the same time as councillor elections in those boroughs.
| Mayoralty | 2010 | 2014 | ||
|---|---|---|---|---|
| Hackney | Jules Pipe (Labour) | Jules Pipe (Labour) | ||
| Lewisham | Sir Steve Bullock (Labour) | Sir Steve Bullock (Labour) | ||
| Newham | Robin Wales (Labour) | Robin Wales (Labour) | ||
| Tower Hamlets | Lutfur Rahman (Independent) | Lutfur Rahman (Tower Hamlets First) | ||
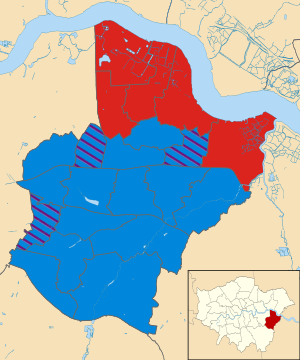
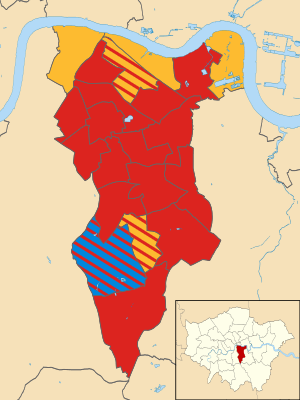
Borough result maps
-
Barking and Dagenham 2014 results map
-

Barnet 2014 results map
-
Bexley 2014 results map
-

Brent 2014 results map
-

Bromley 2014 results map
-

Camden 2014 results map
-

Croydon 2014 results map
-

Ealing 2014 results map
-

Enfield 2014 results map
-

Greenwich 2014 results map
-

Hackney 2014 results map
-

Hammersmith and Fulham 2014 results map
-

Haringey 2014 results map
-

Harrow 2014 results map
-

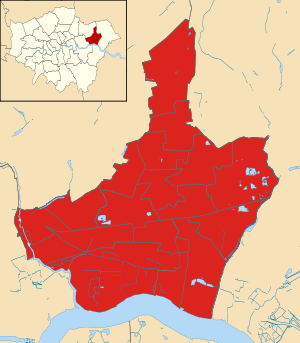
Havering 2014 results map
-
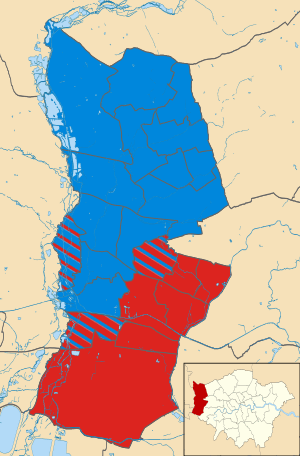
Hillingdon 2014 results map
-

Hounslow 2014 results map
-

Islington 2014 results map
-

Kensington and Chelsea 2014 results map
-

Kingston upon Thames 2014 results map
-

Lambeth 2014 results map
-

Lewisham 2014 results map
-

Merton 2014 results map
-
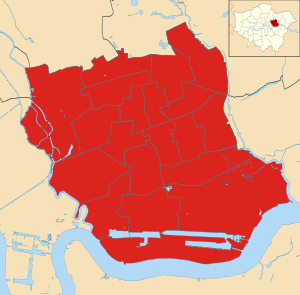
Newham 2014 results map
-

Redbridge 2014 results map
-

Richmond upon Thames 2014 results map
-
Southwark 2014 results map
-

Sutton 2014 results map
-

Tower Hamlets 2014 results map
-

Waltham Forest 2014 results map
-

Wandsworth 2014 results map
-

Westminster 2014 results map
References
- ↑ "2014 borough elections results". London councils. Retrieved 2014-05-14.
- ↑ https://londondatastore-upload.s3.amazonaws.com/London-Borough-Council-Elections-2014.pdf
- ↑ http://www.barnet.gov.uk/news/article/515/date_announced_for_new_colindale_election
- ↑ http://www.eastlondonadvertiser.co.uk/news/labour_and_tories_take_council_seats_in_blackwall_and_cubitt_town_by_election_1_3669435
| General elections |
|
|---|---|
| Local elections |
|
| European elections | |
| Referendums | |
| |