List of motor vehicle deaths in U.S. by year


The table below is a list of motor vehicle deaths in the United States by year. On average in 2012, 92 people were killed on the roadways of the U.S. each day, in 30,800 fatal crashes during the year.[1]
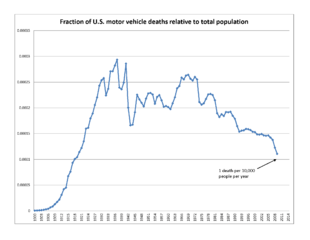
The number of deaths – and deaths relative to the total population – have declined over the last two decades. From 1979 to 2005, the number of deaths per year decreased 14.97% while the number of deaths per capita decreased by 35.46%. In 2010, there were an estimated 5,419,000 crashes (30,296 fatal crashes), killing 32,999 and injuring 2,239,000.[2] The 32,479 traffic fatalities in 2011 were the lowest in 62 years (1949). Records indicate that there has been a total of 3,613,732 motor vehicle fatalities in the United States from 1899 to 2013.
Motor vehicle deaths in U.S. by year
| Year | Deaths | Vehicle miles travelled (billions) | Fatalities per 100 million VMT | Population | Fatalities per 100,000 population | Change (in percent) |
|---|---|---|---|---|---|---|
| 1899 | 26[3] | |||||
| 1900 | 36 | 76,094,000 | 0.047 | NA | ||
| 1901 | 54 | 77,584,000 | 0.070 | | ||
| 1902 | 79 | 79,163,000 | 0.100 | | ||
| 1903 | 117 | 80,632,000 | 0.145 | | ||
| 1904 | 172 | 82,166,000 | 0.209 | | ||
| 1905 | 252 | 83,822,000 | 0.301 | | ||
| 1906 | 338 | 85,450,000 | 0.396 | | ||
| 1907 | 581 | 87,008,000 | 0.668 | | ||
| 1908 | 751 | 88,710,000 | 0.847 | | ||
| 1909 | 1,174 | 90,490,000 | 1.297 | | ||
| 1910 | 1,599 | 92,407,000 | 1.730 | | ||
| 1911 | 2,043 | 93,863,000 | 2.177 | | ||
| 1912 | 2,968 | 95,335,000 | 3.113 | | ||
| 1913 | 4,079 | 97,225,000 | 4.195 | | ||
| 1914 | 4,468 | 99,111,000 | 4.508 | | ||
| 1915 | 6,779 | 100,546,000 | 6.742 | | ||
| 1916 | 7,766 | 101,961,000 | 7.617 | | ||
| 1917 | 9,630 | 103,268,000 | 9.325 | | ||
| 1918 | 10,390 | 103,208,000 | 10.067 | | ||
| 1919 | 10,896 | 104,514,000 | 10.425 | | ||
| 1920 | 12,155 | 106,461,000 | 11.417 | | ||
| 1921 | 13,253 | 55.03 | 24.09 | 108,538,000 | 12.210 | |
| 1922 | 14,859 | 67.70 | 21.95 | 110,049,000 | 13.502 | |
| 1923 | 17,870 | 85.00 | 21.03 | 111,947,000 | 15.963 | |
| 1924 | 18,400 | 104.84 | 17.55 | 114,109,000 | 16.125 | |
| 1925 | 20,771 | 122.35 | 16.98 | 115,829,000 | 17.932 | |
| 1926 | 22,194 | 140.74 | 15.77 | 117,397,000 | 18.905 | |
| 1927 | 24,470 | 158.45 | 15.44 | 119,035,000 | 20.557 | |
| 1928 | 26,557 | 172.86 | 15.36 | 120,509,000 | 22.037 | |
| 1929 | 29,592 | 197.72 | 14.97 | 121,767,000 | 24.302 | |
| 1930 | 31,204 | 206.32 | 15.12 | 123,076,741 | 25.353 | |
| 1931 | 31,963 | 216.15 | 14.79 | 124,039,648 | 25.768 | |
| 1932 | 27,979 | 200.52 | 13.95 | 124,840,471 | 22.412 | |
| 1933 | 29,746 | 200.64 | 14.83 | 125,578,763 | 23.687 | |
| 1934 | 34,240 | 215.56 | 15.88 | 126,373,773 | 27.094 | |
| 1935 | 34,494 | 228.57 | 15.09 | 127,250,232 | 27.107 | |
| 1936 | 36,126 | 252.13 | 14.33 | 128,053,180 | 28.212 | |
| 1937 | 37,819 | 270.11 | 14.00 | 128,824,829 | 29.357 | |
| 1938 | 31,083 | 271.18 | 11.46 | 129,824,939 | 23.942 | |
| 1939 | 30,895 | 285.40 | 10.83 | 130,879,718 | 23.606 | |
| 1940 | 32,914 | 302.19 | 10.89 | 132,122,446 | 24.912 | |
| 1941 | 38,142 | 333.61 | 11.43 | 133,402,471 | 28.592 | |
| 1942 | 27,007 | 268.22 | 10.07 | 134,859,553 | 20.026 | |
| 1943 | 22,727 | 208.19 | 10.92 | 136,739,353 | 16.621 | |
| 1944 | 23,165 | 212.71 | 10.89 | 138,397,345 | 16.738 | |
| 1945 | 26,785 | 250.17 | 10.71 | 139,928,165 | 19.142 | |
| 1946 | 31,874 | 340.88 | 9.35 | 141,388,566 | 22.544 | |
| 1947 | 31,193 | 370.89 | 8.41 | 144,126,071 | 21.643 | |
| 1948 | 30,775 | 397.96 | 7.73 | 146,631,302 | 20.988 | |
| 1949 | 30,246 | 424.46 | 7.13 | 149,188,130 | 20.274 | |
| 1950 | 33,186 | 458.25 | 7.24 | 152,271,417 | 21.794 | |
| 1951 | 35,309 | 491.09 | 7.19 | 154,877,889 | 22.798 | |
| 1952 | 36,088 | 513.58 | 7.03 | 157,552,740 | 22.905 | |
| 1953 | 36,190 | 544.43 | 6.65 | 160,184,192 | 22.593 | |
| 1954 | 33,890 | 561.96 | 6.03 | 163,025,854 | 20.788 | |
| 1955 | 36,688 | 605.65 | 6.06 | 165,931,202 | 22.110 | |
| 1956 | 37,965 | 627.84 | 6.05 | 168,903,031 | 22.477 | |
| 1957 | 36,932 | 647.00 | 5.71 | 171,984,130 | 21.474 | |
| 1958 | 35,331 | 664.65 | 5.32 | 174,881,904 | 20.203 | |
| 1959 | 36,223 | 700.48 | 5.17 | 177,829,628 | 20.369 | |
| 1960 | 36,399 | 718.76 | 5.06 | 180,671,158 | 20.147 | |
| 1961 | 36,285 | 737.42 | 4.92 | 183,691,481 | 19.753 | |
| 1962 | 38,980 | 766.73 | 5.08 | 186,537,737 | 20.897 | |
| 1963 | 41,723 | 805.25 | 5.18 | 189,241,798 | 22.047 | |
| 1964 | 45,645 | 846.30 | 5.39 | 191,888,791 | 23.787 | |
| 1965 | 47,089 | 887.81 | 5.30 | 194,302,963 | 24.235 | |
| 1966 | 50,894 | 925.90 | 5.50 | 196,560,338 | 25.892 | |
| 1967 | 50,724 | 964.01 | 5.26 | 198,712,056 | 25.526 | |
| 1968 | 52,725 | 1,015.87 | 5.19 | 200,706,052 | 26.270 | |
| 1969 | 53,543 | 1,061.79 | 5.04 | 202,676,946 | 26.418 | |
| 1970 | 52,627 | 1,109.72 | 4.74 | 205,052,174 | 25.665 | |
| 1971 | 52,542 | 1,178.81 | 4.46 | 207,660,677 | 25.302 | |
| 1972 | 54,589 | 1,259.79 | 4.33 | 209,896,021 | 26.008 | |
| 1973 | 54,052 | 1,313.11 | 4.12 | 211,908,788 | 25.507 | |
| 1974 | 45,196 | 1,280.54 | 3.53 | 213,853,928 | 21.134 | |
| 1975 | 44,525 | 1,327.66 | 3.35 | 215,973,199 | 20.616 | |
| 1976 | 45,523 | 1,402.38 | 3.25 | 218,035,164 | 20.879 | |
| 1977 | 47,878 | 1,467.03 | 3.26 | 220,239,425 | 21.739 | |
| 1978 | 50,331 | 1,544.70 | 3.26 | 222,584,545 | 22.612 | |
| 1979 | 51,093 | 1,529.13 | 3.34 | 225,055,487 | 22.702 | |
| 1980 | 51,091 | 1,527.30 | 3.35 | 227,224,681 | 22.485 | |
| 1981 | 49,301 | 1,552.80 | 3.18 | 229,465,714 | 21.485 | |
| 1982 | 43,945 | 1,595.01 | 2.76 | 231,664,458 | 18.969 | |
| 1983 | 42,589 | 1,652.79 | 2.58 | 233,791,994 | 18.217 | |
| 1984 | 44,257 | 1,720.27 | 2.57 | 235,824,902 | 18.767 | |
| 1985 | 43,825 | 1,774.18 | 2.47 | 237,923,795 | 18.420 | |
| 1986 | 46,087 | 1,834.87 | 2.51 | 240,132,887 | 19.192 | |
| 1987 | 46,390 | 1,921.20 | 2.42 | 242,288,918 | 19.147 | |
| 1988 | 47,087 | 2,025.96 | 2.32 | 244,498,982 | 19.259 | |
| 1989 | 45,582 | 2,096.46 | 2.17 | 246,819,230 | 18.468 | |
| 1990 | 44,599 | 2,144.36 | 2.08 | 249,464,396 | 17.878 | |
| 1991 | 41,508 | 2,172.05 | 1.91 | 252,153,092 | 16.461 | |
| 1992 | 39,250 | 2,247.15 | 1.75 | 255,029,699 | 15.390 | |
| 1993 | 40,150 | 2,296.38 | 1.75 | 257,782,608 | 15.575 | |
| 1994 | 40,716 | 2,358 | 1.73 | 260,327,021 | 15.6403 | |
| 1995 | 41,817 | 2,423 | 1.73 | 262,803,276 | 15.9119 | |
| 1996 | 42,065 | 2,486 | 1.69 | 265,228,572 | 15.8599 | |
| 1997 | 42,013 | 2,562 | 1.64 | 267,783,607 | 15.6892 | |
| 1998 | 41,501 | 2,632 | 1.58 | 270,248,003 | 15.3566 | |
| 1999 | 41,717 | 2,691 | 1.55 | 272,690,813 | 15.2983 | |
| 2000 | 41,945 | 2,747 | 1.53 | 282,216,952 | 14.8627 | |
| 2001[2] | 42,196 | 2,797 | 1.51 | 285,226,284 | 14.794 | |
| 2002 | 43,005 | 2,856 | 1.51 | 288,125,973 | 14.926 | |
| 2003 | 42,884 | 2,890 | 1.48 | 290,796,023 | 14.747 | |
| 2004 | 42,836 | 2,965 | 1.44 | 293,638,158 | 14.588 | |
| 2005 | 43,510 | 2,989 | 1.46 | 296,507,061 | 14.674 | |
| 2006 | 42,708 | 3,014 | 1.42 | 299,398,484 | 14.265 | |
| 2007 | 41,259 | 3,031 | 1.36 | 301,139,947 | 13.701 | |
| 2008 | 37,423 | 2,977 | 1.26 | 303,824,640 | 12.317 | |
| 2009 | 33,883 | 2,957 | 1.15 | 306,700,000 | 11.048 | |
| 2010[2] | 32,999 | 2,967 | 1.11 | 309,326,000 | 10.668 | |
| 2011[4] | 32,479 | 2,950 | 1.10 | 311,588,000 | 10.424 | |
| 2012[1] | 33,561 | 2,969 | 1.13 | 313,914,000 | 10.691 | |
| 2013 | 32,719 | 2,988 | 1.10 | 316,129,000 | 10.345 | |
| 2014 | 32,675 | 3,026 | 1.08 | 318,860,000 | 10.25 | |
| 2015 | 35,092 | 321,370,000 |
2010 detailed statistics and death
The following table summarizes the number of people killed and injured in fatal collisions by month in 2010. The table does not include injuries resulting from incidents in which no fatalities occurred.[5]
| Month | Fatalities | In-vehicle casualties (excluding uninjured bus occupants) | Non-vehicle casualties (including pedestrians) |
|---|---|---|---|
| 2010-01 | 2290 | 4785 | 427 |
| 2010-02 | 2016 | 4340 | 386 |
| 2010-03 | 2423 | 5087 | 407 |
| 2010-04 | 2777 | 5775 | 404 |
| 2010-05 | 2934 | 6066 | 418 |
| 2010-06 | 2795 | 5809 | 348 |
| 2010-07 | 3095 | 6763 | 456 |
| 2010-08 | 3083 | 6549 | 428 |
| 2010-09 | 3024 | 6309 | 511 |
| 2010-10 | 3056 | 6382 | 543 |
| 2010-11 | 2795 | 5842 | 573 |
| 2010-12 | 2597 | 5417 | 548 |
See also
- Car crashes
- List of countries by traffic-related death rate
- List of motor vehicle deaths in Thailand by year
- List of motor vehicle deaths in Japan by year
- Work-related road safety in the United States
- List of cyclist deaths in U.S. by year
References
- 1 2 'Fatality Analysis Reporting System' 2012, fars.NHTSA.dot.gov Retrieved July 3, 2014
- 1 2 3 'Fatality Analysis Reporting System' 2010, fars.NHTSA.dot.gov Retrieved July 3, 2014
- ↑ "U.S. Highway Deaths Decline 2.9%, Falling for Fifth Year". Bloomberg. December 8, 2011.
- ↑ 'Fatality Analysis Reporting System' 2011, fars.NHTSA.dot.gov Retrieved July 3, 2014
- ↑ "FARS 2010". National Highway Transportation Safety Administration.
External links
- Fatality Analysis Reporting System (FARS) at NHTSA
- "Motor Vehicle Traffic Fatalities & Fatality Rate: 1899 - 2003]" (PDF). Safe Roads. 2004.
- Badger, Emily; Ingraham, Christopher (Oct 1, 2015). "The hidden inequality of who dies in car crashes". The Washington Post.