List of countries by greenhouse gas emissions per capita
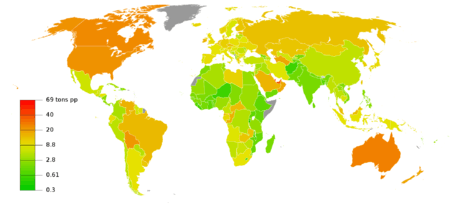


This is a list of countries ranked by greenhouse-gas emissions per capita in 2000. It is based on data for carbon dioxide, methane, nitrous oxide, perfluorocarbon, hydrofluorocarbon and sulfur hexafluoride emissions compiled by the World Resources Institute[1] (WRI) from a variety of sources, including CDIAC and the US Environmental Protection Agency. Bunker-fuel emissions are not included.
Two sets of per capita emissions are given, one with an estimate of the effects of land-use change (for example, cutting down forests) and one without. The former is based on regional estimates in Houghton (2003).[2] Difficulties with determining rates of deforestation and the magnitude of carbon stocks held by the remaining forests and with distributing regional carbon fluxes among individual countries mean that the land-use change components have a large margin of error, perhaps as large as +/-150% in some cases.
They are included here because, although difficult to quantify accurately at a country level, land-use change is a significant contributor to global warming. The WRI estimates that it accounted for almost a fifth of global anthropogenic greenhouse gas emissions in 2000. For 2005 the data for a large number of countries only includes CO2 emissions (see note 12.)
List of countries by emissions
| Country | Year 2000 Tonnes of CO2e with land-use change |
Year 2000 Tonnes of CO2e without land-use change |
Year 2005 Tonnes of CO2e without land-use change |
|---|---|---|---|
| Belize11,12 | 93.9 | 8.4 | 2.8 |
| Qatar12 | 54.7 | 54.7 | 55.5 |
| Guyana12 | 52.5 | 5.6 | 2 |
| Malaysia12 | 37.2 | 6.8 | 5.7 |
| United Arab Emirates1 | 36.8 | 36.8 | 38.8 |
| Kuwait | 30.4 | 30.4 | 35 |
| Papua New Guinea2,12, | 29.2 | 1.7 | 0.7 |
| Brunei1,12 | 25.9 | 25.9 | 13.9 |
| Australia | 25.9 | 25.6 | 26.9 |
| Antigua & Barbuda1,12 | 25.3 | 25.3 | 5.1 |
| Zambia12 | 24.6 | 2.6 | 0.2 |
| Canada | 24.3 | 22.2 | 22.6 |
| Bahrain 12 | 23.9 | 23.9 | 25.4 |
| United States3 | 22.9 | 24.3 | 23.5 |
| Trinidad & Tobago1,12 | 22.1 | 22.1 | 19.6 |
| Luxembourg1 | 21.2 | 21.2 | 27.5 |
| Panama12 | 19.7 | 3.6 | 1.9 |
| New Zealand | 19.3 | 18.5 | 18.8 |
| Estonia | 18.2 | 16.6 | 14.4 |
| Botswana12 | 17.8 | 6.5 | 2.3 |
| Ireland | 16.8 | 17.3 | 16.7 |
| Saudi Arabia | 16.5 | 16.5 | 16.2 |
| Venezuela | 15.8 | 9.9 | 10 |
| Indonesia | 14.9 | 2.4 | 2.7 |
| Equatorial Guinea12 | 14.5 | 4.6 | 6.7 |
| Belgium1 | 14.3 | 14.3 | 13.2 |
| Turkmenistan1 | 14.2 | 14.2 | 18.9 |
| Singapore | 14.1 | 14.1 | 11.3 |
| Czech Republic | 13.9 | 13.9 | 13.7 |
| Liberia 12 | 13.9 | 1 | 0.1 |
| Netherlands4 | 13.5 | 13.5 | 13.8 |
| Russia | 13.5 | 13.1 | 13.7 |
| Nicaragua 12 | 13.4 | 2.5 | 0.8 |
| Finland | 13.1 | 13.3 | 13 |
| Oman 12 | 12.9 | 12.9 | 12 |
| Palau1,12 | 12.8 | 12.8 | 5.7 |
| Brazil | 12.8 | 4.9 | 5.4 |
| Denmark5 | 12.5 | 12.5 | 11.5 |
| Germany | 12.3 | 12.3 | 11.9 |
| Mongolia | 11.8 | 11.6 | 11.9 |
| Israel | 11.8 | 11.8 | 11.5 |
| Nauru1,12 | 11.7 | 11.7 | 11 |
| Norway | 11.4 | 12.1 | 11.2 |
| South Korea | 11.1 | 11 | 11.4 |
| Kazakhstan1 | 11 | 11 | 12.7 |
| United Kingdom of Great Britain and Northern Ireland | 11 | 11 | 10.6 |
| Libya12 | 10.8 | 10.6 | 8.3 |
| Greece | 10.8 | 11 | 11.5 |
| Japan | 10.7 | 10.7 | 10.5 |
| Myanmar | 10.7 | 1.7 | 2.2 |
| Taiwan12 | 10.6 | 10.6 | 11.8 |
| Cyprus12 | 10.3 | 10.2 | 10.5 |
| Slovenia | 10.2 | 9.7 | 10.1 |
| Cambodia | 10.2 | 5.8 | 1.6 |
| Austria | 10 | 10.1 | 11.5 |
| Iceland1 | 10 | 10 | 11.1 |
| Peru | 9.9 | 2.7 | 2.8 |
| Paraguay12 | 9.9 | 6.1 | 0.6 |
| Ukraine1 | 9.8 | 9.8 | 10.3 |
| Poland | 9.6 | 9.6 | 9.8 |
| South Africa | 9.5 | 9.5 | 9 |
| Argentina | 9.3 | 7.8 | 8.2 |
| Slovakia | 9.3 | 8.7 | 9.3 |
| Spain6 | 9.2 | 9.4 | 10.1 |
| Italy7 | 9.2 | 9.2 | 9.7 |
| Central African Republic12 | 9 | 6.7 | 0.1 |
| France8 | 8.7 | 8.8 | 9 |
| Suriname12 | 8.6 | 8.6 | 5.3 |
| Belarus | 8.6 | 8 | 8.5 |
| Gabon12 | 8.4 | 5.5 | 3.7 |
| Ecuador | 8.2 | 3.4 | 3.3 |
| Bolivia | 8.1 | 3.5 | 6.9 |
| Cameroon12 | 7.6 | 2.4 | 0.4 |
| Iran | 7.6 | 7.5 | 8.2 |
| Côte d'Ivoire12 | 7.5 | 2 | 0.4 |
| Sweden | 7.5 | 7.5 | 7.4 |
| Seychelles1,2,12 | 7.4 | 7.4 | 7 |
| Guatemala12 | 7.4 | 2.4 | 0.9 |
| Bulgaria | 7.4 | 7.7 | 8.6 |
| Serbia & Montenegro12 | 7.4 | 7.4 | 4.8 |
| Hungary | 7.4 | 7.4 | 8.3 |
| Congo, Dem. Rep. | 7.4 | 1 | 1.6 |
| Uzbekistan1,12 | 7.3 | 7.3 | 6.9 |
| Portugal9 | 7.2 | 7.8 | 7.9 |
| Switzerland10 | 7.1 | 7.2 | 7.3 |
| Azerbaijan | 6.8 | 6.8 | 5.6 |
| Angola12 | 6.7 | 5.4 | 1.3 |
| Bahamas12 | 6.6 | 6.6 | 6.5 |
| Benin12 | 6.5 | 1.4 | 0.3 |
| Zimbabwe12 | 6.5 | 2.7 | 0.8 |
| Laos | 6.4 | 1.9 | 3.1 |
| Mexico | 6.4 | 5.4 | 6.1 |
| Nepal | 6.3 | 1.3 | 1.5 |
| Colombia | 6.3 | 3.8 | 3.9 |
| Namibia12 | 6.3 | 5.1 | 1.4 |
| Chile | 6.3 | 5.3 | 5.1 |
| Malta12 | 6.1 | 6.1 | 6.5 |
| Congo, Rep.2,12 | 6 | 3.2 | 1.4 |
| Madagascar12 | 6 | 2.3 | 0.2 |
| Croatia | 5.9 | 6 | 6.9 |
| Jamaica12 | 5.9 | 4.8 | 3.8 |
| Macedonia1 | 5.8 | 5.8 | 5.2 |
| Barbados1,12 | 5.8 | 5.8 | 4.5 |
| Latvia | 5.7 | 4 | 4.6 |
| Mauritania1,12 | 5.6 | 5.6 | 0.6 |
| Turkey | 5.6 | 5.3 | 5.5 |
| Romania | 5.5 | 5.5 | 6.1 |
| Lithuania | 5.4 | 4.5 | 5.7 |
| Costa Rica12 | 5.4 | 2.8 | 1.5 |
| Lebanon | 5.3 | 5.2 | 4.4 |
| North Korea | 5.2 | 5.1 | 5 |
| Thailand | 5.1 | 4.3 | 5.6 |
| Jordan | 4.9 | 4.9 | 4.2 |
| Honduras12 | 4.7 | 2 | 1.1 |
| Sudan12 | 4.6 | 3.7 | 0.3 |
| Bosnia & Herzegovina12 | 4.5 | 4.5 | 4.3 |
| Algeria | 4.2 | 4.2 | 4.2 |
| Iraq | 4.2 | 4.2 | 4.6 |
| Sierra Leone12 | 4.2 | 1.2 | 0.2 |
| Syria12 | 4 | 4 | 2.7 |
| China | 3.9 | 3.9 | 5.5 |
| Tunisia12 | 3.7 | 3.3 | 2.3 |
| Dominican Republic12 | 3.5 | 3.5 | 1.9 |
| Saint Kitts and Nevis1,12 | 3.3 | 3.3 | 2.8 |
| Nigeria | 3.3 | 1.6 | 2.1 |
| Fiji2,12 | 3.3 | 3.1 | 2 |
| Guinea12 | 3.2 | 2 | 0.2 |
| Mauritius1,12 | 3.2 | 3.2 | 2.7 |
| Cuba12 | 3.1 | 4 | 2.2 |
| Togo12 | 3.1 | 1.5 | 0.2 |
| Vanuatu12 | 3 | 2.9 | 0.4 |
| Philippines | 3 | 1.7 | 1.7 |
| Malawi12 | 3 | 0.6 | 0.1 |
| Mali12 | 2.9 | 2.2 | 0 |
| Chad12 | 2.9 | 2.4 | 0 |
| Sri Lanka12 | 2.8 | 1.3 | 0.7 |
| Uganda | 2.7 | 1.1 | 1.1 |
| Dominica1,12 | 2.7 | 2.7 | 1.6 |
| Saint Lucia1,12 | 2.7 | 2.7 | 2.2 |
| Egypt | 2.6 | 2.6 | 3 |
| Niue1,2,12 | 2.6 | 2.6 | 1.7 |
| Ghana12 | 2.6 | 1.2 | 0.4 |
| Moldova1 | 2.5 | 2.5 | 3.2 |
| Grenada1,12 | 2.5 | 2.5 | 2.2 |
| El Salvador12 | 2.4 | 1.8 | 1 |
| Guinea-Bissau12 | 2.4 | 1.6 | 0.2 |
| Tanzania12 | 2.4 | 1.9 | 0.1 |
| Djibouti12 | 2.4 | 2.4 | 0.5 |
| Pakistan | 2.3 | 2.1 | 1.5 |
| Samoa2,12 | 2.3 | 2.2 | 0.8 |
| Tonga12 | 2.3 | 2.3 | 1.2 |
| Morocco12 | 2.2 | 2.1 | 1.6 |
| Senegal | 2.2 | 1.8 | 1.8 |
| Albania | 2.2 | 1.9 | 2.9 |
| Georgia1 | 2.2 | 2.2 | 2 |
| Armenia1 | 2.1 | 2.1 | 2.5 |
| St. Vincent & Grenadines1,12 | 2 | 2 | 1.6 |
| Kenya12 | 2 | 1.6 | 0.3 |
| Maldives1,12 | 1.9 | 1.9 | 2.4 |
| Kyrgyzstan | 1.9 | 1.9 | 1.9 |
| Burkina Faso12 | 1.9 | 1.9 | 0.1 |
| India | 1.8 | 1.9 | 1.7 |
| Cook Islands2,12 | 1.8 | 1.7 | 2.9 |
| Bhutan12 | 1.7 | 1.7 | 0.6 |
| Yemen12 | 1.6 | 1.6 | 0.9 |
| Tajikistan1 | 1.6 | 1.6 | 0.5 |
| Mozambique12 | 1.6 | 1.1 | 0.1 |
| Rwanda12 | 1.6 | 0.7 | 0.1 |
| Burundi12 | 1.6 | 0.4 | 0 |
| Lesotho12 | 1.5 | 1.5 | 0.1 |
| Swaziland12 | 1.5 | 3.2 | 0.8 |
| Eritrea1,12 | 1.4 | 1.4 | 0.1 |
| Haiti12 | 1.4 | 1.2 | 0.2 |
| Solomon Islands12 | 1.1 | 0.8 | 0.4 |
| Vietnam | 1.1 | 1.7 | 2.1 |
| Cape Verde1,12 | 1.1 | 1.1 | 0.6 |
| Niger12 | 1.1 | 1 | 0.1 |
| Ethiopia | 1.1 | 0.9 | 1 |
| São Tomé and Príncipe12 | 1 | 1 | 0.7 |
| Afghanistan12 | 0.9 | 0.6 | 0 |
| The Gambia12 | 0.9 | 1.1 | 0.2 |
| Bangladesh | 0.9 | 0.9 | 0.9 |
| Comoros1,12 | 0.7 | 0.7 | 0.1 |
| Kiribati112 | 0.6 | 0.6 | 0.3 |
| Uruguay11 | 0.3 | 7.6 | 12.7 |
| Asia | 4.5 | 3.4 | |
| Europe | 10.6 | 10.5 | |
| Middle East & North Africa | 5.7 | 5.6 | |
| Sub-Saharan Africa | 4.5 | 2.3 | |
| North America | 23.1 | 24.1 | |
| Central America & Caribbean | 6.3 | 4.5 | |
| South America | 11.1 | 5.3 | |
| Oceania | 24.2 | 19.1 | |
1Compatible land-use change data not available for 2000
²Compatible PFC, HFC and SF6 data not available for 2000.
³Includes Puerto Rico, Guam and the US Virgin Islands. The WRI is ambiguous about which components are included for these additional territories. The non-land-use CO2 data includes all three; CH4, N2O, PFC, HFC and SF6 data are included for Puerto Rico and the US Virgin Islands but not for Guam; land-use change may or may not be included for any of the three.
4Not including the Netherlands Antilles.
5Not including Greenland and the Faeroe Islands.
6Including the Canary Islands.
7Including San Marino and the Vatican City.
8Including Monaco; not including Overseas Departments or French Polynesia.
9Including the Azores and Madeira.
10Including Liechtenstein.
11Average annual forest cover change as percentage of national total 1990-2000: Belize -2.3%, Uruguay +5.0%. Source: FAO.[3]
12 CH4, N2O, PFC, HFC and SF6 data not available for 2005.
See also
- List of countries by carbon dioxide emissions per capita
- List of countries by greenhouse gas emissions
- List of countries by carbon dioxide emissions
- Asian brown cloud
- Climate change
- Global warming
- LULUCF