List of Saskatchewan general elections
| CCF / NDP | Liberal | Saskatchewan Party | |||||
| Conservative | Other | Independent |
This article provides a summary of results for the general elections to the Canadian province of Saskatchewan's unicameral legislative body, the Legislative Assembly of Saskatchewan. The number of seats has varied over time, from 25 for the first election in 1905, to a high of 66 for the 1991 election. There are currently 61 seats.
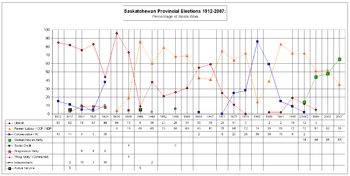
The chart on the upper right shows the information graphically, with the most recent elections on the right. It shows the popularity of the Liberal Party (red) before World War II, and the subsequent rise of the Co-operative Commonwealth Federation – succeeded by the New Democratic Party (orange). The successes and failures by the Conservatives (blue) and the recent arrival of the Saskatchewan Party (green) can also be seen.
Summary of results
The table below shows the total number of seats won by the major political parties at each election. The winning party's total is shown in bold. Full details on any election are linked via the year of the election at the start of the row.
| Year | Seats | Conservative[B] | Liberal | NDP[A] | SK Party | Independent | Other parties | ||
|---|---|---|---|---|---|---|---|---|---|
| 1905 | 25 | 9 | 16 | ||||||
| 1908 | 41 | 14 | 27 | ||||||
| 1912 | 53 | 8 | 45 | ||||||
| 1917 | 59 | 7 | 51 | 1 | |||||
| 1921 | 63 | 3 | 47 | 7 | 6 | Progressive | |||
| 1925 | 63 | 3 | 51[D] | 2 | 7 | Progressive (6), Labour-Liberal (1) | |||
| 1929 | 63 | 24[C] | 28 | 6 | 5 | Progressive | |||
| 1934 | 55 | 50 | 5 | ||||||
| 1938 | 52 | 38 | 10 | 4 | Unity Party (2), Social Credit (2) | ||||
| 1944 | 52 | 5 | 47 | ||||||
| 1948 | 52 | 20 | 31 | 1 | |||||
| 1952 | 53 | 11 | 42 | ||||||
| 1956 | 53 | 14 | 36 | 3 | Social Credit | ||||
| 1960 | 54 | 17 | 37 | ||||||
| 1964 | 58 | 1 | 32 | 25 | |||||
| 1967 | 59 | 35 | 24 | ||||||
| 1971 | 60 | 15 | 45 | ||||||
| 1975 | 61 | 7 | 15 | 39 | |||||
| 1978 | 61 | 17 | 44 | ||||||
| 1982 | 64 | 55 | 9 | ||||||
| 1986 | 64 | 38 | 1 | 25 | |||||
| 1991 | 66 | 10 | 1 | 55 | |||||
| 1995 | 58 | 5 | 11 | 42 | |||||
| 1999 | 58 | 4 | 29 | 25 | |||||
| 2003 | 58 | 30 | 28 | ||||||
| 2007 | 58 | 20 | 38 | ||||||
| 2011 | 58 | 9 | 49 | ||||||
| 2016 | 61 | 10 | 51 | ||||||
Notes
- A Includes results for the Co-operative Commonwealth Federation party from 1938 to 1964, and Farmer-Labour party for 1934 and earlier.
- B Includes all results for the Provincial Rights party from 1905 and 1908, and the Progressive Conservative Party from 1944 onwards.
- C The Liberals lost a motion of no-confidence shortly after the election and government was formed by a Conservative-Progressive coalition.
- D Includes "Independent Liberal" candidate and the "Independent Pro-Government" candidate.
References
- Government of Saskatchewan. "Provincial Vote Summaries". Historical. Elections Saskatchewan. Retrieved 2006-11-19.
- Government of Saskatchewan. "Election Results By Electoral Division" (PDF). Historical. Saskatchewan Archives Board.
| Most recent | |
|---|---|
| Future elections |
|
| Lists | |
| Electoral districts | |
| Lieutenant Governor (List) |  | |
|---|---|---|
| Premier (List - Premiers by time in office) | ||
| Opposition Leader (List) | ||
| Speaker of the Assembly | ||
| Legislature | ||
| Political parties | ||
| Historic parties |
| |
| Elections | ||
| Other Canadian politics | ||