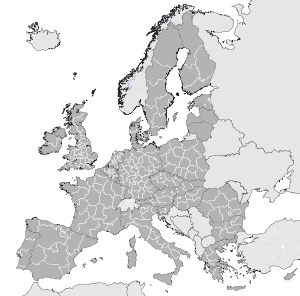
List of European regions by GDP
This is a list of European regions (NUTS2 regions) sorted by their gross domestic product (GDP). Eurostat calculates the GDP based on the information provided by national statistics institutes affiliated to eurostat.
The list presents statistics for 2010 from the EUROSTAT, as of 3 June 2013. The figures are in millions of nominal euros, purchasing power standards and per capita.
2013 list
NUTS-2
| Region (NUTS2) | Country | Nominal GDP million EUR |
GDP in PPS million EUR |
GDP in PPS per capita in EUR |
Inhabitants (Millions) |
|---|---|---|---|---|---|
| | 65,822 | 58,674 | 33,500 | 1.75 | |
| | 22,418 | 19,984 | 23,800 | 0.84 | |
| | 42,354 | 37,754 | 26,300 | 1.44 | |
| | 37,290 | 33,241 | 30,800 | 1.08 | |
| | 35,668 | 31,795 | 27,400 | 1.16 | |
| | 13,657 | 12,173 | 32,000 | 0.38 | |
| | 27,959 | 24,923 | 19,000 | 1.31 | |
| | 26,003 | 23,179 | 21,600 | 1.07 | |
| | 5,945 | 5,300 | 19,600 | 0.27 | |
| | 11,105 | 9,899 | 20,900 | 0.47 | |
| Extra Region for non-assigned GDP | 238 | 212 | : | ||
| Severozapaden | 2,586 | 5,781 | 6,500 | 0.89 | |
| Severen tsentralen | 2,851 | 6,375 | 7,000 | 0.91 | |
| Severoiztochen | 3,836 | 8,577 | 8,700 | 0.99 | |
| Yugoiztochen | 4,333 | 9,689 | 8,700 | 1.11 | |
| Yugozapaden | 17,371 | 38,837 | 18,400 | 2.11 | |
| Yuzhen tsentralen | 5,074 | 11,344 | 7,500 | 1.51 | |
| | 38,634 | 52,813 | 42,200 | 1.25 | |
| | 15,795 | 21,593 | 17,200 | 1.26 | |
| Jihozápad | 14,978 | 20,475 | 16,900 | 1.23 | |
| Severozápad | 12,850 | 17,566 | 15,400 | 1.14 | |
| Severovýchod | 17,647 | 24,124 | 16,000 | 1.51 | |
| Jihovýchod | 21,362 | 29,202 | 17,500 | 1.67 | |
| Střední Morava | 14,023 | 19,170 | 15,600 | 1.23 | |
| | 14,985 | 20,485 | 16,500 | 1.24 | |
| Extra Region for non-assigned GDP | : | : | : | ||
| Hovedstaden | 88,366 | 64,796 | 38,400 | 1.69 | |
| Sjælland | 24,776 | 18,167 | 22,200 | 0.82 | |
| Syddanmark | 45,717 | 33,523 | 27,900 | 1.20 | |
| Midtjylland | 48,811 | 35,791 | 28,500 | 1.26 | |
| Nordjylland | 21,194 | 15,541 | 26,800 | 0.58 | |
| Extra Region for non-assigned GDP | 7,613 | 5,582 | : | ||
| | 148,160 | 140,737 | 35,200 | 4.00 | |
| | 93,248 | 88,576 | 32,300 | 2.74 | |
| | 62,702 | 59,560 | 27,100 | 2.20 | |
| | 57,994 | 55,088 | 30,500 | 1.81 | |
| | 183,644 | 174,444 | 40,000 | 4.36 | |
| | 35,806 | 34,012 | 28,600 | 1.19 | |
| | 33,851 | 32,155 | 29,700 | 1.08 | |
| | 30,567 | 29,035 | 27,000 | 1.08 | |
| | 56,560 | 53,727 | 31,400 | 1.71 | |
| | 40,531 | 38,501 | 29,200 | 1.32 | |
| | 54,137 | 51,425 | 28,800 | 1.79 | |
| | 99,525 | 94,539 | 27,400 | 3.45 | |
| | 53,518 | 50,837 | 20,300 | 2.50 | |
| | 26,947 | 25,597 | 38,800 | 0.66 | |
| | 92,890 | 88,236 | 49,600 | 1.78 | |
| | 157,616 | 149,719 | 39,400 | 3.80 | |
| | 28,698 | 27,260 | 26,200 | 1.04 | |
| | 36,073 | 34,266 | 28,000 | 1.22 | |
| | 34,433 | 32,708 | 19,900 | 1.64 | |
| | 47,826 | 45,430 | 28,200 | 1.61 | |
| | 64,147 | 60,933 | 28,500 | 2.14 | |
| | 36,438 | 34,613 | 20,400 | 1.70 | |
| | 68,195 | 64,778 | 26,100 | 2.48 | |
| | 179,595 | 170,598 | 33,000 | 5.17 | |
| | 139,922 | 132,912 | 30,300 | 4.39 | |
| | 71,377 | 67,801 | 26,100 | 2.60 | |
| | 60,614 | 57,577 | 28,200 | 2.04 | |
| | 101,274 | 96,200 | 26,200 | 3.67 | |
| | 39,154 | 37,193 | 25,000 | 1.49 | |
| | 12,644 | 12,010 | 23,400 | 0.51 | |
| | 57,674 | 54,785 | 27,300 | 2.01 | |
| | 29,333 | 27,864 | 27,300 | 1.02 | |
| | 36,428 | 34,603 | 21,300 | 1.62 | |
| | 32,624 | 30,989 | 20,200 | 1.53 | |
| | 23,397 | 22,225 | 22,300 | 1.00 | |
| | 50,162 | 47,648 | 20,300 | 2.35 | |
| | 72,055 | 68,445 | 24,200 | 2.83 | |
| | 46,442 | 44,115 | 19,700 | 2.24 | |
| | 14,323 | 20,736 | 15,500 | 1.34 | |
| Border, Midland and Western | 27,764 | 25,073 | 20,700 | 1.21 | |
| Southern and Eastern | 128,722 | 116,244 | 35,600 | 3.27 | |
| Anatoliki Makedonia, Thraki | 9,054 | 9,860 | 16,300 | 0.60 | |
| Kentriki Makedonia | 30,087 | 32,766 | 16,800 | 1.95 | |
| Dytiki Makedonia | 5,281 | 5,751 | 19,600 | 0.29 | |
| Thessalia | 10,742 | 11,699 | 15,900 | 0.74 | |
| Ipeiros | 4,917 | 5,355 | 15,000 | 0.36 | |
| Ionia Nisia | 4,029 | 4,388 | 18,700 | 0.23 | |
| Dytiki Ellada | 10,326 | 11,246 | 15,100 | 0.74 | |
| Sterea Ellada | 10,059 | 10,955 | 19,800 | 0.55 | |
| Peloponnisos | 9,436 | 10,276 | 17,400 | 0.59 | |
| Attiki | 106,635 | 116,130 | 28,200 | 4.12 | |
| Voreio Aigaio | 3,155 | 3,436 | 17,200 | 0.20 | |
| Notio Aigaio | 7,476 | 8,142 | 26,300 | 0.31 | |
| Kriti | 10,955 | 11,931 | 19,500 | 0.61 | |
| | 56,441 | 60,280 | 22,000 | 2.74 | |
| | 22,420 | 23,946 | 22,700 | 1.05 | |
| | 12,832 | 13,705 | 23,700 | 0.58 | |
| | 64,473 | 68,859 | 32,200 | 2.14 | |
| | 17,916 | 19,135 | 30,800 | 0.62 | |
| | 7,955 | 8,497 | 27,000 | 0.31 | |
| | 33,263 | 35,526 | 27,100 | 1.31 | |
| | 188,076 | 200,871 | 31,600 | 6.36 | |
| | 54,891 | 58,625 | 23,500 | 2.49 | |
| | 37,004 | 39,521 | 19,400 | 2.04 | |
| | 17,164 | 18,332 | 16,900 | 1.08 | |
| | 194,996 | 208,261 | 28,400 | 7.33 | |
| | 100,563 | 107,405 | 21,500 | 5.00 | |
| | 25,964 | 27,730 | 25,600 | 1.08 | |
| | 142,522 | 152,217 | 18,500 | 8.23 | |
| | 27,855 | 29,750 | 20,300 | 1.47 | |
| | 1,526 | 1,630 | 21,600 | 0.08 | |
| | 1,360 | 1,453 | 19,700 | 0.07 | |
| | 40,790 | 43,565 | 20,800 | 2.09 | |
| Extra Region for non-assigned GDP | 871 | 931 | : | ||
| | 588,942 | 521,983 | 44,200 | 11.81 | |
| | 33,845 | 29,997 | 22,500 | 1.33 | |
| | 43,707 | 38,738 | 20,200 | 1.92 | |
| | 47,844 | 42,404 | 23,000 | 1.84 | |
| | 63,699 | 56,457 | 22,100 | 2.55 | |
| | 34,324 | 30,421 | 20,600 | 1.48 | |
| | 40,718 | 36,089 | 22,000 | 1.64 | |
| | 97,256 | 86,199 | 21,300 | 4.05 | |
| | 53,899 | 47,771 | 20,300 | 2.35 | |
| | 51,192 | 45,372 | 24,500 | 1.85 | |
| | 27,767 | 24,610 | 21,000 | 1.17 | |
| | 94,348 | 83,621 | 23,300 | 3.59 | |
| | 78,240 | 69,345 | 21,600 | 3.21 | |
| | 42,323 | 37,511 | 21,100 | 1.78 | |
| | 84,906 | 75,253 | 23,200 | 3.24 | |
| | 75,532 | 66,945 | 23,100 | 2.90 | |
| | 16,874 | 14,955 | 20,100 | 0.74 | |
| | 186,228 | 165,055 | 26,400 | 6.25 | |
| | 32,087 | 28,439 | 21,100 | 1.35 | |
| | 61,111 | 54,163 | 20,500 | 2.64 | |
| | 138,800 | 123,019 | 25,100 | 4.90 | |
| | 7,703 | 6,827 | 21,900 | 0.31 | |
| | 7,724 | 6,846 | 15,200 | 0.45 | |
| | 8,282 | 7,340 | 18,700 | 0.39 | |
| | 3,394 | 3,008 | 13,000 | 0.23 | |
| | 15,455 | 13,698 | 16,600 | 0.83 | |
| Extra Region for non-assigned GDP | 1,062 | 941 | : | ||
| Jadranska Hrvatska | 14,633 | 20,785 | 14,200 | 1.46 | |
| Kontinentalna Hrvatska | 30,225 | 42,931 | 14,500 | 2.96 | |
| | 123,169 | 118,610 | 26,600 | 4.46 | |
| | 4,312 | 4,152 | 32,400 | 0.13 | |
| | 43,384 | 41,778 | 25,800 | 1.62 | |
| | 330,997 | 318,745 | 32,300 | 9.87 | |
| | 18,697 | 18,005 | 35,600 | 0.51 | |
| | 16,245 | 15,644 | 29,700 | 0.53 | |
| | 145,766 | 140,371 | 28,500 | 4.93 | |
| | 36,055 | 34,720 | 28,100 | 1.24 | |
| | 136,721 | 131,660 | 29,800 | 4.42 | |
| | 103,713 | 99,874 | 26,700 | 3.74 | |
| | 21,421 | 20,628 | 22,800 | 0.90 | |
| | 40,471 | 38,973 | 24,900 | 1.57 | |
| | 169,198 | 162,935 | 28,600 | 5.70 | |
| | 28,696 | 27,633 | 20,600 | 1.34 | |
| | 6,493 | 6,253 | 19,500 | 0.32 | |
| | 94,553 | 91,053 | 15,600 | 5.84 | |
| | 69,294 | 66,729 | 16,300 | 4.09 | |
| | 10,479 | 10,091 | 17,200 | 0.59 | |
| | 33,017 | 31,795 | 15,800 | 2.01 | |
| | 84,830 | 81,690 | 16,200 | 5.04 | |
| | 33,030 | 31,808 | 19,000 | 1.67 | |
| Extra Region for non-assigned GDP | 2,543 | 2,449 | : | ||
| | 17,406 | 19,605 | 23,600 | 0.83 | |
| | 18,010 | 27,550 | 13,100 | 2.10 | |
| Extra Region for non-assigned GDP | 29 | 44 | : | ||
| | 27,608 | 46,203 | 14,900 | 3.10 | |
| | 39,906 | 33,092 | 65,200 | 0.51 | |
| Közép-Magyarország | 47,021 | 77,325 | 26,100 | 2.96 | |
| Közép-Dunántúl | 9,243 | 15,200 | 13,900 | 1.09 | |
| Nyugat-Dunántúl | 9,618 | 15,817 | 15,900 | 0.99 | |
| Dél-Dunántúl | 6,222 | 10,232 | 10,800 | 0.95 | |
| Észak-Magyarország | 7,087 | 11,654 | 9,700 | 1.20 | |
| Észak-Alföld | 9,126 | 15,007 | 10,100 | 1.49 | |
| Dél-Alföld | 8,269 | 13,598 | 10,400 | 1.31 | |
| | 6,300 | 8,734 | 21,000 | 0.42 | |
| Extra Region for non-assigned GDP | 14 | 19 | : | ||
| | 28,134 | 25,481 | 44,100 | 0.58 | |
| | 18,243 | 16,522 | 25,500 | 0.65 | |
| | 12,717 | 11,518 | 23,500 | 0.49 | |
| | 35,384 | 32,047 | 28,300 | 1.13 | |
| | 59,615 | 53,993 | 27,000 | 2.00 | |
| | 9,823 | 8,897 | 22,800 | 0.39 | |
| | 51,323 | 46,484 | 38,000 | 1.22 | |
| | 108,948 | 98,675 | 36,800 | 2.68 | |
| | 124,211 | 112,498 | 32,000 | 3.52 | |
| | 12,615 | 11,426 | 30,000 | 0.38 | |
| | 86,554 | 78,392 | 32,000 | 2.45 | |
| | 35,441 | 32,099 | 28,600 | 1.12 | |
| Extra Region for non-assigned GDP | 5,406 | 4,896 | : | ||
| | 6,609 | 6,023 | 21,200 | 0.28 | |
| | 45,418 | 41,395 | 25,700 | 1.61 | |
| | 75,503 | 68,815 | 40,300 | 1.71 | |
| | 16,055 | 14,633 | 26,200 | 0.56 | |
| | 35,775 | 32,606 | 27,000 | 1.21 | |
| | 47,666 | 43,444 | 30,800 | 1.41 | |
| | 20,834 | 18,989 | 35,800 | 0.53 | |
| | 25,051 | 22,832 | 32,300 | 0.71 | |
| | 13,369 | 12,184 | 33,000 | 0.37 | |
| Extra Region for non-assigned GDP | 117 | 107 | : | ||
| | 21,720 | 36,085 | 14,100 | 2.56 | |
| | 79,061 | 131,349 | 24,900 | 5.28 | |
| | 26,057 | 43,290 | 13,000 | 3.33 | |
| | 46,071 | 76,540 | 16,400 | 4.67 | |
| | 13,528 | 22,475 | 10,300 | 2.18 | |
| | 13,145 | 21,839 | 10,300 | 2.12 | |
| | 8,932 | 14,839 | 11,600 | 1.28 | |
| | 8,033 | 13,346 | 11,100 | 1.20 | |
| | 33,015 | 54,850 | 15,900 | 3.45 | |
| | 13,680 | 22,727 | 13,300 | 1.71 | |
| | 7,931 | 13,177 | 12,900 | 1.02 | |
| | 30,070 | 49,957 | 17,200 | 2.90 | |
| | 7,605 | 12,635 | 12,200 | 1.04 | |
| | 16,116 | 26,775 | 12,800 | 2.09 | |
| | 9,731 | 16,166 | 11,200 | 1.44 | |
| | 19,921 | 33,096 | 14,700 | 2.25 | |
| Extra Region for non-assigned GDP | : | 589,145 | : | ||
| Norte | 48,836 | 59,125 | 15,800 | 3.74 | |
| Algarve | 7,302 | 8,841 | 20,300 | 0.44 | |
| Centro (PT) | 32,019 | 38,764 | 16,300 | 2.38 | |
| Lisboa | 64,275 | 77,816 | 27,400 | 2.84 | |
| Alentejo | 11,252 | 13,623 | 18,100 | 0.75 | |
| Região Autónoma dos Açores (PT) | 3,743 | 4,532 | 18,500 | 0.24 | |
| Região Autónoma da Madeira (PT) | 5,207 | 6,305 | 25,500 | 0.25 | |
| Extra Region for non-assigned GDP | 199 | 241 | : | ||
| Nord-Vest | 14,079 | 27,689 | 10,200 | 2.71 | |
| Centru | 14,028 | 27,589 | 10,900 | 2.53 | |
| Nord-Est | 13,234 | 26,026 | 7,000 | 3.72 | |
| Sud-Est | 13,400 | 26,353 | 9,400 | 2.80 | |
| Sud - Muntenia | 15,716 | 30,908 | 9,500 | 3.25 | |
| Bucuresti - Ilfov | 31,144 | 61,249 | 27,100 | 2.26 | |
| Sud-Vest Oltenia | 9,981 | 19,629 | 8,800 | 2.23 | |
| Vest | 12,590 | 24,759 | 12,900 | 1.92 | |
| Extra Region for non-assigned GDP | 155 | 304 | : | ||
| Vzhodna Slovenija | 15,579 | 18,397 | 17,000 | 1.08 | |
| Zahodna Slovenija | 20,028 | 23,650 | 24,500 | 0.97 | |
| | 18,297 | 26,940 | 43,100 | 0.63 | |
| Západné Slovensko | 21,206 | 31,224 | 16,700 | 1.87 | |
| Stredné Slovensko | 13,357 | 19,666 | 14,600 | 1.35 | |
| Východné Slovensko | 13,010 | 19,156 | 12,100 | 1.58 | |
| Länsi-Suomi | 40,731 | 33,901 | 25,000 | 1.36 | |
| Helsinki-Uusimaa | 69,173 | 57,573 | 37,800 | 1.52 | |
| Etelä-Suomi | 32,709 | 27,224 | 23,500 | 1.16 | |
| Pohjois- ja Itä-Suomi | 34,984 | 29,117 | 22,500 | 1.29 | |
| | 1,123 | 934 | 33,500 | 0.03 | |
| Extra Region for non-assigned GDP | 76 | 63 | : | ||
| | 103,797 | 84,079 | 41,100 | 2.05 | |
| Östra Mellansverige | 49,696 | 40,255 | 25,800 | 1.56 | |
| Småland med öarna | 26,322 | 21,322 | 26,400 | 0.81 | |
| Sydsverige | 44,952 | 36,413 | 26,200 | 1.39 | |
| Västsverige | 66,070 | 53,519 | 28,600 | 1.87 | |
| Norra Mellansverige | 26,404 | 21,388 | 26,000 | 0.82 | |
| Mellersta Norrland | 13,353 | 10,816 | 29,400 | 0.37 | |
| Övre Norrland | 19,255 | 15,597 | 30,800 | 0.51 | |
| Extra Region for non-assigned GDP | 97 | 78 | : | ||
| | 31,107 | 30,795 | 21,500 | 1.43 | |
| | 11,471 | 11,356 | 23,000 | 0.49 | |
| | 62,283 | 61,660 | 23,500 | 2.62 | |
| | 29,803 | 29,505 | 20,400 | 1.45 | |
| 25,903 | 25,644 | 28,800 | 0.89 | ||
| | 29,353 | 29,059 | 19,800 | 1.47 | |
| | 18,563 | 18,377 | 19,900 | 0.92 | |
| North Riding of Yorkshire | 18,448 | 18,263 | 22,800 | 0.80 | |
| | 26,738 | 26,470 | 19,900 | 1.33 | |
| | 52,997 | 52,467 | 23,300 | 2.25 | |
| | 47,731 | 47,253 | 22,500 | 2.10 | |
| | 43,080 | 42,649 | 25,400 | 1.68 | |
| | 13,562 | 13,427 | 19,100 | 0.70 | |
| | 29,529 | 29,234 | 23,000 | 1.27 | |
| | 30,667 | 30,360 | 19,900 | 1.53 | |
| | 62,477 | 61,852 | 23,300 | 2.65 | |
| | 58,745 | 58,156 | 24,500 | 2.37 | |
| | 47,917 | 47,437 | 27,500 | 1.72 | |
| | 38,253 | 37,870 | 21,800 | 1.74 | |
| Inner London | 250,133 | 247,629 | 80,300 | 3.08 | |
| Outer London | 111,887 | 110,767 | 23,400 | 4.73 | |
| | 79,451 | 78,656 | 34,900 | 2.25 | |
| | 76,042 | 75,281 | 27,900 | 2.70 | |
| | 50,860 | 50,351 | 26,700 | 1.89 | |
| | 37,407 | 37,033 | 22,000 | 1.68 | |
| | 67,061 | 66,390 | 28,200 | 2.35 | |
| | 28,202 | 27,920 | 22,500 | 1.24 | |
| | 9,551 | 9,456 | 17,600 | 0.54 | |
| | 24,666 | 24,419 | 21,400 | 1.14 | |
| West Wales and The Valleys | 32,970 | 32,640 | 17,200 | 1.90 | |
| East Wales | 27,529 | 27,253 | 24,600 | 1.11 | |
| Eastern Scotland | 53,962 | 53,422 | 26,600 | 2.01 | |
| South Western Scotland | 56,425 | 55,860 | 24,300 | 2.30 | |
| North Eastern Scotland | 18,481 | 18,296 | 39,500 | 0.46 | |
| Highlands and Islands | 9,682 | 9,585 | 21,400 | 0.45 | |
| Northern Ireland (UK) | 38,079 | 37,698 | 21,000 | 1.80 | |
| Extra Region for non-assigend GDP | 36,171 | 35,808 | : | ||
| Oslo og Akershus | 78,414 | 53,363 | 47,100 | 1.13 | |
| Hedmark og Oppland | 13,868 | 9,437 | 25,000 | 0.38 | |
| Sør-Østlandet | 37,245 | 25,346 | 27,100 | 0.94 | |
| Agder og Rogaland | 39,095 | 26,606 | 37,300 | 0.71 | |
| Vestlandet | 42,937 | 29,220 | 34,800 | 0.84 | |
| Trøndelag | 18,817 | 12,806 | 30,200 | 0.42 | |
| Nord-Norge | 20,101 | 13,680 | 29,300 | 0.47 | |
| Extra-Regio level 2 | 67,385 | 45,857 | : | ||
| | 7,057 | 17,974 | 8,700 | 2.07 |
See also
- Economy of the European Union
- Comparison between U.S. states and countries by GDP (nominal)
- Comparison between U.S. states and countries by GDP (PPP)
- List of country subdivisions by GDP over USD 100 billions
Sources
External links
- Press releas: Regional GDP per capita in the EU in 2010
- http://epp.eurostat.ec.europa.eu/cache/ITY_PUBLIC/1-21032013-AP/EN/1-21032013-AP-EN.PDF
- http://ec.europa.eu/eurostat/documents/2995521/7192292/1-26022016-AP-EN.pdf/602b34e8-abba-439e-b555-4c3cb1dbbe6e Press release: Twenty-one regions below half of the EU average……and five regions over double the average
This article is issued from Wikipedia - version of the 12/4/2016. The text is available under the Creative Commons Attribution/Share Alike but additional terms may apply for the media files.