Lebern District


Lebern District is one of the ten districts of the canton of Solothurn, Switzerland, situated to the west of the canton. Together with the city of Solothurn, it forms the Amtei (electoral district) of Solothurn-Lebern. It has a population of 44,849 (as of 31 December 2015).
Municipalities
Lebern District contains the following municipalities:
| Coat of arms | Municipality | Population (31 December 2015)[1] |
Area, km² |
|---|---|---|---|
| |
Balm bei Günsberg | 202 | 5.46 |
| |
Bellach | 5,211 | 5.28 |
| |
Bettlach | 4,873 | 12.20 |
| |
Feldbrunnen-St. Niklaus | 974 | 2.47 |
| |
Flumenthal | 959 | 3.09 |
| |
Grenchen | 16,741 | 26.08 |
| |
Günsberg | 1,152 | 5.28 |
| |
Hubersdorf | 725 | 1.40 |
| |
Kammersrohr | 33 | 0.94 |
| |
Langendorf | 3,749 | 1.93 |
| |
Lommiswil | 1,479 | 5.76 |
| |
Oberdorf | 1,654 | 11.94 |
| |
Riedholza | 2,289 | 7.20 |
| Niederwil | 395 | ||
| |
Rüttenen | 1,507 | 8.80 |
| |
Selzach | 3,301 | 19.51 |
| Total | 44,849 | 117.34 | |
Mergers
In 2011 Niederwil merged into Riedholz.[2]
Geography
Lebern has an area, as of 2009, of 117.28 square kilometers (45.28 sq mi). Of this area, 46.97 km2 (18.14 sq mi) or 40.0% is used for agricultural purposes, while 51.23 km2 (19.78 sq mi) or 43.7% is forested. Of the rest of the land, 16.89 km2 (6.52 sq mi) or 14.4% is settled (buildings or roads), 1.53 km2 (0.59 sq mi) or 1.3% is either rivers or lakes and 0.66 km2 (0.25 sq mi) or 0.6% is unproductive land.[3]
Of the built up area, industrial buildings made up 1.3% of the total area while housing and buildings made up 7.4% and transportation infrastructure made up 4.3%. Out of the forested land, 41.8% of the total land area is heavily forested and 1.9% is covered with orchards or small clusters of trees. Of the agricultural land, 34.2% is used for growing crops and 5.0% is used for alpine pastures. All the water in the district is flowing water.[3]
Coat of arms

The blazon of the municipal coat of arms is Gules a Pale chevrony Or and Sable.[4]
Demographics
Lebern has a population (as of December 2015) of 44,849.[5]
Most of the population (as of 2000) speaks German (36,787 or 87.6%), with Italian being second most common (1,589 or 3.8%) and French being third (735 or 1.7%). There are 34 people who speak Romansh.[6]
As of 2008, the gender distribution of the population was 49.6% male and 50.4% female. The population was made up of 16,823 Swiss men (38.8% of the population) and 4,659 (10.8%) non-Swiss men. There were 17,730 Swiss women (40.9%) and 4,102 (9.5%) non-Swiss women.[7] Of the population in the district 12,874 or about 30.6% were born in Lebern and lived there in 2000. There were 10,524 or 25.1% who were born in the same canton, while 10,380 or 24.7% were born somewhere else in Switzerland, and 6,853 or 16.3% were born outside of Switzerland.[6]
In 2008 there were 255 live births to Swiss citizens and 72 births to non-Swiss citizens, and in same time span there were 387 deaths of Swiss citizens and 17 non-Swiss citizen deaths. Ignoring immigration and emigration, the population of Swiss citizens decreased by 132 while the foreign population increased by 55. There were 38 Swiss men and 22 Swiss women who immigrated back to Switzerland. At the same time, there were 168 non-Swiss men and 98 non-Swiss women who immigrated from another country to Switzerland. The total Swiss population change in 2008 (from all sources, including moves across municipal borders) was an increase of 24 and the non-Swiss population increased by 265 people. This represents a population growth rate of 0.7%.[8]
As of 2000, there were 15,786 people who were single and never married in the district. There were 20,906 married individuals, 2,708 widows or widowers and 2,608 individuals who are divorced.[6]
There were 5,985 households that consist of only one person and 1,035 households with five or more people. Out of a total of 18,497 households that answered this question, 32.4% were households made up of just one person and 156 were adults who lived with their parents. Of the rest of the households, there are 5,817 married couples without children, 5,207 married couples with children There were 869 single parents with a child or children. There were 190 households that were made up unrelated people and 273 households that were made some sort of institution or another collective housing.[6]
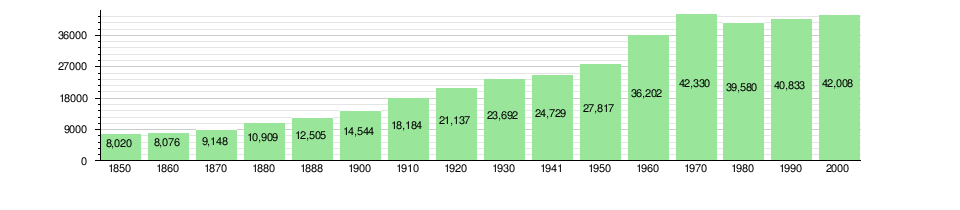
The historical population is given in the following chart:[9]
Politics
In the 2007 federal election the most popular party was the SVP which received 28.79% of the vote. The next three most popular parties were the SP (21.27%), the FDP (21.15%) and the CVP (18.08%). In the federal election, a total of 14,271 votes were cast, and the voter turnout was 48.9%.[10]
Religion
From the 2000 census, 16,292 or 38.8% were Roman Catholic, while 14,664 or 34.9% belonged to the Swiss Reformed Church. Of the rest of the population, there were 379 members of an Orthodox church (or about 0.90% of the population), there were 315 individuals (or about 0.75% of the population) who belonged to the Christian Catholic Church, and there were 729 individuals (or about 1.74% of the population) who belonged to another Christian church. There were 6 individuals (or about 0.01% of the population) who were Jewish, and 2,071 (or about 4.93% of the population) who were Islamic. There were 106 individuals who were Buddhist, 150 individuals who were Hindu and 35 individuals who belonged to another church. 5,943 (or about 14.15% of the population) belonged to no church, are agnostic or atheist, and 1,318 individuals (or about 3.14% of the population) did not answer the question.[6]
Education
In Lebern about 16,394 or (39.0%) of the population have completed non-mandatory upper secondary education, and 4,923 or (11.7%) have completed additional higher education (either University or a Fachhochschule). Of the 4,923 who completed tertiary schooling, 68.6% were Swiss men, 20.0% were Swiss women, 7.7% were non-Swiss men and 3.7% were non-Swiss women.[6]
References
- ↑ Swiss Federal Statistical Office - STAT-TAB, online database – Ständige und nichtständige Wohnbevölkerung nach institutionellen Gliederungen, Geburtsort und Staatsangehörigkeit (German) accessed 30 August 2016
- ↑ Amtliches Gemeindeverzeichnis der Schweiz published by the Swiss Federal Statistical Office (German) accessed 18 February 2011
- 1 2 Swiss Federal Statistical Office-Land Use Statistics 2009 data (German) accessed 25 March 2010
- ↑ Flags of the World.com accessed 15-March-2011
- ↑ Swiss Federal Statistical Office - STAT-TAB, online database – Ständige und nichtständige Wohnbevölkerung nach institutionellen Gliederungen, Geburtsort und Staatsangehörigkeit (German) accessed 30 August 2016
- 1 2 3 4 5 6 STAT-TAB Datenwürfel für Thema 40.3 - 2000 (German) accessed 2 February 2011
- ↑ Canton of Solothurn Statistics - Wohnbevölkerung der Gemeinden nach Nationalität und Geschlecht (German) accessed 11 March 2011
- ↑ Swiss Federal Statistical Office - Superweb database - Gemeinde Statistics 1981-2008 (German) accessed 19 June 2010
- ↑ Swiss Federal Statistical Office STAT-TAB Bevölkerungsentwicklung nach Region, 1850-2000 (German) accessed 29 January 2011
- ↑ Swiss Federal Statistical Office, Nationalratswahlen 2007: Stärke der Parteien und Wahlbeteiligung, nach Gemeinden/Bezirk/Canton (German) accessed 28 May 2010
Coordinates: 47°11′N 7°23′E / 47.183°N 7.383°E