Lean CFP driven
Lean CFP (Complex Flow Production) Driven is a new approach which takes into account not only the widely implemented Lean manufacturing, but combines the principles of Lean with the Operating Curve, an approach based on the theoretical approach of Queuing Theory developed in academia in the 1970s.[1] The goal of Lean CFP Driven is to eliminate waste in order to achieve higher quality, increase productivity and at the same time understand the relationship between utilization, lead time and variability in order to maximize performance within the semiconductor industry.
Lean CFP Driven – Lean Complex Flow Production Driven
1. Background Semiconductor industry
The semiconductor industry is one of the most productive and dynamic industries in the world. It faces a continuous and rapid advancement in technology which puts the companies under constant pressure to come up with superior and cheaper goods than those that were state-of-the-art only a few months ago.[2] The market and development of the market is based on Moore's Law or More than Moore.[3]
Customer demand in the semiconductor market evolves and changes at a swift pace which leads to the fact that a high level of flexibility is necessary to serve and meet the requirements of the customers.[4] The semiconductor industry is furthermore very capital intensive based on the fact that the production equipment is highly complex, specialized and thus incredibly expensive.[1] Challenges that the industry is facing are to continuously improve yield performance, achieve the highest possible return on the expensive equipment, speed and zero defects.[1]
2. Lean CFP Driven and Traditional Lean
Lean CFP Driven moves in a new direction from the traditional Lean because of the additional focus on utilization, cycle time and variability. The different characteristics of the semiconductor industry, e.g. production structure and production related costs compared to other industries, forms the need to approach the Lean philosophy in a new way in order to meet these specific characteristics.
There are five key characteristics for the semiconductor industry:
- Long cycle time.[5]
- No parallel process possible, high complexity[6]
- Short product life cycle.
- Capital intensive production[1]
- Drastic cost decrease over time
The complex production flow of a semiconductor fab is due to what is called a reentrance flow. A reentrant flow is a well-known attribute within a wafer fab and refers to the wafer visiting each tool not only once, but maybe 20 times during the course through the fab. To duplicate the expensive equipment and create a linear flow would make it even more challenging to get the highest possible return on the equipment and reach an optimized utilization of each tool, even though it results in a very complex production.[7]
The reentrant flow does require a certain level of flexibility, which in terms of Lean, could be seen as muda (Waste). The necessary flexibility, also in order to meet fluctuations in customer demand, requires the companies to apply other tools to measure and forecast performance[4] and this is what Lean CFP Driven provides to the Semiconductor Industry. Lean CFP Driven adds the Operating Curve to evaluate the factors utilization, cycle time and variability which cannot be done through implementation of Traditional Lean.
Typical tools within the Traditional Lean which are also included in the new approach of Lean CFP Driven are as follows:
What distinguishes Lean CFP Driven from the traditional approach of Lean in terms of tools is that the new approach applies the tool Operating Curve in addition to the tools listed above. An example of how the Operating Curve could look like is shown in the figure below. The optimal operating point is indicated for different variabilities describing the non-uniformity of the production ( ). The great advantage of adding the Operating Curve tool is to maximize performance by optimizing both utilization and speed at the same time for the complex industry of Semiconductors by reducing the variability via the 4-partner method.

The Operating Curve is a tool initially developed in academia in the 1970s, based on the Queuing Theory, which uses the indicators Cycle Time and Utilization to benchmark and forecast a manufacturing line’s performance.[1] The Operating Curve can be applied for different reasons, for example:
- Understanding the relationship between variability, cycle time and utilization[4]
- Quantify trade-off between cycle time and utilization [1]
- Documenting a single factory’s performance over time [1]
- Calculate and Measure line performance [1]
The Operating curve can be described by the following formula:
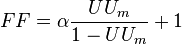
where :
 | Flow Factor ranging from 0 - ∞ |
| | Variability describing the non-uniformity of the production (low α indicates good performance). Alpha ranges from 0-1 |
 | Utilization, ranging from 0-100% |
The flow factor can also be described as:
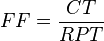
Where:
| CT | The line’s actual cycle time |
| RPT | The theoretical minimum amount of time that a lot (production unit) would need to move from beginning to end (i.e. without queuing or process inefficiencies) |
| CT | = WIP/GR |
| WIP | Average Work in Process (including all products, also lots on hold) |
| RPT | Maximum number of units to be processed each day |
| UUm | = GR/CapaPU |
| CapaPU | Capacity of the production unit |
References
- 1 2 3 4 5 6 7 8 Aurand S. Steven, Miller J. Peter; The Operating Curve: A Method to Measure and benchmark manufacturing line productivity; IEEE, USA, 1997.
- ↑ Investopedia; http://www.investopedia.com/features/industryhandbook/semiconductor.asp#axzz1vbOvyLAZ; 02.07.2012.
- ↑ ieee spectrum; http://spectrum.ieee.org/computing/hardware/moores-law-meets-its-match; 01.07.2012.
- 1 2 3 Bauer H, Kouris I, Schlögl G, Sigrist T, Veira J, Wee D; Mastering variability in complex environments; McKinsey & Company, 2011 .
- ↑ Weber C, Fayed A; Enabling Timely Revolutions in the Performance of Multi-Product Fabs, Portland State University, Austin Texas, USA, 2009.
- ↑ Kohn R, Noack D, Mosinski M, Zhou Z, Rose O; Evaluation of modeling, simulation and optimization approaches for work flow management in semiconductor manufacturing; Institute of Applied Computer Science; Dresden Germany; 2009.
- ↑ FabTime Cycle Time Management Newsletter – Volume 13, Number 3, 2012 by FabTime Inc.