Laois County Council election, 2014
Laois County Council election, 2014

|
|
|
|
|
|
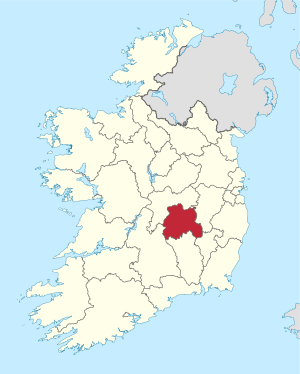
| Map showing the area of Laois County Council |
|
Council control after election
TBD
|
|
|
An election to Laois County Council took place on 23 May 2014 as part of that year's Irish local elections. 19 councillors were elected from three electoral divisions by PR-STV voting for a five-year term of office, a reduction of 2 seats from the previous election in 2009. In addition Mountmellick Town Council and Portlaoise Town Council were both abolished.
Fianna Fáil became the largest party after the elections securing 7 Council seats. Fine Gael, by contrast, had a very poor set of results and lost half of their Council seats returning with just 6 seats in all. Sinn Féin doubled their representation to 2 seats and Labour retained a seat on the Council in the Portlaoise LEA. Independents make up the remainder of the Council membership.
Results by party
Results by Electoral Area
[1]
Borris-in-Ossory-Mountmellick
| Bossis-in-Ossory - Mountmellick - 6 seats |
| Party | Candidate | % 1st Pref | Count 1 | Count 2 | Count 3 | Count 4 | Count 5 | Count 6 | Count 7 | Count 8 | Count 9 | Count 10 |
|
Fine Gael |
John King* |
9.87 |
1,189 |
1,190 |
1,195 |
1,199 |
1,199 |
1,204 |
1,414 |
1,454 |
1,689 |
1,694 |
|
Independent |
James Kelly |
9.68 |
1,166 |
1,242 |
1,250 |
1,396 |
1,424 |
1,450 |
1,511 |
1,759 |
|
|
|
Independent |
Brendan Phelan* |
9.11 |
1,097 |
1,129 |
1,130 |
1,172 |
1,198 |
1,213 |
1,285 |
1,432 |
1,781 |
|
|
Fianna Fáil |
Paddy Bracken* |
9.11 |
1,051 |
1,086 |
1,203 |
1,223 |
1,311 |
1,542 |
1,560 |
1,680 |
1,807 |
|
|
Fianna Fáil |
Séamus McDonald* |
7.64 |
920 |
935 |
955 |
978 |
1,259 |
1,368 |
1,382 |
1,448 |
1,531 |
1,604 |
|
Sinn Féin |
Rhoda Dooley-Brogan |
7.23 |
871 |
921 |
942 |
962 |
1,006 |
1,051 |
1,071 |
1,071 |
|
|
|
Fine Gael |
Michael Lalor* |
7.17 |
864 |
903 |
911 |
984 |
1,002 |
1,028 |
1,130 |
1,186 |
1,218 |
1,219 |
|
Fianna Fáil |
Michael Phelan |
7.16 |
863 |
866 |
868 |
950 |
965 |
972 |
1,078 |
1,121 |
1,121 |
|
|
Fine Gael |
David Goodwin* |
7.03 |
847 |
866 |
968 |
982 |
1,068 |
1,164 |
1,297 |
1,331 |
1,381 |
1,387 |
|
Fine Gael |
John Finlay |
5.44 |
656 |
663 |
691 |
738 |
751 |
793 |
793 |
|
|
|
|
Fianna Fáil |
Joe Digan |
5.41 |
652 |
657 |
660 |
685 |
685 |
|
|
|
|
|
|
Fianna Fáil |
Gerard Phelan |
4.42 |
533 |
537 |
537 |
537 |
|
|
|
|
|
|
|
Labour Party |
Lisa Delaney |
4.37 |
526 |
559 |
678 |
686 |
709 |
709 |
|
|
|
|
|
Fine Gael |
Bobby Delaney |
3.64 |
439 |
459 |
459 |
|
|
|
|
|
|
|
|
Independent |
Pat Cooper |
1.64 |
197 |
|
|
|
|
|
|
|
|
|
|
Independent |
Donal Keenan |
1.47 |
177 |
|
|
|
|
|
|
|
|
|
| Electorate: 19,840 Valid: 12,048 (60.73%) Spoilt: 125 Quota: 1,722 Turnout: 12,173 (61.36%) |
Graiguecullen-Portarlington
| Graiguecullen-Portarlington - 6 seats |
| Party | Candidate | % 1st Pref | Count 1 | Count 2 | Count 3 | Count 4 | Count 5 | Count 6 | Count 7 | Count 8 |
|
Sinn Féin |
Aidan Mullins |
14.64 |
1,547 |
|
|
|
|
|
|
|
|
Fianna Fáil |
Padraig Fleming* |
11.79 |
1,246 |
1,290 |
1,309 |
1,369 |
1,391 |
1,393 |
1,522 |
|
|
Independent |
Ben Brennan* |
10.53 |
1,112 |
1,198 |
1,218 |
1,303 |
1,410 |
1,420 |
1,493 |
1,560 |
|
Fine Gael |
Tom Mulhall* |
9.79 |
1,034 |
1,036 |
1,073 |
1,131 |
1,204 |
1,208 |
1,327 |
1,435 |
|
Fine Gael |
John Moran* |
8.58 |
906 |
923 |
942 |
955 |
973 |
974 |
1,260 |
1,432 |
|
Fianna Fáil |
Paschal McEvoy |
8.36 |
883 |
885 |
897 |
924 |
948 |
950 |
994 |
1,319 |
|
Fianna Fáil |
Willie Murphy |
7.61 |
804 |
806 |
858 |
897 |
1,116 |
1,131 |
1,137 |
1,209 |
|
Fianna Fáil |
Dick Miller |
6.87 |
726 |
733 |
742 |
789 |
827 |
828 |
900 |
|
|
Fine Gael |
James Daly* |
6.61 |
698 |
714 |
752 |
791 |
808 |
810 |
|
|
|
Independent |
Ray Cribbin* |
5.01 |
529 |
546 |
592 |
672 |
|
|
|
|
|
Independent |
Kevin Scully |
4.54 |
480 |
505 |
541 |
|
|
|
|
|
|
Labour Party |
Gráinne Corcoran |
3.15 |
333 |
343 |
|
|
|
|
|
|
|
Independent |
Keith Lennon |
2.53 |
267 |
|
|
|
|
|
|
|
| Electorate: 19,295 Valid: 10,565 (54.76%) Spoilt: 100 Quota: 1,510 Turnout: 10,665 (55.27%) |
Portlaoise
| Portlaoise - 7 seats |
| Party | Candidate | % 1st Pref | Count 1 | Count 2 | Count 3 | Count 4 | Count 5 | Count 6 | Count 7 | Count 8 | Count 9 | Count 10 | Count 11 | Count 12 |
|
Fine Gael |
William Aird* |
13.95 |
1,450 |
|
|
|
|
|
|
|
|
|
|
|
Fianna Fáil |
John Joe Fennelly* |
13.22 |
1,374 |
|
|
|
|
|
|
|
|
|
|
|
Sinn Féin |
Caroline Stanley-Dwane* |
12.97 |
1,348 |
|
|
|
|
|
|
|
|
|
|
|
Fine Gael |
Mary Sweeney* |
9.98 |
1,037 |
1,075 |
1,088 |
1,094 |
1,095 |
1,117 |
1,131 |
1,263 |
1,305 |
|
|
|
Fianna Fáil |
Catherine Fitzgerald* |
7.90 |
821 |
841 |
856 |
856 |
858 |
923 |
932 |
984 |
1,012 |
1,051 |
1,119 |
|
Fianna Fáil |
Jerry Lodge* |
6.95 |
722 |
738 |
749 |
754 |
757 |
796 |
812 |
876 |
912 |
949 |
1,036 |
|
Labour Party |
Noel Tuohy |
6.59 |
685 |
698 |
699 |
707 |
709 |
746 |
770 |
835 |
877 |
1,009 |
1,146 |
|
Independent |
Rotimi Adebari* |
5.59 |
581 |
585 |
587 |
637 |
639 |
660 |
690 |
713 |
777 |
818 |
948 |
|
Fine Gael |
Jim Ring |
4.59 |
477 |
487 |
508 |
509 |
510 |
513 |
518 |
559 |
597 |
597 |
|
|
Independent |
Stephen Greene |
4.42 |
459 |
463 |
464 |
487 |
494 |
505 |
570 |
586 |
693 |
708 |
708 |
|
Sinn Féin |
Sharon Bailey |
4.22 |
438 |
441 |
445 |
447 |
474 |
485 |
548 |
552 |
552 |
|
|
|
Fine Gael |
Kathleen O'Brien* |
3.48 |
362 |
398 |
398 |
402 |
404 |
422 |
434 |
434 |
|
|
|
|
Anti-Austerity Alliance |
Ray Fitzpatrick |
2.43 |
252 |
254 |
256 |
269 |
271 |
281 |
281 |
|
|
|
|
|
Fianna Fáil |
David Ryan |
2.33 |
242 |
245 |
250 |
255 |
255 |
255 |
|
|
|
|
|
|
Independent |
Osaro Fajimiyo |
1.04 |
108 |
109 |
109 |
109 |
|
|
|
|
|
|
|
|
Independent |
Joseph McCormack |
0.34 |
35 |
36 |
36 |
36 |
|
|
|
|
|
|
|
| Electorate: 20,568 Valid: 10,391 Spoilt: 104 Quota: 1,299 Turnout: 10,495 (51%) |
References
External links