Lancashire County Council election, 2005
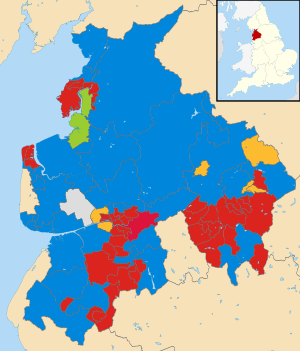
2005 local election results in Lancashire
Elections to Lancashire County Council were held on 5 May 2005, on the same day as the 2005 general election.
Each single-member ward in Lancashire was modified by boundary changes. No elections were held in Blackpool or Blackburn as they are unitary authorities outside of the county boundaries.
Party results
| Lancashire Council election, 2005 | ||
|---|---|---|
| Party | Seats | |
| Labour | 44 | |
| Conservative | 31 | |
| Liberal Democrats | 6 | |
| Green | 1 | |
| Independent | 1 | |
| Idle Toad | 1 | |
Divisional results
Burnley
Burnley Central East
| Party | Candidate | Votes | % | ± | |
|---|---|---|---|---|---|
| Labour | John Cavangh | 3,012 | 49.24 | ||
| Liberal Democrat | William Bennett | 2,169 | 35.46 | ||
| Conservative | David Tierney | 936 | 15.30 | ||
| Majority | 843 | 13.78 | |||
| Turnout | 6,117 | ||||
| Labour hold | Swing | ||||
Burnley Central West
| Party | Candidate | Votes | % | ± | |
|---|---|---|---|---|---|
| Labour | Tony Martin | 2,356 | 37.55 | ||
| Conservative | Peter Doyle | 1,477 | 23.54 | ||
| Liberal Democrat | Denise Embra | 1,339 | 21.34 | ||
| BNP | John Cave | 1,102 | 17.56 | ||
| Majority | 879 | 14.01 | |||
| Turnout | 6,274 | ||||
| Labour hold | Swing | ||||
Burnley North East
| Party | Candidate | Votes | % | ± | |
|---|---|---|---|---|---|
| Labour | Terry Burns | 2,418 | 40.43 | ||
| Liberal Democrat | Martin Smith | 1,949 | 32.59 | ||
| BNP | David Shapcott | 838 | 13.84 | ||
| Conservative | Jeffrey Pickup | 776 | 12.97 | ||
| Majority | 469 | 7.84 | |||
| Turnout | 5,981 | ||||
| Labour hold | Swing | ||||
Burnley Rural
| Party | Candidate | Votes | % | ± | |
|---|---|---|---|---|---|
| Labour | Stephen Large | 2,410 | |||
| Conservative | David Heginbotham | 2,103 | |||
| Liberal Democrat | Peter McCann | 1,829 | |||
| BNP | David Thomson | 1,204 | |||
| Majority | 307 | ||||
| Turnout | 7,546 | ||||
| Labour hold | Swing | ||||
Burnley South West
| Party | Candidate | Votes | % | ± | |
|---|---|---|---|---|---|
| Labour | Maureen Martin | 2,411 | |||
| Liberal Democrat | Charles Bullas | 2,007 | |||
| BNP | 1,191 | Derek Dawson | |||
| Conservative | Ida Carmichael | 977 | |||
| Majority | 404 | ||||
| Turnout | 6,586 | ||||
| Labour hold | Swing | ||||
Padiham and Burnley West
| Party | Candidate | Votes | % | ± | |
|---|---|---|---|---|---|
| Labour | Marcus Johnstone | 2,377 | |||
| Liberal Democrat | Mary McCann | 1,393 | |||
| BNP | Sharon Wilkinson | 1,363 | |||
| Conservative | Laura Dowding | 1,125 | |||
| Majority | 984 | ||||
| Turnout | 6,258 | ||||
| Labour hold | Swing | ||||
Chorley
Chorley East
| Party | Candidate | Votes | % | ± | |
|---|---|---|---|---|---|
| Labour | Don Yates | 3,542 | |||
| Conservative | Roger Livesey | 1,805 | |||
| Majority | 1,737 | ||||
| Turnout | 5,347 | ||||
| Labour hold | Swing | ||||
Chorley North
| Party | Candidate | Votes | % | ± | |
|---|---|---|---|---|---|
| Conservative | Mark Perks | 3,279 | |||
| Labour | Sharon Woodruff-Gray | 2,752 | |||
| Liberal Democrat | Glenda Charlesworth | 1,591 | |||
| Majority | 527 | ||||
| Turnout | 7,622 | ||||
| Conservative hold | Swing | ||||
Chorley Rural East
| Party | Candidate | Votes | % | ± | |
|---|---|---|---|---|---|
| Conservative | Mary Case | 3,826 | |||
| Labour | Thomas Robinson | 3,372 | |||
| Green | Matthew Sims | 1,035 | |||
| Majority | 454 | ||||
| Turnout | 8,233 | ||||
| Conservative hold | Swing | ||||
Chorley Rural North
| Party | Candidate | Votes | % | ± | |
|---|---|---|---|---|---|
| Conservative | Margaret Livesey | 2,442 | |||
| Labour | James Freeman | 2,160 | |||
| Liberal Democrat | Stephen Fenn | 1,380 | |||
| Majority | 282 | ||||
| Turnout | 5,982 | ||||
| Conservative hold | Swing | ||||
Chorley Rural West
| Party | Candidate | Votes | % | ± | |
|---|---|---|---|---|---|
| Labour | Alan Whittaker | 3,840 | |||
| Conservative | Keith Iddon | 3,833 | |||
| Majority | 7 | ||||
| Turnout | 7,673 | ||||
| Labour hold | Swing | ||||
Chorley South
| Party | Candidate | Votes | % | ± | |
|---|---|---|---|---|---|
| Labour | Peter Wilson | 2,972 | |||
| Conservative | Lawrence Catterall | 1,602 | |||
| Liberal Democrat | 988 | ||||
| Majority | 1,370 | ||||
| Turnout | 5,562 | ||||
| Labour hold | Swing | ||||
Chorley West
| Party | Candidate | Votes | % | ± | |
|---|---|---|---|---|---|
| Labour | Edward Forshaw | 3,369 | |||
| Conservative | Harold Heaton | 2,770 | |||
| Liberal Democrat | Kenneth Ball | 2,228 | |||
| Majority | 599 | ||||
| Turnout | 8,367 | ||||
| Labour hold | Swing | ||||
Fylde
Fylde East
| Party | Candidate | Votes | % | ± | |
|---|---|---|---|---|---|
| Independent | Elizabeth Oades | 2,309 | |||
| Conservative | Peter Sowden | 2,051 | |||
| Labour | Adrian Hutton | 1,207 | |||
| Liberal Democrat | Willian Winlow | 670 | |||
| Majority | 258 | ||||
| Turnout | 6,237 | ||||
| Independent gain from Conservative | Swing | ||||
Fylde South
| Party | Candidate | Votes | % | ± | |
|---|---|---|---|---|---|
| Conservative | Bernard Whittle | 2,954 | |||
| Labour | Michelle Miles | 1,430 | |||
| Liberal Democrat | Patricia Fielding | 1,041 | |||
| Majority | 1,524 | ||||
| Turnout | 6,233 | ||||
| Conservative hold | Swing | ||||
Fylde West
| Party | Candidate | Votes | % | ± | |
|---|---|---|---|---|---|
| Conservative | Joyce Stuart | 3,426 | |||
| Labour | Nicholas Wareing | 1,534 | |||
| Liberal Democrat | John Graddon | 1,273 | |||
| Majority | 1,892 | ||||
| Turnout | 6,233 | ||||
| Conservative hold | Swing | ||||
Lytham
| Party | Candidate | Votes | % | ± | |
|---|---|---|---|---|---|
| Conservative | Timothy Ashton | 3,647 | |||
| Labour | Marjorie Sherwood | 1,437 | |||
| Liberal Democrat | Michael Turner | 1,065 | |||
| Majority | 2,210 | ||||
| Turnout | 6,249 | ||||
| Conservative hold | Swing | ||||
St Annes North
| Party | Candidate | Votes | % | ± | |
|---|---|---|---|---|---|
| Conservative | Colin Walton | 2,640 | |||
| Liberal Democrat | Howard Henshaw | 2,152 | |||
| Labour | |||||
| Majority | 488 | ||||
| Turnout | 6,302 | ||||
| Conservative hold | Swing | ||||
St Annes South
| Party | Candidate | Votes | % | ± | |
|---|---|---|---|---|---|
| Conservative | Alfred Jealous | 2,601 | |||
| Liberal Democrat | Karen Henshaw | 2,096 | |||
| Labour | Dennis Davenport | 1,384 | |||
| Majority | 505 | ||||
| Turnout | 6,081 | ||||
| Conservative hold | Swing | ||||
Hyndburn
Accrington North
| Party | Candidate | Votes | % | ± | |
|---|---|---|---|---|---|
| Labour | Jean Battle | 3,561 | |||
| Conservative | Janet Storey | 2,323 | |||
| Majority | 1,238 | ||||
| Turnout | 5,884 | ||||
| Labour hold | Swing | ||||
Accrington South
| Party | Candidate | Votes | % | ± | |
|---|---|---|---|---|---|
| Labour | Wendy Dwyer | 3,288 | |||
| Conservative | Paul Barton | 2,394 | |||
| Majority | 984 | ||||
| Turnout | 5,592 | ||||
| Labour hold | Swing | ||||
Accrington West
| Party | Candidate | Votes | % | ± | |
|---|---|---|---|---|---|
| Labour | Doreen Pollitt | 3,201 | |||
| Conservative | Mohammed Siddique | 1,978 | |||
| Majority | 1,223 | ||||
| Turnout | 5,179 | ||||
| Labour hold | Swing | ||||
Great Harwood
| Party | Candidate | Votes | % | ± | |
|---|---|---|---|---|---|
| Labour | Susan Shorrock | 2,241' | |||
| Conservative | Winifred Frankland | 2,086 | |||
| Liberal Democrat | George Slynn | 818 | |||
| Majority | 155 | ||||
| Turnout | 5,145 | ||||
| Labour hold | Swing | ||||
Oswaldtwistle
| Party | Candidate | Votes | % | ± | |
|---|---|---|---|---|---|
| Labour | Dorothy Westell | 2,918 | |||
| Conservative | Peter Britcliffe | 2,244 | |||
| Liberal Democrat | Clive Fisher | 1,149 | |||
| Majority | 674 | ||||
| Turnout | 6,311 | ||||
| Labour hold | Swing | ||||
Rishton and Clayton-le-Moors
| Party | Candidate | Votes | % | ± | |
|---|---|---|---|---|---|
| Labour | Miles Parkinson | 2,958 | |||
| Conservative | Ann Scaife | 2,539 | |||
| Liberal Democrat | William Greene | 970 | |||
| Majority | 419 | ||||
| Turnout | 6,467 | ||||
| Labour hold | Swing | ||||
Lancaster
Heysham
| Party | Candidate | Votes | % | ± | |
|---|---|---|---|---|---|
| Labour | Jean Yates | 2,453 | 39.30 | ||
| Conservative | Kenneth Brown | 2,214 | 35.48 | ||
| Liberal Democrat | William Riley | 792 | 12.69 | ||
| Independent | Michael Greenall | 607 | 9.73 | ||
| Green | Stephen Dickenson | 175 | 2.80 | ||
| Majority | 239 | 3.83 | |||
| Turnout | 6,241 | ||||
| Labour hold | Swing | ||||
Lancaster Central
| Party | Candidate | Votes | % | ± | |
|---|---|---|---|---|---|
| Green | Christopher Coates | 2,252 | 31.43 | ||
| Labour | Michael Gibson | 2,102 | 29.33 | ||
| Conservative | Helen Helme | 1,821 | 25.41 | ||
| Liberal Democrat | Catherine Fritz | 991 | 13.83 | ||
| Majority | 150 | 2.09 | |||
| Turnout | 7,166 | ||||
| Green hold | Swing | ||||
Lancaster East
| Party | Candidate | Votes | % | ± | |
|---|---|---|---|---|---|
| Labour | Elizabeth Scott | 2,240 | 41.60 | ||
| Green | Matthew Wottoon | 1,482 | 27.52 | ||
| Liberal Democrat | Philip Dunster | 882 | 16.38 | ||
| Conservative | Joan Jackson | 781 | 14.50 | ||
| Majority | 758 | 14.08 | |||
| Turnout | 5,385 | ||||
| Labour hold | Swing | ||||
Lancaster Rural East
| Party | Candidate | Votes | % | ± | |
|---|---|---|---|---|---|
| Conservative | Susan Charles | 3,947 | 44.55 | ||
| Liberal Democrat | Joyce Pritchard | 2,560 | 28.89 | ||
| Labour | Benjamin Soffa | 1,768 | 19.95 | ||
| Green | Abigail Mills | 585 | 6.60 | ||
| Majority | 1,387 | 15.65 | |||
| Turnout | 8,860 | ||||
| Conservative hold | Swing | ||||
Lancaster Rural North
| Party | Candidate | Votes | % | ± | |
|---|---|---|---|---|---|
| Conservative | Sarah Fishwick | 2,518 | 36.32 | ||
| Labour | Janette Gardner | 1,902 | 27.43 | ||
| Liberal Democrat | June Greenwell | 1,396 | 20.14 | ||
| Independent | Keith Budden | 781 | 11.26 | ||
| Green | Ian McCulloch | 336 | 4.85 | ||
| Majority | 616 | 8.89 | |||
| Turnout | 6,933 | ||||
| Conservative hold | Swing | ||||
Lancaster South East
| Party | Candidate | Votes | % | ± | |
|---|---|---|---|---|---|
| Labour | Peter Elliott | 1,862 | 37.23 | ||
| Conservative | Clare Hilley | 1,370 | 27.39 | ||
| Liberal Democrat | Robert Hayes | 1,370 | 27.39 | ||
| Green | Susanna Holden | 395 | 7.90 | ||
| Majority | 448 | 9.76 | |||
| Turnout | 5,001 | ||||
| Labour gain from Conservative | Swing | ||||
Morecambe North
| Party | Candidate | Votes | % | ± | |
|---|---|---|---|---|---|
| Conservative | Anthony Jones | 2,667 | 44.85 | ||
| Labour | Elaine Bush | 1,840 | 30.94 | ||
| Liberal Democrat | Ian Clift | 18.31 | |||
| Green | Pamela White | 351 | 5.90 | ||
| Majority | 827 | 13.91 | |||
| Turnout | 5,947 | ||||
| Conservative gain from Labour | Swing | ||||
Morecambe South
| Party | Candidate | Votes | % | ± | |
|---|---|---|---|---|---|
| Labour | Albert Thornton | 2,554 | 38.64 | ||
| Liberal Democrat | Ronald Day | 1,927 | 29.15 | ||
| Conservative | Gordon Hagel | 1,898 | 28.71 | ||
| Green | Howard Jago | 231 | 3.49 | ||
| Majority | 627 | 9.49 | |||
| Turnout | 6,610 | ||||
| Labour hold | Swing | ||||
Morecambe West
| Party | Candidate | Votes | % | ± | |
|---|---|---|---|---|---|
| Labour | Janice Hanson | 2,904 | 53.32 | ||
| Conservative | John Mace | 1,331 | 24.44 | ||
| Liberal Democrat | Michael Gradwell | 983 | 18.05 | ||
| Green | Mark Westcombe | 228 | 4.19 | ||
| Majority | 1,573 | 28.88 | |||
| Turnout | 5,446 | ||||
| Labour hold | Swing | ||||
Skerton
| Party | Candidate | Votes | % | ± | |
|---|---|---|---|---|---|
| Labour | Nicola Penney | 3,096 | 59.93 | ||
| Conservative | Anthony Johnson | 1,347 | 26.07 | ||
| Green | Ashley Toms | 723 | 14.00 | ||
| Majority | 1,749 | 33.86 | |||
| Turnout | 5,166 | ||||
| Labour hold | Swing | ||||
Pendle
| Seat | Winning Party | Majority | |
|---|---|---|---|
| Brierfield and Nelson North | Liberal Democrats | 778 | |
| Nelson South | Liberal Democrats | 52 | |
| Pendle Central | Labour | 523 | |
| Pendle East | Conservative | 342 | |
| Pendle West | Conservative | 1,767 | |
| West Craven | Liberal Democrats | 392 |
Preston
| Seat | Winning Party | Majority | |
|---|---|---|---|
| Preston Central North | Labour | 391 | |
| Preston Central South | Labour | 1,274 | |
| Preston City | Labour | 1,157 | |
| Preston East | Labour | 1,543 | |
| Preston North | Conservative | 849 | |
| Preston North East | Conservative | 529 | |
| Preston North West | Labour | 675 | |
| Preston Rural | Conservative | 2,412 | |
| Preston South East | Labour | 1,199 | |
| Preston West | Liberal Democrats | 940 |
Ribble Valley
| Seat | Winning Party | Majority | |
|---|---|---|---|
| Clitheroe | Liberal Democrat | 383 | |
| Longridge with Bowland | Conservative | 1,893 | |
| Ribble Valley North East | Conservative | 2,403 | |
| Ribble Valley South West | Conservative | 2,481 |
Rossendale
| Seat | Winning Party | Majority | |
|---|---|---|---|
| Rossendale East | Conservative | 167 | |
| Rossendale North | Labour | 43 | |
| Rossendale South | Conservative | 34 | |
| Rossendale West | Labour | 57 | |
| Whitworth | Labour | 309 |
South Ribble
| Seat | Winning Party | Majority | |
|---|---|---|---|
| Bamber Bridge and Walton-le-Dale | Labour | 601 | |
| Farington | Labour | 531 | |
| Leyland Central | Labour | 1,307 | |
| Leyland South West | Labour | 1,427 | |
| Penwortham North | Liberal Democrats | 391 | |
| Penwortham South | Labour | 923 | |
| South Ribble Rural East | Idle Toad | 959 | |
| South Ribble Rural West | Conservative | 2,165 |
West Lancashire
| Seat | Winning Party | Majority | |
|---|---|---|---|
| Ormskirk West | Labour | 76 | |
| Skelmersdale Central | Labour | 2,872 | |
| Skelmersdale East | Labour | 1,330 | |
| Skelmersdale West | Labour | 3,516 | |
| West Lancashire East | Conservative | 1,020 | |
| West Lancashire North | Conservative | 2,063 | |
| West Lancashire South | Conservative | 1,657 | |
| West Lancashire West | Conservative | 259 |
Wyre
| Seat | Winning Party | Majority | |
|---|---|---|---|
| Amounderness | Conservative | 857 | |
| Fleetwood East | Labour | 1,555 | |
| Fleetwood West | Labour | 974 | |
| Garstang | Conservative | 2,387 | |
| Poulton-le-Fylde | Conservative | 1,542 | |
| Thornton-Cleveleys Central[1] | Conservative | 341 | |
| Thornton-Cleveleys North | Labour | 643 | |
| Wyreside | Conservative | 2,236 |
Notes
- ↑ Following the death of the Councillor for Thorton-Cleveleys Central, a by-election was held which saw the Conservatives retain the seat with an increased majority of 602. Source: Lancashire County Council
| County Council | |
|---|---|
| Blackburn with Darwen | |
| Blackpool | |
| Burnley | |
| Chorley | |
| Fylde | |
| Hyndburn | |
| Lancaster | |
| Pendle | |
| Preston | |
| Ribble Valley |
|
| Rossendale | |
| South Ribble | |
| West Lancashire | |
| Wyre | |
| |
| County council elections |
|
|---|---|
| Unitary authorities |
|
| District councils (Northern Ireland) | |
| Sui generis |
|
| Mayoral elections |
|
| |
This article is issued from Wikipedia - version of the 12/3/2016. The text is available under the Creative Commons Attribution/Share Alike but additional terms may apply for the media files.