Kilbride (electoral district)
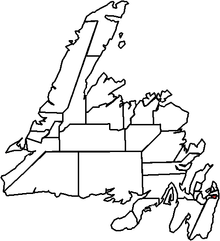 Kilbride in relation to other districts in Newfoundland | |
| Defunct provincial electoral district | |
| Legislature | Newfoundland and Labrador House of Assembly |
| District created | 1975 |
| First contested | 1975 |
| Last contested | 2011 |
| Demographics | |
| Population (2006) | 11,701 |
| Electors (2011) | 10,251 |
Kilbride is a provincial electoral district for the House of Assembly of Newfoundland and Labrador, Canada. As of 2011, there are 10,251 eligible voters living within the district.[1]
The district makes up the southern portion of the city of St. John's, including the rural neighbourhoods of the Goulds and Kilbride. Agriculture is an important industry in the district.
It has been one of the strongest Progressive Conservative (PC) districts in the Newfoundland and Labrador, voting 85% for the Torys in the 2007 election. Since its creation, it has always returned a PC MHA to the House of Assembly.
Members of the House of Assembly
The district has elected the following Members of the House of Assembly:
| Member | Party | Term | |
|---|---|---|---|
| John Dinn | Progressive Conservative | 2007–2015 | |
| Ed Byrne | Progressive Conservative | 1993–2007 | |
| Bob Aylward | Progressive Conservative | 1979–1993 | |
| Robert Wells | Progressive Conservative | 1975–1979 |
Election results
| Party | Candidate | Votes | % | ± | |
|---|---|---|---|---|---|
| Progressive Conservative | John Dinn | 3,347 | 58.43% | – | |
| NDP | Paul Boundridge | 1,927 | 33.64% | ||
| Liberal | Brian Hanlon | 454 | 7.93% | ||
| Party | Candidate | Votes | % | ± | |
|---|---|---|---|---|---|
| Progressive Conservative | John Dinn | 4,443 | 84.48% | – | |
| NDP | Michelle Broderick | 421 | 8.01% | ||
| Liberal | Roger Linehan | 364 | 6.92% | ||
| Independent | Paul Perrier | 31 | 0.59% | ||
| Party | Candidate | Votes | % | ± | |
|---|---|---|---|---|---|
| Progressive Conservative | John Dinn | 2,744 | 78.83 | +0.55 | |
| Liberal | Bob Clarke | 508 | 14.59 | -1.18 | |
| NDP | Gemma Schlamp-Hickey | 229 | 6.58 | +0.63 | |
| Total | 3,481 | 100% | |||
| Party | Candidate | Votes | % | ± | |
|---|---|---|---|---|---|
| Progressive Conservative | Ed Byrne | 5,315 | – | – | |
| Liberal | Joe Wadden | 1,071 | |||
| NDP | David Reynolds | 404 | |||
| Party | Candidate | Votes | % | ± | |
|---|---|---|---|---|---|
| Progressive Conservative | Ed Byrne | 4145 | – | – | |
| Liberal | Barbara Howlett | 2,133 | |||
| NDP | Lee Ingram | 289 | |||
| Independent | Vicki Stuckless | 289 | |||
References
- ↑ "Summary of Polling Divisions KILBRIDE" (PDF). Elections Newfoundland and Labrador. 3 August 2011. Retrieved 5 September 2011.
- ↑ Newfoundland & Labrador Votes 2007. Canadian Broadcasting Corporation. Retrieved May 22, 2009.
- ↑ Newfoundland & Labrador Votes 2003. Canadian Broadcasting Corporation. Retrieved May 22, 2009.
External links
This article is issued from Wikipedia - version of the 12/5/2015. The text is available under the Creative Commons Attribution/Share Alike but additional terms may apply for the media files.