Illinois's 1st congressional district
| Illinois's 1st congressional district | ||
|---|---|---|
.tif.png) | ||
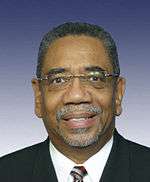
| Current Representative | Bobby Rush (D–Chicago) | |
| Area | 258 mi2 (669 km2) | |
| Distribution | 99.0% urban, 1.0% rural | |
| Population (2011 est.) | 711,982 | |
| Median income | $46,458 | |
| Ethnicity | 40.6% White, 51.3% Black, 2.0% Asian, 9.8% Hispanic, 0.2% Native American, 4.4% other | |
| Cook PVI | D+28[1][2] | |
Illinois' first congressional district is a congressional district in the U.S. state of Illinois. Based in Cook County, the district includes much of the South Side of Chicago, and continues southwest to Joliet.
From 2003 to early 2013 it extended into the city's southwest suburbs until reaching the border of Will County, and covered 97.84 square miles (253.4 km2), making it one of the 40 smallest districts in the U.S. (although there are four smaller districts in Illinois). The district had a population that was 65% African American, the highest percentage of any congressional district in the nation. It includes the home of President Barack Obama.
Since redistricting by the state legislature after the 2010 census, since January 3, 2013 it is a majority-minority district, now with 51.3% African American, 40.6% white, and 9.8% Hispanic population. The district is represented by Democrat Bobby Rush, who was re-elected in 2014, and has been elected continuously in the 1st district since 1992.
2011 redistricting
In 2011, following the 2010 census, the state legislature redistricted. It expanded the district to cover parts of Cook and Will Counties. After redistricting, all or parts of Alsip, Blue Island, Calumet Park, Chicago, Country Club Hills, Crestwood, Dixmoor, Elwood, Evergreen Park, Frankfort, Frankfort Square, Harvey, Manhattan, Markham, Merrionette Park, Midlothian, Mokena, New Lenox, Oak Forest, Oak Lawn, Orland Hills, Orland Park, Palos Heights, Posen, Riverdale, Robbins, Tinley Park, and Worth are included.[3] The representative for these districts were elected in the 2012 primary and general elections, and the boundaries became effective on January 3, 2013.
Composition until 2013
The district was adjacent to the 2nd District to the east and south, the 7th District to the north, and the 3rd and 13th Districts to the west, and also bordered the 11th District at its southwest corner. The district's northeast border followed Lake Michigan's shoreline for almost a mile.
The district was created following the 1830 U.S. Census and came into existence in 1833, five months before Chicago was organized as a town; the state was previously represented in the U.S. House of Representatives with representative elected on an at-large basis. The district included Southwestern Illinois until 1853.[4][5] It included the state's northern edge until 1863.[6] Since that time, the district has included all or part of Cook County; since 1883 the population of the district has been primarily residing on Chicago's South Side. Historical populations reflected waves of immigration into the area: previous majority populations were ethnic Irish, German, and east European. Beginning in the mid-19th century, the Irish were the first to establish their physical and political control of the area within the city's South Side.
The current 1st district has a minority-majority population: 51.3% of the residents are African-American.[2] It has been represented in Congress by African Americans since 1929. Tens of thousands of African Americans moved to Chicago from the rural South in the Great Migration. They were confined by discrimination to the South Side of Chicago and gradually replaced ethnic whites who moved out to suburbs. This has been one of the most reliably Democratic districts in the country, although not to the extent that it was during the 1980s, when more than 90% of the district's residents were black.[7]
The district has not elected a Republican to the U.S. House of Representatives since 1932. After the civil rights movement gained support from national Democratic Party for major legislation to restore constitutional rights, including the franchise in the South, most African Americans shifted to support the Democratic Party. Democratic congressional candidates routinely receive over 80% of the vote here.
Geography
Based in Chicago, the district includes the neighborhoods of Auburn Gresham, Burnside, Chatham and Greater Grand Crossing; almost all of West Englewood; the portion of Englewood south of 57th Street; the portion of Woodlawn west of Stony Island Avenue (i.e. excluding Jackson Park); the southern half of Kenwood (home of President Barack Obama); the eastern portion of Ashburn; parts of Avalon Park, Calumet Heights, Chicago Lawn, Douglas, Grand Boulevard, Hyde Park, Morgan Park, New City, Oakland, Roseland, South Shore, Washington Heights and Washington Park; the portion of Beverly southeast of 97th Street and Prospect Avenue; the portion of West Pullman southwest of 119th Street and Racine Avenue; and approximately two square blocks at the northwest corner of South Chicago.
The district's area south of 95th Street is almost entirely west of Interstate 57). The district includes the municipalities of Crestwood, Evergreen Park, Midlothian, Posen and Robbins, nearly all of Alsip, Blue Island and Oak Forest, parts of Calumet Park, Dixmoor, Markham, Orland Hills, Orland Park, Palos Heights, Tinley Park and Worth, and some small sections of Country Club Hills and Riverdale.
Demographics
In the twentieth century after the Great Migration from the South and concentration of blacks on the South Side due to de facto residential segregation, the district became the nation's first with a black-majority population. Since the 1920s, it has included the central area of Chicago's South Side African-American community. Over 85% of the district's residents were black during the period from the 1950s through the 1980s, but redistricting since that time – which redrew the district lines with the goal of maintaining three Chicago districts with black populations exceeding 60% – has reduced the percentage of black residents in the district to 70% in the 1990s. The current figure is 65%. Outward migration has caused the South Side's population to decrease over the years, and the district was expanded geographically to the southwest to gain residents, particularly as the state's congressional delegation has been reduced in numbers due to population changes and reapportionment. The district, which covered only nine square miles in the 1950s, is now more than ten times that size. Nearly half its current area was added for the 2000s.
The district's population dropped by 27% in the 1950s,[8] and by 20% in both the 1970s and 1980s, due to outward migration for suburbanization and because of people leaving the area due to loss of jobs.[7][9] In redistricting after the 1990 U.S. Census, the district was extended into the suburbs for the first time in 90 years. Chicago is home to 70% of the district's residents (down from 90% in the 1990s),[10] although roughly 60% of the district's area is outside the city border. The district's white population (almost 30% of its residents) is concentrated in the suburban areas and in a few Chicago neighborhoods such as Hyde Park.[11] The district's largest white ethnic groups are Irish (7.1%), German (6.2%), Polish (4.5%) and Italian (3.2%),[12] mirroring the demographics of the neighboring third and thirteenth Congressional Districts. There are also sizable Dutch, Swedish, Czech, Palestinian, Greek and Lithuanian populations in the area of Oak Forest, Orland Park and Tinley Park, the district's three largest suburbs.
The Kenwood-Hyde Park area for several decades had a significant Jewish community. Existing buildings attest to its history, as the former Kehilath Anshe Ma'ariv temple (its second location) has been the headquarters of Jesse Jackson's Operation PUSH/Rainbow Coalition since 1971 . The area also includes a notable presence of Black Muslims and is the home of Nation of Islam leader Louis Farrakhan in Kenwood.
As of 2000, 38% of the district's adult residents were married. Template:Needs expansion for other demographic data if this is to be included
Presidential election results
- This table indicates how the district has voted in U.S. presidential elections; election results reflect voting in the district as it was configured at the time of the election, not as it is configured today. The candidate who received the most votes in the district is listed first; the candidate who won the election nationally is in CAPS, and the candidate who won the state of Illinois is indicated with a †.
| Election | District winner | Runner up | Other candidates |
|---|---|---|---|
| 1852[13] | Scott (W), 6,992 (42%) | PIERCE† (D), 6,948 (41%) | Hale (Free Soil), 2,885 (17%) |
| 1856[13] | Frémont (R), 18,247 (73%) | BUCHANAN† (D), 5,991 (24%) | Fillmore (American), 677 (3%) |
| 1860[13] | LINCOLN† (R), 21,436 (70%) | Douglas (D), 8,940 (29%) | Bell (Constitutional Union), 99 (0.3%); Breckinridge (D), 62 (0.2%) |
| 1864[13] | LINCOLN† (R), 18,667 (81%) | McClellan (D), 4,351 (19%) | |
| 1868[13] | GRANT† (R), 27,527 (59%) | Seymour (D), 19,104 (41%) | |
| 1872 … 1948 |
[Data unknown/missing. You can help!] | ||
| 1952[14] | Stevenson (D), 99,224 (75%) | EISENHOWER† (R), 33,805 (25%) | |
| 1956[14] | Stevenson (D), 68,266 (64%) | EISENHOWER† (R), 38,827 (36%) | |
| 1960[15] | KENNEDY† (D), 75,938 (77.80%) | Nixon (R), 21,660 (22.19%)} | |
| 1964[16] | JOHNSON† (D), 150,953 (84.91%) | Goldwater (R), 26,823 (15.08%) | |
| 1968[17] | Humphrey (D), 138,835 (93%) | NIXON† (R), 10,081 (7%) | Wallace (AIP), 1,010 (1%) |
| 1972[18] | McGovern (D), 145,003 (90%) | NIXON† (R), 16,998 (10%) | |
| 1976[19] | CARTER (D), 130,882 (90%) | Ford† (R), 13,817 (10%) | |
| 1980[20] | Carter (D), 128,426 (91%) | REAGAN† (R), 6,633 (5%) | Anderson (Indep.), 3,092 (2%) |
| 1984[21] | Mondale (D), 196,351 (95%) | REAGAN† (R), 10,153 (5%) | |
| 1988[22] | Dukakis (D), 174,793 (95%) | G. H. W. BUSH† (R), 7,168 (4%) | |
| 1992[23] | CLINTON† (D), 214,104 (81%) | G. H. W. Bush (R), 32,803 (12%) | Perot (Indep.), 17,355 (7%) |
| 1996[24] | CLINTON† (D), 179,767 (85%) | Dole (R), 22,914 (11%) | Perot (Reform), 6,378 (3%) |
| 2000[25] | Gore† (D), 194,432 (87%) | G. W. BUSH (R), 24,276 (11%) | Nader (Green), 2,867 (1%) |
| 2004[26] | Kerry† (D), 234,086 (83%) | G. W. BUSH (R), 47,533 (17%) | |
| 2008[2] | OBAMA† (D) 287,240 (81%) | McCain (R) 66,840 (19%) | |
| 2012[2] | OBAMA† (D) 262,836 (79%) | Mitt Romney (R) 67,557 (20%) | |
Economy
The departure of the steel industry, along with other manufacturing jobs from the South Side in recent decades, has created economic difficulties which the area is still trying to overcome. The district's median household income as of 2000, $37,222, trailed the national average by 11.4%. The unemployment rate (7.6%) was more than double the national rate, and nearly 20% of district residents were living in poverty. These problems are more pronounced within the Chicago portion of the district – 14 of the district's 18 suburbs had median household incomes over $40,000 as of 1999, with the six most affluent grouped in the southwest corner of the district. But black middle-class Chicago neighborhoods, such as Avalon Park and Chatham, have remained more stable, along with the more upscale Hyde Park-Kenwood area. Health care and higher education now constitute major economic sectors in the region.
Hospitals in the district include Oak Forest Hospital in Oak Forest and Provident Hospital of Cook County in Grand Boulevard, both part of the Cook County Bureau of Health Services; as well as the University of Chicago Hospitals in Hyde Park, Little Company of Mary Hospital in Evergreen Park, Holy Cross Hospital in Chicago Lawn, St. Francis Hospital in Blue Island, Jackson Park Hospital in South Shore and St. Bernard Hospital in Englewood.
Local educational institutions include the University of Chicago in Hyde Park, Illinois Institute of Technology (IIT) in Douglas, Trinity Christian College in Palos Heights and Kennedy-King College, a Chicago city college, in Englewood, and Chicago State University in Roseland is located directly outside the district at its southern edge; in addition, there are five seminaries in Hyde Park: Catholic Theological Union, Chicago Theological Seminary, Lutheran School of Theology, McCormick Theological Seminary and Meadville Lombard Theological School.
U.S. Cellular Field, home of the Chicago White Sox, is less than 1,000 feet (300 m) west of the district's northwestern border. Other area cultural and entertainment attractions include the DuSable Museum of African American History in Chicago's Washington Park, and First Midwest Bank Amphitheatre in Tinley Park; several square miles of Cook County Forest Preserves can be found on three sides of Oak Forest, and Oak Forest's Chicago Gaelic Park is home to Irish Fest, held annually on Memorial Day weekend. Business and industrial presences in the district include Panduit Corporation , an electrical manufacturer in Tinley Park; Parco Foods , a cookie manufacturer in Blue Island; and Midwest Suburban Publishing, publisher of the SouthtownStar, in Tinley Park.
In addition to Washington Park and those sites associated with the University of Chicago and IIT, district locations on the National Register of Historic Places include:
|
|
Politics
Democrats routinely dominate politics in the district, with the main focus of competition being the party primary. Only twice since 1966 has a Republican candidate for Congress received over 20% of the vote,[27] and the Democratic nominee has topped 80% in every presidential race during that time. The district's expansion into the suburbs in the 1990s has incorporated a population that has voted Republican more often; Republican support has passed the 10% mark, and George W. Bush received 17% of the vote here in 2004. His was the best showing by a Republican presidential candidate in the district in over 40 years.
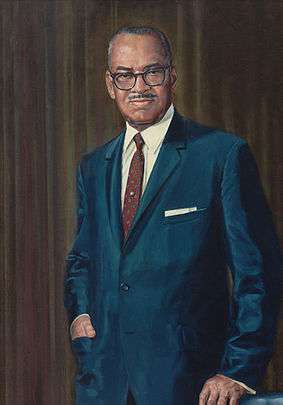
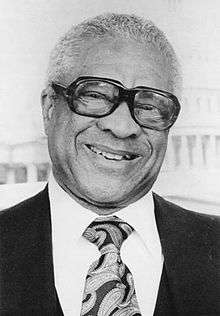
The district has since the early 1970s elected representatives who dissented from the city's Democratic establishment. William L. Dawson, U.S. Representative from 1943 to 1970, maintained the district's loyalty to Mayor Richard J. Daley. His successor Ralph Metcalfe initially continued that stance but publicly broke with Daley over an incident of police brutality in 1972, establishing a rift that persists. When Metcalfe died less than one month before the election in 1978, Democratic party officials named loyalist Bennett M. Stewart to take his place on the ballot, and Republicans replaced their candidate with A.A. "Sammy" Rayner, a former Democratic alderman. Despite the campaign support of Jackson for Rayner, Stewart won the election, although Rayner did get over 40% of the vote.[28][29]
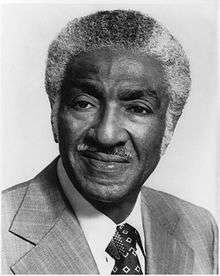
Stewart served only one term and lost the 1980 Democratic primary to reform candidate Harold Washington. He left Congress in 1983 upon being elected mayor, after winning a contentious three-way primary with 37% of the vote. His successor in Congress was union organizer Charles Hayes. Hayes lost the 1992 primary to Bobby Rush by a 42%–39% margin following the House banking scandal, in which it was revealed that Hayes had 716 overdrafts on his congressional checking account.[30] Rush had previously lost the 1988 and 1990 primaries to Hayes.
Rush was a co-founder of the Illinois Black Panthers in 1968, establishing a program for free breakfasts for poor children and a clinic for sickle cell anemia screenings.[31] He became a Chicago alderman from 1983 until his election to Congress, and was an ally of Mayor Washington in the Council Wars of the 1980s. He has maintained a solidly liberal voting record in Congress, consistently voting the Democratic position over 90% of the time. When he has broken from the party, it has usually been to take even more liberal positions, rather than that held by Republicans.[32] Rush opposed incumbent Richard M. Daley in the 1999 election for Mayor of Chicago, but despite the support of fellow congressmen Jesse Jackson, Jr. and Danny Davis, he was backed by only three out of 50 aldermen and lost the election by a margin of 72%–28%. He had a 55%–45% advantage among black voters. In the 2000 congressional primary Rush emerged with a 61%–30% win over challenger Barack Obama.[33] Redistricting following the 2000 U.S. Census moved Obama's home into the second district, although he has since moved back into the first district.
In Congress, Rush has focused on urban revitalization issues, and he was a staunch supporter of gun control efforts before his adult son Huey (named for Black Panther leader Huey Newton) was killed in a 1999 mugging.[31] Rush has generally received perfect ratings of 100 from labor groups including the AFL-CIO and AFSCME, and occasionally also from Americans for Democratic Action, the ACLU and the National Abortion Rights Action League. He received corresponding 0 ratings from the American Conservative Union in six of his first 12 years in office.[26][34][35]
List of representatives
| Representative | Party | Years | Electoral history | District boundaries |
|---|---|---|---|---|
 Charles Slade Charles Slade |
Jacksonian | March 4, 1833 – July 26, 1834 |
Died | The district included the sixteen counties in the state's southwestern section: Alexander, Bond, Clinton, Franklin, Gallatin, Jackson, Johnson, Macoupin, Madison, Monroe, Perry, Pope, Randolph, St. Clair, Union and Washington counties (five additional counties were later created within this area).[4] |
| Vacant | July 26, 1834 – December 1, 1834 | |||
 John Reynolds John Reynolds |
Jacksonian | December 1, 1834 – March 3, 1837 |
Lost re-election | |
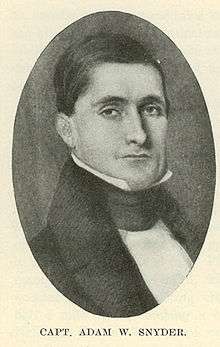 Adam W. Snyder Adam W. Snyder |
Democratic | March 4, 1837 – March 3, 1839 |
Retired | |
| John Reynolds |
Democratic | March 4, 1839 – March 3, 1843 |
[Data unknown/missing. You can help!] | |
 Robert Smith Robert Smith |
Democratic | March 4, 1843 – March 3, 1847 |
[Data unknown/missing. You can help!] | The district was reduced in size, and now included eleven counties: Alexander, Bond, Clinton, Jackson, Madison, Monroe, Perry, Randolph, St. Clair, Union and Washington counties.[5] |
| Independent Democrat | March 4, 1847 – March 3, 1849 | |||
 William H. Bissell William H. Bissell |
Democratic | March 4, 1849 – March 3, 1853 |
[Data unknown/missing. You can help!] | |
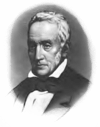
 Elihu B. Washburne Elihu B. Washburne |
Whig | March 4, 1853 – March 3, 1855 |
[Data unknown/missing. You can help!] | The district was shifted north to cover the eight counties along the state's northern edge: Boone, Carroll, Jo Daviess, Lake, McHenry, Ogle, Stephenson and Winnebago counties.[6] Ulysses S. Grant was a district resident in 1860–61 during the period when he was out of the Army, working in his family's store in Galena, and he became acquainted with Congressman Elihu B. Washburne; Washburne became his political mentor and sponsor, and eventually became Grant's first Secretary of State. |
| Republican | March 4, 1855 – March 3, 1863 | |||
 Isaac N. Arnold Isaac N. Arnold |
Republican | March 4, 1863 – March 3, 1865 |
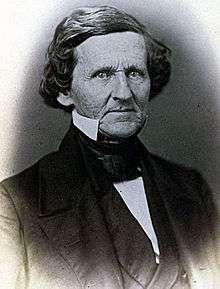
[Data unknown/missing. You can help!] | The district during this decade, beginning during the Civil War, consisted of all of Cook County.[36] Industrialist Cyrus McCormick was defeated in the 1864 House election as the Democratic candidate.[37] Later during this period, the district was devastated by the Great Chicago Fire in October 1871. |
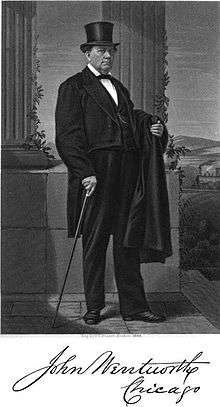 John Wentworth John Wentworth |
Republican | March 4, 1865 – March 3, 1867 |
[Data unknown/missing. You can help!] | |
 Norman B. Judd Norman B. Judd |
Republican | March 4, 1867 – March 3, 1871 |
Retired | |
 Charles B. Farwell Charles B. Farwell |
Republican | March 4, 1871 – March 3, 1873 |
[Data unknown/missing. You can help!] | |
 John B. Rice John B. Rice |
Republican | March 4, 1873 – December 17, 1874 |
Died | The district was restructured, and now included DuPage County, the thirteen townships comprising the southern half of Cook County (Bloom, Bremen, Calumet, Hyde Park, Lake, Lemont, Lyons, Orland, Palos, Rich, Riverside, Thornton, Worth), and the entire South Side and part of the West side of Chicago. The Chicago portion of the district began downtown and extended south to 39th Street (now Pershing Road) east of the Chicago River and south of the river and the Illinois and Michigan Canal, with its western boundary being Western Avenue; on the west side, the district included the area between 16th Street on the north and the river and canal on the south, with the city's western boundary then being Crawford Avenue (now Pulaski Road).[38] |
| Vacant | December 17, 1874 – February 1, 1875 | |||
 Bernard G. Caulfield Bernard G. Caulfield |
Democratic | February 1, 1875 – March 3, 1877 |
Elected to finish Rice's term Elected to the next full term Retired | |
 William Aldrich William Aldrich |
Republican | March 4, 1877 – March 3, 1883 |
Lost renomination | |
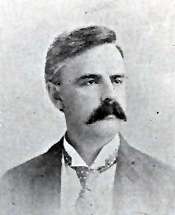
| Ransom W. Dunham |
Republican | March 4, 1883 – March 3, 1889 |
[Data unknown/missing. You can help!] | The district during this period remained identical to its previous configuration, except that it no longer included DuPage County or the portion of Chicago west of Clark Street between 16th and 39th Streets.[39] Illinois gained two additional representatives following the 1890 Census, but they were elected on an at-large basis for the 1893–1895 term before redistricting occurred, and the previous decade's districting remained in effect.[40] |
| Abner Taylor |
Republican | March 4, 1889 – March 3, 1893 |
Retired | |
 J. Frank Aldrich J. Frank Aldrich |
Republican | March 4, 1893 – March 3, 1895 |
Retired | |
| March 4, 1895 – March 3, 1897 |
The district now included the seven townships in southeastern Cook County (Bloom, Bremen, Calumet, Orland, Rich, Thornton, Worth), and the portion of Chicago's South Side bordered on the north by 26th Street, and on the west by Wentworth Avenue from 26th to 39th Streets and by State Street from 39th to 63rd Streets before following 63rd Street west to the city's border with Lyons Township (then at Cicero Avenue).[41] | |||
_in_1916.jpg) James Robert Mann James Robert Mann |
Republican | March 4, 1897 – March 3, 1903 |
[Data unknown/missing. You can help!] | |
| Martin Emerich |
Democratic | March 4, 1903 – March 3, 1905 |
Retired | The district was now confined to the city of Chicago for the first time, and included downtown and the area east of Wentworth to 43rd Street, also reaching west to include Armour Square as well as most of Bridgeport northeast of 33rd and Halsted Streets.[42] Illinois's districts were not redrawn until 1947, taking effect for the 1948 elections.[43] In 1928, Oscar De Priest became the first African American elected to Congress in the 20th century. |
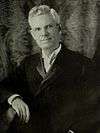 Martin B. Madden Martin B. Madden |
Republican | March 4, 1905 – April 27, 1928 |
Died | |
| Vacant | April 27, 1928 – March 3, 1929 | |||
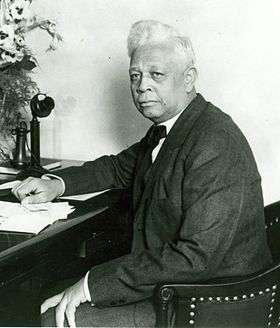 Oscar S. De Priest Oscar S. De Priest |
Republican | March 4, 1929 – January 3, 1935 |
Lost re-election | |
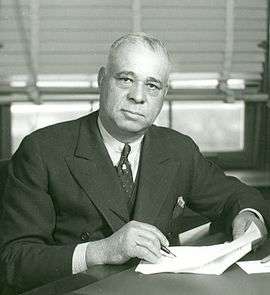 Arthur W. Mitchell Arthur W. Mitchell |
Democratic | January 3, 1935 – January 3, 1943 |
Retired | |
 William L. Dawson William L. Dawson |
Democratic | January 3, 1943 – January 3, 1949 |
Died | |
| January 3, 1949 – January 3, 1963 |
The district included that part of Chicago bounded on the north by the river; on the east by the lake to Pershing Road and by Cottage Grove Avenue from Pershing to 71st Street and South Chicago Avenue; on the south by Marquette Road from State Street to South Chicago Avenue, following that southeast to 71st and Cottage Grove; and on the west by Wallace Street (from the river to 25th Street), Canal Street (25th to 31st Street), Wentworth (31st to 43rd Street), the railroad between State and Wentworth (43rd to 59th Street) and State Street (59th to Marquette).[44] The same boundaries were maintained in the redistricting after 1950.[45] | |||
| January 3, 1963 – January 3, 1967 |
The district included that part of Chicago between 31st and 99th Streets bounded on the west by Wentworth (31st to Garfield Boulevard), the railroad 1/4-mile east of Halsted (Garfield to 59th), Halsted (59th to 63rd), State Street (63rd to 83rd) and Stewart Avenue (83rd to 99th), and bounded on the east by the lake (31st to 46th), Cottage Grove (46th to 65th) and Stony Island Avenue (65th to 99th).[46] | |||
| January 3, 1967 – November 9, 1970 |
There was additional redistricting in Illinois which took effect for the 1967–1969 term. All of the district's previous territory was retained, but it was extended further north as far as Cermak Road, with its western boundary being the railroad between State and Wentworth (Cermak to 28th Street) and then Wentworth (28th to Garfield). In addition, a small area east of Woodlawn Avenue between 46th and 47th Streets was added.[47] | |||
| Vacant | November 9, 1970 – January 3, 1971 | |||
 Ralph Metcalfe Ralph Metcalfe |
Democratic | January 3, 1971 – January 3, 1973 |
Died | |
| January 3, 1973 – October 10, 1978 |
The district included that part of Chicago between 31st and 103rd Streets bounded on the west by King Drive (31st to 35th), State (35th to Pershing), the railroad 1/4-mile west of State (Pershing to Garfield), King Drive (Garfield to Marquette), Yale Avenue (Marquette to 69th), Harvard Avenue (69th to 70th), Stewart (70th to 71st), Halsted (71st to 95th), the railroad 1/2-mile east of Halsted (95th to 99th) and State (99th to 103rd), and on the east by the lake (31st to 71st Street/South Shore Drive), Yates Boulevard (71st to 73rd), Jeffery Boulevard (73rd to 75th) and Stony Island, continuing onto the Calumet Expressway (75th to 103rd, with minor variation at 95th).[48] | |||
| Vacant | October 10, 1978 – January 3, 1979 | |||
 Bennett M. Stewart Bennett M. Stewart |
Democratic | January 3, 1979 – January 3, 1981 |
Lost renomination | |
 Harold Washington Harold Washington |
Democratic | January 3, 1981 – January 3, 1983 |
First elected in 1980 Re-elected in 1982 Resigned to become Mayor of Chicago | |
| January 3, 1983 – April 30, 1983 |
The district was now the only remaining district entirely within the city of Chicago, and included that area between Cermak Road and 103rd Street bounded on the west by Federal Street (Cermak to 25th), the railroad 1/4-mile west of State (25th to 35th), the railroad 1/2-mile east of Halsted (35th to 42nd and 43rd to 47th), Stewart (42nd to 43rd), Morgan Street (47th to 48th), Racine Avenue (48th to Garfield), Peoria Street (Garfield to 56th), Green Street (56th to 57th) and Halsted (57th to 103rd), and on the east by the lake (Cermak to 73rd) and Yates (73rd to 103rd).[49] | |||
| Vacant | April 30, 1983 – August 23, 1983 | |||
 Charles A. Hayes Charles A. Hayes |
Democratic | August 23, 1983 – January 3, 1993 |
Elected to finish Washington's term Re-elected in 1984 Re-elected in 1986 Re-elected in 1988 Re-elected in 1990 Lost renomination | |
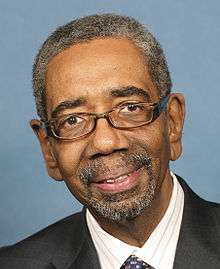 Bobby Rush Bobby Rush |
Democratic | January 3, 1993 – January 3, 2003 |
First elected in 1992 Re-elected in 1994 Re-elected in 1996 Re-elected in 1998 Re-elected in 2000 |
The district expanded into the suburbs for the first time in 90 years, increasing its total area from 32 to 56 square miles (150 km2). It now included: the Chicago communities of Douglas, Oakland, Kenwood, Hyde Park, Woodlawn, Greater Grand Crossing, Avalon Park, Burnside, Chatham and Mount Greenwood; those portions of Auburn Gresham and Washington Heights east of Halsted, those portions of Roseland and Pullman north of 103rd Street, and those portions of Calumet Heights and South Chicago west of Yates Boulevard; the portion of South Deering northwest of 103rd and Yates; South Shore, excepting the area southeast of 71st and Yates; Washington Park, excepting the area northwest of 57th and King Drive; the part of Grand Boulevard north of 43rd Street, as well as most of the area east of Vincennes Avenue; the portion of Armour Square southeast of 35th Street and Princeton Avenue; most of Englewood north of 63rd or east of Halsted; the portion of West Englewood north of 63rd; most of New City southwest of 49th and May Streets; most of Brighton Park southeast of 40th and Kedzie Avenue; portions of Gage Park east of Kedzie, most of Chicago Lawn east of Kedzie, and the portion of Ashburn east of Kedzie; Beverly, excepting the area southeast of 103rd and Prospect Avenue; and most of Morgan Park west of Vincennes. In the suburbs, the district included the villages of Evergreen Park and Merrionette Park, the portion of Alsip east of Cicero Avenue, the portion of Blue Island in Worth Township north of the Calumet Sag Channel, and, with minor variations, the portion of Oak Lawn southeast of 101st and Cicero.[50] |
| January 3, 2003 – January 3, 2013 |
Re-elected in 2002 Re-elected in 2004 Re-elected in 2006 Re-elected in 2008 Re-elected in 2010 |
 | ||
| January 3, 2013 – present |
Re-elected in 2012 Re-elected in 2014 |
See map and geography above. For a more detailed map, see the Census Bureau map linked below. | ||
Election results
2002
| Party | Candidate | Votes | % | |
|---|---|---|---|---|
| Democratic | Bobby Rush* | 149,068 | 81.17 | |
| Republican | Raymond G. Wardingley | 29,776 | 16.21 | |
| Libertarian | Dorothy Tsatsos | 4,812 | 2.62 | |
| Total votes | 183,656 | 100.00 | ||
| Voter turnout | % | |||
| Democratic hold | ||||
2004
| Party | Candidate | Votes | % | |
|---|---|---|---|---|
| Democratic | Bobby Rush* | 211,115 | 84.82 | |
| Republican | Raymond G. Wardingley | 37,793 | 15.18 | |
| Total votes | 248,908 | 100.00 | ||
| Voter turnout | % | |||
| Democratic hold | ||||
2006
| Party | Candidate | Votes | % | |
|---|---|---|---|---|
| Democratic | Bobby Rush* | 146,623 | 84.06 | |
| Republican | Jason E. Tabour | 27,804 | 15.94 | |
| Total votes | 174,427 | 100.00 | ||
| Voter turnout | % | |||
| Democratic hold | ||||
2008
| Party | Candidate | Votes | % | |
|---|---|---|---|---|
| Democratic | Bobby Rush* | 233,036 | 85.87 | |
| Republican | Antoine Members | 38,361 | 14.13 | |
| Total votes | 271,397 | 100.00 | ||
| Voter turnout | % | |||
| Democratic hold | ||||
2010
| Party | Candidate | Votes | % | |
|---|---|---|---|---|
| Democratic | Bobby Rush* | 148,170 | 80.36 | |
| Republican | Raymond G. Wardingley | 29,253 | 15.87 | |
| Green | Jeff Adams | 6,963 | 3.78 | |
| Total votes | 184,386 | 100.00 | ||
| Voter turnout | % | |||
| Democratic hold | ||||
2012
Living former Members of the U.S. House of Representatives from Illinois's 1st congressional district
As of May 2015, there are no former members of the U.S. House of Representatives from Illinois's 1st congressional district who are currently living at this time.
See also
References
- ↑ "Partisan Voting Index Districts of the 113th Congress: 2004 & 2008" (PDF). The Cook Political Report. 2012. Retrieved 2013-01-10.
- 1 2 3 4 Barone, Michael; McCutcheon, Chuck (2013). The Almanac of American Politics 2014. Chicago: University of Chicago Press. p. 552. ISBN 978-0-226-10544-4. Copyright National Journal.
- ↑ Illinois Congressional District 1, Illinois Board of Elections
- 1 2 Parsons, Stanley B.; William W. Beach; Dan Hermann (1978). United States Congressional Districts 1788–1841. Westport, CT: Greenwood Press. pp. 302–304. ISBN 0-8371-9828-3.
- 1 2 Parsons, Stanley B.; William W. Beach; Michael J. Dubin (1986). United States Congressional Districts and Data, 1843–1883. Westport, CT: Greenwood Press. pp. 7–8. ISBN 0-313-22045-X.
- 1 2 Parsons, et al. (1986), pp. 53–54.
- 1 2 Gottron, Martha V. (ed.) (1983). Congressional Districts in the 1980s. Washington, D.C.: Congressional Quarterly. p. 156. ISBN 0-87187-264-1.
- ↑ Congressional District Data Book: Districts of the 87th Congress. Washington, D.C.: U.S. Bureau of the Census. 1961. p. 16.
- ↑ Congressional Districts in the 1990s: A Portrait of America. Washington, D.C.: Congressional Quarterly. 1993. p. 235. ISBN 0-87187-722-8.
- ↑ Tarr, David R. (ed.) (2003). Congressional Districts in the 2000s: A Portrait of America. Washington, D.C.: CQ Press. p. 296. ISBN 1-56802-849-0.
- ↑ See U.S. Census Bureau map showing distribution of district's white population.
- ↑ Congressional Districts in the 2000s: A Portrait of America, p. 298.
- 1 2 3 4 5 Vote totals from 1852 to 1868 are based on cumulative county totals as listed in Illinois: Historical and Statistical (1892), John Moses, Chicago: Fergus Printing Co., pp. 1208–1209.
- 1 2 Congressional District Data Book: Districts of the 87th Congress, p. 17.
- ↑ http://clerk.house.gov/member_info/electionInfo/1960election.pdf
- ↑ http://clerk.house.gov/member_info/electionInfo/1964election.pdf
- ↑ Barone, Michael; Grant Ujifusa; Douglas Matthews (1972). The Almanac of American Politics. Boston: Gambit. p. 196. ISBN 0-87645-053-2.
- ↑ Barone, et al. (1973), p. 263.
- ↑ Barone, Michael; Grant Ujifusa; Douglas Matthews (1977). The Almanac of American Politics 1978. New York City: E. P. Dutton. p. 225. ISBN 0-87690-255-7.
- ↑ Barone, et al. (1981), p. 295.
- ↑ Barone, Michael; Grant Ujifusa (1985). The Almanac of American Politics 1986. Washington, D.C.: National Journal Group. p. 393. ISBN 0-89234-032-0.
- ↑ Barone, Michael; Grant Ujifusa (1989). The Almanac of American Politics 1990. Washington, D.C.: National Journal Group. p. 351. ISBN 0-89234-043-6.
- ↑ Barone, Michael; Grant Ujifusa (1993). The Almanac of American Politics 1994. Washington, D.C.: National Journal Group. p. 390. ISBN 0-89234-057-6.
- ↑ Barone, Michael; Grant Ujifusa; Richard E. Cohen (1997). The Almanac of American Politics 1998. Washington, D.C.: National Journal Group. p. 475. ISBN 0-89234-081-9.
- ↑ Barone, Michael; Richard E. Cohen; Charles E. Cook Jr (2001). The Almanac of American Politics 2002. Washington, D.C.: National Journal Group. p. 507. ISBN 0-89234-099-1.
- 1 2 Barone, et al. (2005), p. 561.
- ↑ Based on general election results beginning in 1968, Guide to U.S. Elections (5th ed.). Washington, D.C.: CQ Press. 2005. ISBN 1-56802-981-0.
- ↑ Barone, Michael; Grant Ujifusa; Douglas Matthews (1973). The Almanac of American Politics. Boston: Gambit. p. 262. ISBN 0-87645-077-X.
- ↑ Barone, Michael; Grant Ujifusa (1981). The Almanac of American Politics 1982. Washington, D.C.: Barone & Co. p. 294. ISBN 0-940702-00-2.
- ↑ Barone, Michael; Richard E. Cohen (2005). The Almanac of American Politics 2006. Washington, D.C.: National Journal Group. p. 562. ISBN 0-89234-111-4.
- 1 2 Nutting, Brian; H. Amy Stern, eds. (2002). Congressional Quarterly's Politics in America 2002. Washington, D.C.: Congressional Quarterly. p. 308. ISBN 1-56802-655-2.
- ↑ "Votes Against Party by Bobby Rush". The Washington Post. Archived from the original on June 29, 2007. Retrieved 2007-06-30.
- ↑ Barone, et al. (2005), p. 563.
- ↑ Sharp, J. Michael (2006). Directory of Congressional Voting Scores and Interest Group Ratings. Washington, D.C.: CQ Press. pp. 1363–64. ISBN 1-56802-970-5.
- ↑ "Bobby Rush on the Issues". Retrieved 2007-06-30.
- ↑ Parsons, et al. (1986), pp. 102–103.
- ↑ Guide to U.S. Elections, p. 940.
- ↑ Parsons, et al. (1986), pp. 159–160.
- ↑ Parsons, Stanley B.; Michael J. Dubin; Karen Toombs Parsons (1990). United States Congressional Districts, 1883–1913. Westport, CT: Greenwood Press. pp. 23–27. ISBN 0-313-26482-1.
- ↑ Parsons, et al. (1990), pp. 182–186.
- ↑ Parsons, et al. (1990), pp. 187–191.
- ↑ Parsons, et al. (1990), pp. 326–330.
- ↑ Barrett, Edward A. (ed.). Blue Book of the State of Illinois, 1947–1948. Springfield, IL: State of Illinois. p. 110.
- ↑ Barrett, pp. 113–114.
- ↑ Congressional District Atlas of the United States. Washington, D.C.: U.S. Bureau of the Census. 1960. pp. 18–20.
- ↑ Congressional District Data Book: Districts of the 88th Congress. Washington, D.C.: U.S. Bureau of the Census. 1963. pp. 125–127.
- ↑ Congressional District Data Book, Illinois supplement. Washington, D.C.: U.S. Bureau of the Census. 1966. pp. 2–4.
- ↑ Congressional District Data Book: 93rd Congress. Washington, D.C.: U.S. Bureau of the Census. 1973. pp. 145, 147–148.
- ↑ Congressional Districts in the 1980s, p. 163.
- ↑ Congressional District Atlas: 103rd Congress of the United States. Washington, D.C.: U.S. Bureau of the Census. 1993. pp. Illinois–1, 5, 25, 28–33. ISBN 0-16-041689-2.
External links
- Washington Post page on the 1st District of Illinois
- "Statistical Abstract of the United States: 2003" (PDF). (163 KiB) – Congressional District Profiles, U.S. Census Bureau
- "U.S. Census Bureau – 1st District map" (PDF). (1.47 MiB)
- U.S. Census Bureau – 1st District Fact Sheet
| Preceded by Texas's 17th congressional district |
Home district of the President of the United States January 20, 2009–present |
Incumbent |
Coordinates: 41°32′42″N 87°50′09″W / 41.54500°N 87.83583°W