Hovmöller diagram
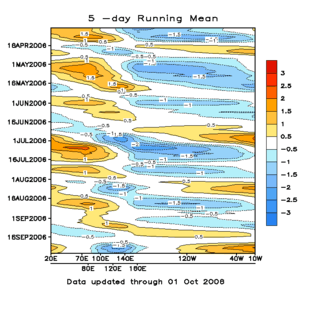
A Hovmöller diagram of the 5-day running mean of outgoing longwave radiation showing the Madden–Julian oscillation. Time increases from top to bottom in the figure, so contours that are oriented from upper-left to lower-right depict objects moving from west to east.
A Hovmöller diagram is a commonly used way of plotting meteorological data to highlight the role of waves. The axes of a Hovmöller diagram are typically longitude or latitude (abscissa or x-axis) and time (ordinate or y-axis) with the value of some field represented through color or shading. Hovmöller diagrams are also used to plot the time evolution of vertical profiles of scalar quantities such as temperature, density, or concentrations of constituents in the atmosphere or ocean. In that case time is plotted along the abscissa and vertical position (depth, height, pressure) along the ordinate.
The diagram was invented by Ernest Aabo Hovmöller (1912-2008), a Danish meteorologist, in a paper of 1949.[1]
See also
References
- ↑ Hovmöller, Ernest (1949), "The Trough-and-Ridge Diagram", Tellus, 1 (2), pp. 62–66
External links
This article is issued from Wikipedia - version of the 10/9/2016. The text is available under the Creative Commons Attribution/Share Alike but additional terms may apply for the media files.