Housing in the United Kingdom
Housing in the United Kingdom ranks in the top half of EU countries.[1][2] However the increasing cost of housing, is leading many to claim there is a "housing crisis".[3][4][5] Most though still find the UK a desirable place to live. London is resident to the highest number of ultra high net worth individuals in the world.[6] For some this is a cause for concern as it is leading to gentrification. The average house costs £290,000 to buy (September, 2015), has 2.8 bedrooms, and is semi-detached.[7] Housing represents the largest non-financial asset in the UK with a net value of £5.1 trillion (2014).[8]
Demography
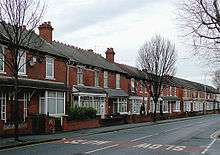
In early 2014 there were approximately 23 million dwellings in the England, of which 63% were owner occupied, 20% were private rented, and 17% were public housing.[9] The overall mean number of bedrooms was 2.8 in 2013-14, 37% of households had at least two spare bedrooms.[7] 20% of dwellings were built before 1919 and 15% were built post 1990.[7] 29% of all dwellings are terraced, 42% are detached or semi-detached, and the remaining 29% are bungalows or flats. The mean floor area is 95 square meters.[7] Approximately 4% of all dwellings were vacant.[7] Approximately 385,000 households reported a fire between 2012 and 2014, the majority of which were caused by cooking.[10] In 2014 2.6 million households moved dwelling, the majority of which (74%) were renters.[7]
Construction History

The Labour government suspected that there might be supply side problems in the construction sector, and in 2006 commissioned the Callcutt Review of House Building Delivery., which was published in 2007. The Callcutt report noted the failure of the home building industry to increase the supply in response to price signals.[12]
There was a fall after the 2008 recession, but by 2014 it was back up to 152,000, but this only two thirds of what Baker said was needed.[13]
The Baker report underestimated the demand for new dwellings. In the 1970s the UK was building about 300,000 new dwellings a year and there was little or no population growth.[14] The new dwellings were used to reduce over crowding and to replace inferior the housing stock. After 2004 (when the Baker report was published) UK experienced strong population growth, primarily due to immigration from EU accession states.[15] From 2000 to 2013 the population of the UK increased by about 4.1 million from 60.0 to 64.1 million.[14]
Purchase price of a dwelling
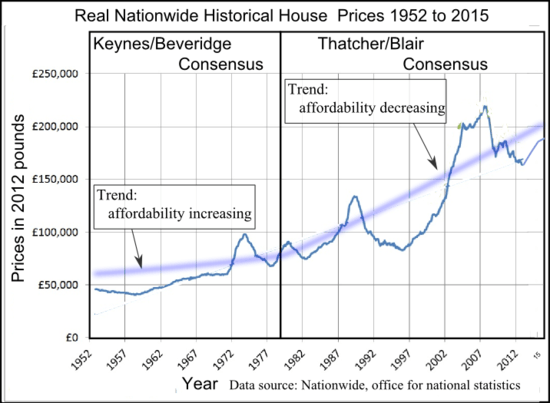
During the era of the Keynes–Beveridge consensus the purchase prices of dwellings increased slightly faster than the Retail Price Index (RPI), so there was an increase in the real price. In 1950, in 2012 pounds, the average dwelling cost was £50,000, at the end era it cost £75,000.[16]
In September 2015 the average house price was £286,000, and affordability of housing as measured by price to earnings ratio was 5.3.[17]
The London effect
In 2015 in London the average price for a semi-detached ex council property was around £550,000.[18] This was over fifteen times median earnings. In the era of the Keynes/Beveridge consensus, the market for London property was mainly owner-occupiers, but since then it is investors, often foreign, seeking buy to let, and buy to speculate investments.[19]
There is concern that councils in central London are aggravating the housing crises by pursuing policies of gentrification.[20]

London is ranked as the top city in the world in terms of the number of ultra high net worth individuals who are resident in a city.[6] The consequence of this is seen in the high price for top-end dwellings. The most expensive home ever sold in the UK was 2 to 8a Rutland Gate, Hyde Park which sold for £280 million in 2015.[21] The most expensive street in the UK is Kensington Palace Gardens, London, where the average price of a home is approximately £42 million.[22]
See below for further information on the extent of London property kept empty by speculators.
Desirability of rising house prices
Dwellings represent the largest non-financial asset in the UK balance sheet, with a net worth of £5.1 trillion (2014).[8] In the national statistics rising house prices are regarded, as adding to GDP and thus a cause of economic growth.
Historically, the assumption in the media and elsewhere was that rising house prices were a good thing. There is evidence that the public no longer share this view.[23]
Rent for a dwelling (Generation Rent)
Nearly two out of five households rent their home.[9] During the era of the Keynes/Beveridge consensus nearly all rented dwellings were provided by local government. This changed during the era of the Thatcher/Blair consensus. In 2014 most rented dwellings where provided by private landlords.[9] The proportion of dwellings rented form of the private rented sector is increasing, whilst the public sector is declining. In the financial year 2014, the private rented sector increased by 123,000 dwellings, and the public sector declined by 9,000 dwellings.[9]
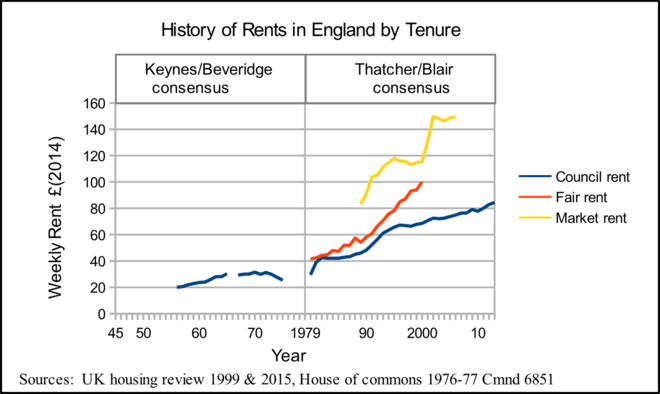
At the start era of Thatcher Blair Consensus, before the deregulation, there were no market rents, and fair rents in private sector and council rents were both about the same at, in real in terms £(2014) £40pw, or £(2014)170pcm.[24] By the 2000s rents had increased substantially. There were no longer any fair rents, and the market rent was £(2014) 150pw or £(2014)650pcm. A nearly fourfold increase (See the graph above History of Rents in England by Tenure).[25]
In the era of the Thatcher Blair consensus the rates were abolished, and in the UK there is now no property tax based on ownership, a situation almost unique in the OECD.[26] Further, councils lost the power to set rents. Instead, rents for housing associations and council houses are now set by central government, and far from being subsidized they are used to provide a revenue stream for social housing. This has had the consequence that, in real terms, council rents have doubled, from under £(2014)40pw in 1980, to £(2012) 80pw in 2012, or £(2012)173pcm to £(2012)346pcm.[25]
High rents have not just effected those in the lower half of the income distribution. who always been lifelong renters. In the era of the Keynes/Beveridge consensus those in the upper half of the income distribution would typically, rent a home while saving for deposit to get on the property ladder. This is no longer possible, money which would have been used in saving for the deposit now goes in rent. The majority of new households formed in the UK can now expect to rent from a private landlord for life.[27] This phenomenon has been called generation rent and there is much debate about the social consequence of this change.[28] See the Thatcher Blair Consensus and inequality for further information.
In London, rents are double the national average and this is driving gentrification. Londoners on median earnings find they can no longer afford to rent an apartment in central London.[20][29] Those on median incomes, who work in central London have had to move to the outer suburbs, and the commuting towns in SE England.[30] Many find, that commuting using London's congested transport infrastructure lowers their standard of living, and is disruptive of family life.[31]
Homelessness
In June 2015 there were approximately 67,000 households in England in temporary accommodation.[32] In Autumn of 2014 there were around 2,400 rough sleepers in England, 27% of which were in London.[33][34]
Overcrowding
The consequences of the housing shortage and high rents manifests itself in overcrowding rather than In homelessness, The problem of over crowding is especially acute in London.[35] In 2011 it was estimated that there were 391,000 children in London living in overcrowded conditions.[36]
Between 1995-1996 to 2013-2014 overcrowding, as measured by the bedroom standard increased from 63,000 households to 218,000 households.[37] The bedroom standard understates overcrowding. It does not include potential household units forced to live in the same dwelling. For example, divorced couples living in the same dwelling, adult children being unable to form own household but having to live with their parents.[38] It has not proved possible to find statistics on the true extent of overcrowding.
A report issued by the Deputy Prime Minister's Office reviewed the evidence that overcrowding, in addition to the known impacts on physical health, adversely effects mental health, and child development.[39]
Housing Quality
It is useful to consider housing quality under two sub headings physical and social. In the era of Beveridge Consensus there where large scale slum clearance projects. Council environmental health officers inspected dwellings in a borough and those which failed to meet standards, where compulsory purchased for a nominal sum, and demolished.[40] New dwellings where built to rehouse the slum dwellers. Slum clearance significantly improved the physical quality of the UK housing stock. But in a seminal study Family and Kinship in East London it was found that although the physical quality of the housing had improved, its social quality had deteriorated. The residents of apartments in tower blocks appreciated their clean, warm, bright new apartments, but missed the supportive community networks of the slums.
Physical Quality
Undocumented migrants, as they fear being deported, are easily exploited, and do not report housing conditions which constitute a public health risk.[41] This means that the extent of the problem is not known.
Although overall the quality of English housing stock has improved over the last thirty years (a generation), the quality of housing for new households formed from those at or below the median income has declined. Thirty years ago a new household in this group could rent a council house built to Parker Morris standard. In 2016, a new household from this group, has to rent from a private landlord a dwelling, which will have less space than the Parker Morris standard dwelling, and likely to be damp, and they pay in real terms, at least three time the rent of their parent's generation.[42][43]
Jessica McLean was a tenant who complained about a dwelling and claimed that she was evicted due to this.[44]
Social quality
For many people the social life their home enables is as important as the physical conditions the home provides. There is a debate about whether the generation born in the 1980s, at the start of the Thatcher/Blair consensus era are better or worse offthan their parents.[45] Economists who believe in the Thatcher/Blair consensus claim living standards have improved for what has been called generation X, whilst others hold they have declined. The economist point to fourfold growth in the nation's GDP during the era of the Thatcher/Blair consensus, an increase GDP per capita, and an increase median earnings.[45] Those who content that there has been a fall living standards for generation X, say that increasing GDP per capita can be, and is in the UK, associated with a declining quality of life. And that housing conditions of Generation X has made their standard of living far lower than that of their parents. They claim that the two major cause of decline in the social environment provided by housing are: symmetrical tenancy agreements and socially segregated housing developments.[45]
Symmetrical tenancy agreements
Nearly all dwellings are let using Shorthold Assured Tenancy agreements.[46] There is a short period, typically six months or a year, where neither side can terminate the agreement. After this period, both sides can terminate the agreement at a months notice.
There is evidence, that main the beneficiary of the symmetrical tenancy agreements have been UK landlords, as it has enabled rents rise not only faster than the RPI, but also far faster than wages.[47] In 2015 private sector rents in the UK rose by 4.9% with particular large rises in Brighton and Bristol whilst earnings growth in the UK was 2.9%.[48][49]
Factors which lower the social quality of housing such as: homelessness and fear of homeless, and transient unfriendly neighborhoods have been attributed to symmetrical tenancy agreement.[50] Evidence of the comparative insecurity in the private rental sector is, is provided by the statistics on recent movers.[51] In the year 2013, for every 1,000 residents, 340 of those in the private rented sector would move, compared with 5 owner occupiers, and 9 in the public rented sector.[52]
Socially Segregated housing

The current position is that in London, only UK citizens who are top earners, are in the market to become home owners.[54][55] In London, the effective demand for new dwellings now comes from property investors, not those hoping to become owner occupiers. Property investors, are not primarily interested in whether a dwelling unit provides a good social environment for a family. The investor is looking for standardized dwelling units which can provide a good rental income and predictable maintenance costs. This has reduced the demand for three bedrooms houses with gardens, which are normally consider to provide the ideal family homes, instead the demand is for apartments in multi-story blocks.[55] In London, many such apartments are marketed too, and bought by foreign investors.[56] The ideal unit for such investors, is in a gated development with a tower block of apartments, with car parking instead of gardens. Standardized dwellings units are desirable as they can be traded on the global market like any other commodity.[57]
There is evidence that gated developments intensify social segregation, and rather than preventing crime they create fear of crime.[58] The residents of the gated development become fearful of those living outside of their secured space and only leave the development by car.[58] They are too fearful to walk out of it and socialize with their neighbours outside.[59]

Having separate estates for owner occupiers and council tenants reinforced class divisions and class stereotyping. There were residents on owner occupier estates who call those who lived on council estates 'common' meaning they were social inferiors, and there were residents in council estates who would call those lived in owner occupied estates 'snobs' meaning they people who were to proud to socialize with those they considered their social inferiors.[60] Due to limited social interaction between owner occupiers and council tenants there is much scope for misunderstanding.
Cost of Home Heating (Energy Efficiency)
UK homes are some of the most expensive to heat in Europe, which results in high levels of fuel poverty (for further information see Fuel poverty in the United Kingdom).[61] The problem results from age of the housing stock with most dwellings being built prior to oil shock of 1973, after which insulation standards for newly build housing improved. The UK dwellings have the oldest age profile in the EU with over 60% being built before 1960, and with only just over 10% being built between 1991-2010.[62] The graph above on the history of construction of new dwellings shows this age profile is a consequence of the reduction in the number of in new dwellings build per year after 1979.
There is a particular problem with dwellings built before World War I (1914-1918), which are now over hundred years old.[63] The terraced houses of this period, build for sale to the buy to let investors of the time, are particular difficult to insulate. These dwellings were built for heating by open coal fires, and had large drafty windows to allow the fire to draw. They have very small rooms and have solid walls with a single tier of bricks. This structure makes wall insulation expensive and in many cases impractical.[64] Many of the dwellings of this type were replaced by council houses in the post war slum clearance program, but with the ending of public sector building of dwellings this route for improving the energy efficient of the housing stock ended.
There also insulation problems in the pre-1914 large houses built for the top decile of the time. These houses were built with servant quarters in the roof space. Most such houses have been converted into blocks of flats and sold to buy to let investors.[65] These flats are difficult to insulate, especial the top floor flat in the roof space.[66] The expense of insulation means that it is not often not cost effective for the landlord to insulate such dwellings. This is especially true in London, where due to the housing crisis, landlords can let a property in poor condition, and consequently improving the energy efficiency of a dwelling is not a priority for buy to let investors.
There is also a problem in that only half the poorly insulated dwelling in the private rental sector use central heating, instead using more expensive electrical heaters.[67]
Government policies for improving home energy efficiency
To encourage home insulation the governments introduced The Green Deal, the Energy Company Obligation, and Energy Performance Certificates(EPCs).[68]
The Green Deal does not offer any subsidies or grants for home insulation. Instead a new type of loan is provided which is attached to the property rather than the individual who takes out the loan. The purchaser of property becomes liable for the loan taken out to insulate the property. The Green Deal policy has met substantial criticism. In 2013, the Telegraph wrote that the high rate of interest charged for loans taken out under the Green Deal, will mean there will be insignificant take up, and hence the policy will be ineffective.[69]
The Energy Company obligation provides means tested grants for home insulation. The funding for these grants does not come from government taxation. Instead there is legislation that allows the energy utilities to raise a levy on all utility bills to pay for the mean tested insulation grants. In 2015 these charges added about £112 to the average utility bill.[70] If the utility fails to spend the money it raises from the levies in insulating the homes of those in fuel poverty it is fined. There have been problems with scheme, utilities have been paying fines rather than providing the insulation.[71]
The difficulties the utilities have had is in the low uptake of the grants. There is a particular problem in that most of the people in fuel poverty who are entitled to the grants are in the private rental sector. A tenant who applies for and gets a grant which improves his landlords property has no security of tenure. The tenant will not benefit from reduced fuel bills, if the landlord puts up he rent, as the property has been improved. Understandably, tenants in fuel poverty have been reluctant to apply for the grants. The consequence of failure to take up grants, is given as one of the reasons the UK is missing carbon reduction targets.[72]
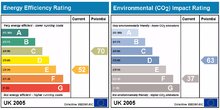
The idea behind EPCs was that if those buying or renting a property are informed about its energy efficiency market forces will lead to better insulated dwellings. To improved the working of the market by providing better informed purchasers, under UK law, whenever a dwelling is built, sold, or rented an EPC is required.[73]
An EPC gives an indication of the energy efficiency of a dwelling. The certificates have been criticized as they are based on visual inspection of the property, and examination of documents, and not on measurements of energy use, or the insulation characteristic of the building.[74] It is not possible to calculate the cost heating a dwelling from its EPC, or the amount energy which can be saved by insulating a wall, roof or window. There are claims that EPCs are of no real value. It is held that a certificate which can be bought for just £34, produced as result of form filling exercise, can not possibility be as useful as a proper energy survey based on measurement.[75][76]
There have been improvements housing in insulation but this is manly in the owner occupier sector. Between 2001 and 2013 the prevalence of cavity wall insulation of houses which have cavity walls rose from 39% to 68%. Over the same time period the proportion of fully double glazed dwellings rose from 51% to 80%.[77] It has not proved possible to find evidence that these improvements were the result of government policy or would happened anyway.
If all the recommendations by energy performance certificates were implemented the notional carbon dioxide emissions, from UK dwellings could be reduced by over 20%.[77]
Empty homes
According to official statistics, on October 2015, there were 600,179 vacant dwellings in England, a decline from the 610,123 from a year earlier. Of these vacant dwellings, 203,596 were vacant for more than six months.[78] This it is believed is mainly due to financial reasons, such as the owner being unable to sell the house or raise enough money to renovate the property.[79] Empty Dwelling Management Orders (EMDOs) allow councils to take over the management of long-term empty properties but these are generally seen as a last resort and only 43 EDMOs were successful from 2006 to 2011. Government statistics show that long-term empty homes are generally concentrated in the North of England and in seaside towns, where property prices are generally lower, with the lowest percentage in London which had 20,795 long-term empty properties.[79]
According to official statistics, the percentage of empty homes in England has fallen from 3.5% in 2008 to 2.6% in 2014, one explanation for this housing transactions have picked up since the financial crisis, and because of government efforts to reduce the number of empty homes. An alternative explanation is that before 2010 there was an incentive for property owners to report a property as empty, as there was a rebate on council tax for vacant property. And when this incentive was removed, property owners ceased informing the council that their property was empty, and it was this which has led to apparent fall in empty homes reported by official statistics.
The number of empty homes includes homes where the previous occupier is in prison, in care, in hospital or recently deceased.[80]
The charity Empty Homes argued that empty homes were helping contribute to the housing crisis, saying in a report "The longer a property is empty the more our housing assets are being wasted. Also, the longer a property lies empty, the more likely it is to deteriorate; the more it is likely to cost to bring back into use; and the more it is likely to be seen as a blight by the neighbours."[80]
London
Research by Islington Council revealed that nearly a third of new dwellings built did not have anyone on the electoral register after six years, although this may exclude students and foreign tenants.[81]
The Observer reported on what has been termed 'lights out London' .. 'where absentee owners push up property prices without contributing to the local economy'.[82] A local restaurateur explained the problems this caused, 'my original customers [have sold to ] non-doms who do not live in their [property]. In some some apartment blocks 20% were unoccupied... It makes a big difference [to my business]'.[83]
The Guardian investigated the occupancy and the ownership of the apartments in St Georges Wharf Tower on the south bank of the Thames.[84] The investigation found that 60% of the apartments were foreign owned, often by companies registered in tax havens.[84][85] It further found that although there were bedrooms for over 600 people, there were only 60 people registered to vote.[84]
See also
- Building regulations in the United Kingdom
- English land law
- Public housing in the United Kingdom
- Mortgage industry of the United Kingdom
- Real estate in the United Kingdom
- Cost of moving in the United Kingdom
- Land Registry (United Kingdom)
References
- ↑ OECD Better Life Index - Housing
- ↑ First European Quality of Life Survey: Social dimensions of housing
- ↑ Housing crisis: 350,000 UK households unable to rent or buy without help by 2020
- ↑ "Housing crisis overtakes transport as biggest concern for Londoners,". Evening Standard. Retrieved 2016-01-15.
- ↑ "The human cost of Britain's housing crisis". The Guardian. 2015-10-13. ISSN 0261-3077. Retrieved 2016-01-15.
- 1 2 "Global Investment Cities | The Wealth Report". www.knightfrank.com. Retrieved 2016-01-15.
- 1 2 3 4 5 6 English housing survey 2013 to 2014: headline report
- 1 2 Statistical bulletin: National Balance Sheet, 2015 Estimates
- 1 2 3 4 "Dwelling Stock Estimates 2014 England" (PDF). National Statistics. April 23, 2015. Retrieved January 10, 2016.
- ↑ English housing survey 2013 to 2014: fire and fire safety report
- ↑ "How Macmillan built 300,000 houses a year / Conservative Home". Conservative Home. Retrieved 2016-01-09.
- ↑ "Callcutt Review of House Building Delivery" (PDF). HMSO. 2007-11-01. p. 214.
According to [neo classical economic theory], where there is an imbalance between supply and demand, prices will adjust until either supply increases or demand is choked of. Over recent years [the UK housing market] has continued to defy all predictions.
- ↑ "Live tables on house building - Statistical data sets - GOV.UK". www.gov.uk. Retrieved 2016-01-15.
- 1 2 "Figure 2: Mid-year population estimates and annual change for the UK mid-1964 onwards". Office for National Statistics. 2014-06-26.
- ↑ "Changes in UK population over the last 50 years". Office For National Statistics. 2014-06-26.
Since 2001 there have been high levels of net inward migration, adding to the population at younger working ages. In part this was driven by the expansion of the European Union in 2004 and 2007.
- ↑ "UK House Value vs UK House Affordability – December 2012". Retirement Investing Today. December 22, 2012. Retrieved January 12, 2016.
- ↑ "House Price Index- Office for National Statistics". www.ons.gov.uk. Retrieved 2016-06-11.
- ↑ "England> London House prices". rightmove. January 12, 2016. Retrieved January 12, 2016.
- ↑ "Vast swathes of London are becoming unaffordable even to those on "good" incomes". New Statesman. April 1, 2014. Retrieved January 12, 2016.
- 1 2 "The truth about gentrification: regeneration or con trick?". The Guardian. May 18, 2014.
- ↑ Hyde Park mansion set to become Britain's most expensive home after £280m bid
- ↑ "On the elite streets of Britain: Our most expensive roads". Telegraph. January 12, 2016.
- ↑ Collinson, Patrick (2014-02-12). "Rising house prices used to be considered good news. Not any more". The Guardian. ISSN 0261-3077. Retrieved 2016-01-21.
- ↑ "Housing Finance Rewiew 1999-2000" (PDF). p. 179.
- 1 2 "UK HOUSING REVIEW 2015:Rents and earnings in England" (PDF). University York.
- ↑ "Labour has 'moral mission' to tackle inequality, says Tristram Hunt". the Guardian. 2015-12-07.
Hunt pointed out that 14 OECD countries – including the US – raise a recurring tax on the value of residential property. [Hunt proposed] an annual 0.5% tax upon the value of each property – less than most countries. [This would take] “generation rent” completely out of local taxes altogether.
- ↑ "Generation rent: only 26% of young adults will be on housing ladder by 2025". The Guardian. November 17, 2015. Retrieved January 10, 2015.
- ↑ "Generation rent: the reluctant rise of the older tenant". The Telegraph. January 10, 2016. Retrieved January 10, 2016.
- ↑ "Gentrification is knocking the heart out of my South London neighbourhood". METRO. October 7, 2015.
- ↑ "London workers £300,000 better off living an hour outside capital". Telegraph.co.uk. 2015-07-29. Retrieved 2016-06-13.
- ↑ "How to solve the hell of commuting to London? Readers share their thoughts". the Guardian. 2016-05-17.
- ↑ Statutory homelessness in England: April to June 2015
- ↑ Rough sleeping in England: autumn 2014
- ↑ The homeless people - a priority need?
- ↑ "No Space at Home:Overcrowding in London" (PDF). 4 in 10 London Children Live in Poverty. Retrieved January 11, 2016.
- ↑ "English Housing Survey 2009/10,". DCLG. July 2011.
- ↑ "English Housing Survey Headline Report 2013-14" (PDF). Department of Communities and Local Government. February 2015. p. 32.
- ↑ "Generation boomerang: how to cope with grown-up children at home". Telegraph.co.uk. Retrieved 2016-01-17.
- ↑ "The Impact of Overcrowding on Health &Education:" (PDF). Office of the Deputy Prime Minister. May 2004. Retrieved January 11, 2016.
- ↑ "The History of Council Housing". fet.uwe.ac.uk. Retrieved 2016-01-15.
- ↑ "The exploitation of migrants has become our way of life". The Guardian. 2015-08-17. ISSN 0261-3077. Retrieved 2016-02-01.
- ↑ "English Housing Survey Headline Report 20130-14" (PDF). February 2015. p. 15, Figure 1.4 Household aged 25–34 by tenure.
- ↑ "English Housing Survey Headline Report 2013-14" (PDF). p. 20, Figure 1.8 Mean weekly rents.
- ↑ "Generation rent v the landlords: 'They can't evict millions of us'". The Guardian. 2015-08-22. Section on Jessica Mclean case. Retrieved 2016-01-17.
- 1 2 3 "Is the younger generation worse off than their parents? | Economics Help". www.economicshelp.org. Retrieved 2016-01-19.
- ↑ "Model agreement for a shorthold assured tenancy - Publications - GOV.UK". www.gov.uk. Retrieved 2016-01-19.
- ↑ "Meet the new class of landlords profiting from Generation Rent". The Guardian. 2013-06-28. ISSN 0261-3077. Retrieved 2016-01-21.
- ↑ "Brighton and Bristol tenants hit by 18% rent rises in 2015". The Guardian. 2016-01-11. ISSN 0261-3077. Retrieved 2016-01-21.
- ↑ "UK wage growth hits six-year high, Carney on interest rates - live updates". the Guardian. Retrieved 2016-01-21.
- ↑ "More people are being made homeless because landlords take their home". The Independent. Retrieved 2016-01-21.
- ↑ "English housing survey 2013 to 2014: headline report - Publications - GOV.UK". www.gov.uk. Retrieved 2016-01-21.
- ↑ ibid, calculated from: Trends in tenure p11, Trends in recent movers p26
- ↑ "Check out this property for sale on Rightmove!". Rightmove.co.uk. Retrieved 2016-01-27.
- ↑ "Revealed: Staggering salary Londoners must earn to buy average flat in the capital". Evning Standard. November 10, 2015. Retrieved 2016-01-22.
- 1 2 "These are the foreigners ruining our country". Telegraph.co.uk. July 17, 2015. Retrieved 2016-01-22.
- ↑ "Foreign buyers bought up £100bn of London property in six years". Evening Standard. October 21, 2015. Retrieved 2016-01-22.
- ↑ "The truth about property developers: how they are exploiting planning authorities and ruining our cities". The Guardian. 2014-09-17. Retrieved 2016-01-22.
- 1 2 "Through the barricades". Telegraph.co.uk. March 5, 2003. Retrieved 2016-01-22.
- ↑ "Gated communities fuel Blade Runner dystopia and 'profound unhappiness'". The Guardian. 2014-05-02. Retrieved 2016-01-22.
- ↑ "The social housing stigma: how to fight the stereotyping of social tenants". The Guardian. 2014-06-10. ISSN 0261-3077. Retrieved 2016-01-27.
- ↑ "Britain's damp, leaky homes among Europe's most costly to heat". the Guardian. 2013-11-29.
- ↑ "Europe's Buildings under the microscope. A country by country review of the energy performance of buildings." (PDF). Buildings Performance Institute Europe (BPIE). 2011-10-01. ISBN 9789491143014.
- ↑ "English Housing Survey ENERGY EFFICIENCY OF ENGLISH HOUSING 2013" (PDF). 2013. p. 50.
The majority of the least energy efficient homes were the oldest homes, built before 1919 (61%). These oldest homes were more likely to be of solid wallconstruction, which can more expensive to insulate where required.
- ↑ "Energy Efficiency and Historic Buildings -Insulating Solidwalls" (PDF). English Heritage. 2012-03-01.
In some cases the technical risks of adding insulation to solid walls will be too great.
- ↑ "Energy Efficiency English Housing 2013" (PDF). p. 49.
In 2013, there were around 1.5 million homes (6%) with the worst energy efficiency. Private rented homes were over represented in this group:
- ↑ "Energy Efficiency of English Housing 2013" (PDF).
..converted flats formed higher proportions of the least energy efficient homes...whereas purpose built flats were under represented
- ↑ "Energy Efficiency English Housing 2013" (PDF). p. 52.
Only half (50%) of private rented homes with the poorest energy efficiency were centrally heated, and 27% relied on room heaters for primary heating, the large majority of which were fuelled by electricity, a more expensive optionfor direct heating
- ↑ https://www.gov.uk/buy-sell-your-home/energy-performance-certificates
- ↑ "Green Deal provider Npower warns scheme's interest rates are too high". Telegraph.co.uk. 2013-01-31.
The Government’s flagship Green Deal has suffered a fresh setback as Npower, one of the energy-efficiency programme’s providers, admitted interest rates charged on the scheme were too high.
- ↑ "Green levies add £112 to energy bills - where does the money go?". Telegraph. 2015-01-26.
A sizeable chunk, 9pc or £112 over the course of a year, goes toward government-backed green levies.
- ↑ "Ofgem fines British Gas £11.1m for missed environmental targets". Financial Times. 2014-12-04. ISSN 0307-1766.
Under the community energy savings programme, British Gas had met only 62.4 per cent of its obligations to deliver energy saving measures to households by the end of 2012.
- ↑ "UK off course for post 2020 carbon targets, CCC warns". Business Green. 2014-07-15.
- ↑ "Buying or selling your home - GOV.UK". www.gov.uk. Retrieved 2016-06-19.
- ↑ "Don't waste your energy on eco-certificates". The Telegraph. 2010-04-15.
Let me tell you why the Energy Performance Certificate (EPC) is utterly useless....I[When getting a certificate] I told the inspector that since finishing the house we'd doubled up the insulation in the loft, she said it made no difference to the assessment because it worked on the basis and standard of the Building Regulations at the time of construction.
- ↑ Certificates, Energy Performance. "Energy Performance Certificates UK - Order An EPC Today". www.energyperformancecertificates.co.uk. Retrieved 2016-06-20.
Get [an EPC] from only £34 for properties up to 4 bedrooms
- ↑ "Don't waste your energy on eco-certificates". Telegraph.co.uk. 2010-04-15.
[EPCs] just [provide] jobs for form fillers. If you want a proper energy survey see a true professional
- 1 2 "English housing survey 2013: energy efficiency of English housing report". www.gov.uk. Department for Communities and Local Government. 2015-07-01. p. 13.
- ↑ "Dwelling Stock Estimates: 2015, England" (PDF). ONS. 2016-04-28.
Long-term vacant dwellings numbered 203,596 on 5October 2015, a fall of 2,225 (1.1%) from 205,821 on 6 October 2014.
- 1 2 "Why are so many British homes empty?". Bbc.co.uk. Retrieved 2016-01-06.
- 1 2 "Empty Homes in England" (PDF). Emptyhomes.com. Retrieved 2016-01-06.
- ↑ "Property investors in Islington who leave homes empty could face jai". Guardian. December 4, 2014.
- ↑ "'It's like a ghost town': lights go out as foreign owners desert London homes". the Guardian. 2015-01-25.
Absentee owners and the ‘buy to leave’ market are hurting businesses
- ↑ "'It's like a ghost town': lights go out as foreign owners desert London homes". the Guardian. 2015-01-25.
When [restaurateur] Racine opened in 2002 the average price of a Knightsbridge home was £745,000; now it is £3.4m.
- 1 2 3 "'Tower for the toffs': UK's tallest skyscraper and playground of the rich". the Guardian. 2016-05-24.
The Tower at St George Wharf has 214 flats on 50 floors, costing up to £51m.....Title deeds show that out 210 properties 54 are owned by people or companies....in tax havens...only 60 people in a building with enough bedrooms to accommodate 10 times more, are registered to vote
- ↑ "Politicians condemn 60% foreign ownership of London skyscraper". the Guardian. 2016-05-25.
Owners of properties in the high rise include a billionaire Russian oligarch, the chairman of a defunct Nigerian bank and a Kyrgyz vodka tycoon.