Harrow West (UK Parliament constituency)
| Harrow West | |
|---|---|
|
Borough constituency for the House of Commons | |
|
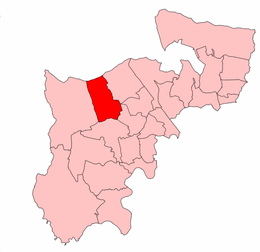
Boundary of Harrow West in Greater London. | |
| County | Greater London |
| Electorate | 69,135 (December 2010)[1] |
| Current constituency | |
| Created | 1945 |
| Member of parliament | Gareth Thomas (Labour Co-op) |
| Number of members | One |
| Created from | Harrow and Hendon |
| Overlaps | |
| European Parliament constituency | London |

Harrow West is a constituency[n 1] represented in the House of Commons of the UK Parliament which has returned a Labour Party MP Gareth Thomas in the four General Elections from 1997.[n 2]
Boundaries
1945-1950: The Urban District of Harrow wards of Harrow on the Hill and Greenhill, Headstone, Pinner North, Pinner South, Roxeth, and West Harrow, and part of Harrow Weald ward.
1950-1955: The Urban District of Harrow wards of Pinner North, Pinner South, and Roxeth, and part of Harrow Weald ward.
1955-1983: The Urban District of Harrow wards of Pinner North, Pinner South, and Roxeth.
1983-2010: The London Borough of Harrow wards of Harrow on the Hill, Hatch End, Headstone North, Headstone South, Pinner, Pinner West, Rayners Lane, Ridgeway, Roxbourne, and Roxeth.
2010–present: The London Borough of Harrow wards of Greenhill, Harrow on the Hill, Headstone North, Headstone South, Marlborough, Rayners Lane, Roxbourne, Roxeth, and West Harrow.
The constituency was created for the first time at the 1945 General Election when the Harrow constituency was split into new seats of Harrow East and Harrow West. It was reduced in size for the 1950 General Election when a third Harrow seat, Harrow Central, was created. The Boundary Commission review before the 1983 General Election saw the London Borough of Harrow contained in two seats, resulting in Harrow West gaining parts of the abolished Harrow Central.
Unlike Harrow East, it had always been won by the Conservative Party until Labour's landslide in 1997 when a swing of 17.5% was the eighth highest swing in that election, and it was the safest Conservative seat to be lost to Labour.[2] The constituency produced another better than average result for Labour in 2001 with a swing from Conservative to Labour of 5.4% or 5.5%, a pro-Labour swing bettered in only four seats and in 2005 a challenge by Mike Freer produced a pro-Conservative swing of 4.5%.[2]
The area is known for the famous Harrow School and also includes Harrow town centre. Labour incumbent Tony McNulty lost the neighbouring Harrow East in 2010 to the Conservative Party, but Gareth Thomas retained his seat in Harrow West with a reduced majority.
Latest boundary review
Following their review of parliamentary representation in North London, the Boundary Commission for England have created a modified Harrow West constituency to reflect parts of Greater London where population has increased more. The western border district, town or neighbourhood of Pinner has been moved to a new constituency, Ruislip, Northwood and Pinner, making Harrow West based on 2005 ward voting statistics, and on local elections, a stronger Labour seat at the expense of the Conservatives than in 2005 — both two leading parties won fewer votes in 2010. Harrow West saw a notional swing in favour of the Conservative Party's Rachel Joyce of 5.7% in the election.
Members of Parliament
| Election | Member[3] | Party | |
|---|---|---|---|
| 1945 | Norman Bower | Conservative | |
| 1951 | Sir Albert Braithwaite | Conservative | |
| 1960 by-election | Sir John Page | Conservative | |
| 1987 | Robert Hughes | Conservative | |
| 1997 | Gareth Thomas | Labour, then Labour Co-operative | |
Election results
Elections in the 2010s
| Party | Candidate | Votes | % | ± | |
|---|---|---|---|---|---|
| Labour Co-op | Gareth Thomas | 21,885 | 47.0 | +3.3 | |
| Conservative | Hannah David | 19,677 | 42.2 | +5.4 | |
| UKIP | Mohammad Ali Bhatti[6] | 2,047 | 4.3 | +2.2 | |
| Liberal Democrat | Chris Noyce[7] | 1,567 | 3.3 | −12.9 | |
| Green | Rowan Langley[8] | 1,310 | 2.8 | +0.7 | |
| Independent | Kailash Shanker Trivedi | 117 | 0.2 | N/A | |
| Majority | 2,208 | 4.7 | −2.1 | ||
| Turnout | 46,603 | 66.9 | −0.7 | ||
| Labour hold | Swing | −1.1 | |||
| Party | Candidate | Votes | % | ± | |
|---|---|---|---|---|---|
| Labour | Gareth Thomas | 20,111 | 43.6 | −5.0 | |
| Conservative | Rachel Joyce | 16,968 | 36.8 | +6.4 | |
| Liberal Democrat | Christopher Noyce | 7,458 | 16.2 | −2.5 | |
| UKIP | Herbert Crossman | 954 | 2.1 | +0.8 | |
| Green | Rowan Langley | 625 | 1.4 | N/A | |
| Majority | 3,143 | 6.8 | |||
| Turnout | 46,116 | 67.6 | +3.2 | ||
| Labour hold | Swing | −5.7 | |||
Elections in the 2000s
| Party | Candidate | Votes | % | ± | |
|---|---|---|---|---|---|
| Labour Co-op | Gareth Thomas | 20,298 | 42.5 | −7.1 | |
| Conservative | Mike Freer | 18,270 | 38.3 | +1.9 | |
| Liberal Democrat | Christopher Noyce | 8,188 | 17.1 | +4.2 | |
| UKIP | Janice Cronin | 576 | 1.2 | +0.1 | |
| Independent | Berjis Daver | 427 | 0.9 | N/A | |
| Majority | 2,028 | 4.2 | |||
| Turnout | 47,759 | 64.3 | +1.3 | ||
| Labour Co-op hold | Swing | −4.5 | |||
| Party | Candidate | Votes | % | ± | |
|---|---|---|---|---|---|
| Labour | Gareth Thomas | 23,142 | 49.6 | +8.1 | |
| Conservative | Daniel Finkelstein | 16,986 | 36.4 | −2.8 | |
| Liberal Democrat | Chris Noyce | 5,995 | 12.9 | −2.6 | |
| UKIP | Peter Kefford | 525 | 1.1 | N/A | |
| Majority | 6,156 | 13.2 | |||
| Turnout | 46,648 | 63.0 | −9.8 | ||
| Labour hold | Swing | 5.5 | |||
Elections in the 1990s
| Party | Candidate | Votes | % | ± | |
|---|---|---|---|---|---|
| Labour Co-op | Gareth Thomas | 21,811 | 41.5 | +19.0 | |
| Conservative | Robert Hughes | 20,571 | 39.2 | −16.0 | |
| Liberal Democrat | Pash Nandhra | 8,127 | 15.5 | −4.7 | |
| Referendum | Herbert Crossman | 1997 | 3.8 | +3.8 | |
| Majority | 1,240 | 2.3 | |||
| Turnout | 52,506 | 72.8 | |||
| Labour gain from Conservative | Swing | 17.5 | |||
| Party | Candidate | Votes | % | ± | |
|---|---|---|---|---|---|
| Conservative | Robert Hughes | 30,240 | 55.20 | ||
| Labour | Claude Moraes | 12,343 | 22.53 | ||
| Liberal Democrat | C. Noyce | 11,050 | 20.17 | ||
| Liberal | G. Aitman | 845 | 1.54 | ||
| Natural Law | J. Argyle | 306 | 0.56 | ||
| Majority | 17,897 | 32.67 | |||
| Turnout | 54,784 | 78.69 | |||
| Conservative hold | Swing | ||||
Elections in the 1980s
| Party | Candidate | Votes | % | ± | |
|---|---|---|---|---|---|
| Conservative | Robert Hughes | 30,456 | 55.24 | ||
| Social Democratic | S.P. Bayliss | 15,012 | 27.23 | ||
| Labour | C. Bastin | 9,665 | 17.53 | ||
| Majority | 15,444 | 28.01 | |||
| Turnout | 74.46 | ||||
| Conservative hold | Swing | ||||
| Party | Candidate | Votes | % | ± | |
|---|---|---|---|---|---|
| Conservative | Sir John Page | 28,056 | 53.03 | ||
| Social Democratic | S.P. Bayliss | 17,035 | 32.20 | ||
| Labour | K.A. Toms | 7,811 | 14.77 | ||
| Majority | 11,021 | 20.83 | |||
| Turnout | 72.32 | ||||
| Conservative hold | Swing | ||||
Elections in the 1970s
| Party | Candidate | Votes | % | ± | |
|---|---|---|---|---|---|
| Conservative | Sir John Page | 26,007 | 58.06 | ||
| Labour | M.T. Catterson | 10,794 | 24.10 | ||
| Liberal | R. Dick | 7,350 | 16.41 | ||
| National Front | R. Bennett | 646 | 1.44 | ||
| Majority | 15,213 | 33.96 | |||
| Turnout | 78.72 | ||||
| Conservative hold | Swing | ||||
| Party | Candidate | Votes | % | ± | |
|---|---|---|---|---|---|
| Conservative | Sir John Page | 21,924 | 51.99 | ||
| Labour | M.P. Reynolds | 10,342 | 24.53 | ||
| Liberal | R.E. Bell | 9,903 | 23.48 | ||
| Majority | 11,582 | 27.47 | |||
| Turnout | 74.45 | ||||
| Conservative hold | Swing | ||||
| Party | Candidate | Votes | % | ± | |
|---|---|---|---|---|---|
| Conservative | Sir John Page | 23,950 | 51.55 | ||
| Liberal | R.E. Bell | 12,081 | 26.00 | ||
| Labour | L. Wagner | 10,430 | 22.45 | ||
| Majority | 11,869 | 25.55 | |||
| Turnout | 82.79 | ||||
| Conservative hold | Swing | ||||
| Party | Candidate | Votes | % | ± | |
|---|---|---|---|---|---|
| Conservative | Arthur John Page | 24,867 | 59.53 | ||
| Labour | Timothy P C Daniel | 11,462 | 27.44 | ||
| Liberal | Jeffrey F Smith | 5,440 | 13.02 | ||
| Majority | 13,405 | 32.09 | |||
| Turnout | 72.75 | ||||
| Conservative hold | Swing | ||||
Elections in the 1960s
| Party | Candidate | Votes | % | ± | |
|---|---|---|---|---|---|
| Conservative | Arthur John Page | 22,660 | 53.13 | ||
| Labour | Christopher Hubert Beaumont | 12,313 | 28.87 | ||
| Liberal | Harry Charles Seigal | 7,676 | 18.00 | ||
| Majority | 10,347 | 24.26 | |||
| Turnout | 80.15 | ||||
| Conservative hold | Swing | ||||
| Party | Candidate | Votes | % | ± | |
|---|---|---|---|---|---|
| Conservative | Arthur John Page | 23,132 | 53.91 | ||
| Labour | Kenneth W Childerhouse | 10,725 | 24.99 | ||
| Liberal | Arnold Eric Bender | 9,055 | 21.10 | ||
| Majority | 12,407 | 28.91 | |||
| Turnout | 79.83 | ||||
| Conservative hold | Swing | ||||
| Party | Candidate | Votes | % | ± | |
|---|---|---|---|---|---|
| Conservative | Arthur John Page | 18,526 | 55.77 | -15.15 | |
| Liberal | J. Wallbridge | 7,100 | 21.38 | N/A | |
| Labour | P.J. Jenkins | 6,030 | 18.15 | -10.93 | |
| New Conservative | John E. Dayton | 1,560 | 4.70 | N/A | |
| Majority | 11,426 | 34.39 | -7.45 | ||
| Turnout | 33,216 | ||||
| Conservative hold | Swing | ||||
Elections in the 1950s
| Party | Candidate | Votes | % | ± | |
|---|---|---|---|---|---|
| Conservative | Sir Albert Newby Braithwaite | 30,512 | 70.92 | ||
| Labour | P. J. Jenkins | 12,512 | 29,08 | ||
| Majority | 18,000 | 41.84 | |||
| Turnout | 79.24 | ||||
| Conservative hold | Swing | ||||
| Party | Candidate | Votes | % | ± | |
|---|---|---|---|---|---|
| Conservative | Sir Albert Newby Braithwaite | 31,321 | 70.63 | ||
| Labour | Richard Lawrence Leonard | 13,024 | 29.37 | ||
| Majority | 18,297 | 41.26 | |||
| Turnout | 81.19 | ||||
| Conservative hold | Swing | ||||
| Party | Candidate | Votes | % | ± | |
|---|---|---|---|---|---|
| Conservative | Sir Albert Newby Braithwaite | 26,549 | 67.47 | ||
| Labour | Leslie Littlewood | 12,802 | 32.53 | ||
| Majority | 13,747 | 34.93 | |||
| Turnout | 83.76 | ||||
| Conservative hold | Swing | ||||
| Party | Candidate | Votes | % | ± | |
|---|---|---|---|---|---|
| Conservative | Sir Albert Newby Braithwaite | 22,826 | 72.00 | +13.46 | |
| Labour | Leslie Littlewood | 8,877 | 28.00 | -13.46 | |
| Majority | 13,949 | 44.00 | +14.97 | ||
| Turnout | 31,703 | ||||
| Conservative hold | Swing | ||||
| Party | Candidate | Votes | % | ± | |
|---|---|---|---|---|---|
| Conservative | Norman Adolph Henry Bower | 23,744 | 58.54 | ||
| Labour | Leslie Littlewood | 11,971 | 29.51 | ||
| Liberal | Philip Montague Syrett | 4,846 | 11.95 | ||
| Majority | 11,773 | 29,03 | |||
| Turnout | 86.70 | ||||
| Conservative hold | Swing | ||||
Election in the 1940s
| Party | Candidate | Votes | % | ± | |
|---|---|---|---|---|---|
| Conservative | Norman Adolph Henry Bower | 28,617 | 49.85 | ||
| Labour | J. Thompson | 18,961 | 33.03 | ||
| Liberal | Hubert Winthrop Young | 7,364 | 12.83 | ||
| Common Wealth | Hugh McDowall Lawson | 2,462 | 4.29 | ||
| Majority | 9,656 | 16.82 | |||
| Turnout | |||||
| Conservative win (new seat) | |||||
See also
Notes and references
- Notes
- ↑ A borough constituency (for the purposes of election expenses and type of returning officer)
- ↑ As with all constituencies, the constituency elects one Member of Parliament (MP) by the first past the post system of election at least every five years.
- References
- ↑ "Electorate Figures - Boundary Commission for England". 2011 Electorate Figures. Boundary Commission for England. 4 March 2011. Retrieved 13 March 2011.
- 1 2 largest swings at each parliamentary election
- ↑ Leigh Rayment's Historical List of MPs – Constituencies beginning with "H" (part 1)
- ↑ "Election Data 2015". Electoral Calculus. Archived from the original on 17 October 2015. Retrieved 17 October 2015.
- ↑ http://www.harrow.gov.uk/www2/mgElectionAreaResults.aspx?XXR=0&ID=113&RPID=85339708
- ↑ http://www.harrowtimes.co.uk/news/11888976.Harrow_West__Final_countdown_to_General_Election_2015/
- ↑ http://www.libdems.org.uk/chris_noyce
- ↑ http://london.greenparty.org.uk/elections/2015-general-election.html
- ↑ "Election Data 2010". Electoral Calculus. Archived from the original on 17 October 2015. Retrieved 17 October 2015.
- ↑ BBC News http://news.bbc.co.uk/2/shared/election2010/results/constituency/c05.stm. Missing or empty
|title=(help) - ↑ Changes based upon 2005 notional results
- ↑ "Election Data 2005". Electoral Calculus. Archived from the original on 15 October 2011. Retrieved 18 October 2015.
- ↑ "Election Data 2001". Electoral Calculus. Archived from the original on 15 October 2011. Retrieved 18 October 2015.
- ↑ "Election Data 1997". Electoral Calculus. Archived from the original on 15 October 2011. Retrieved 18 October 2015.
- ↑ "Election Data 1992". Electoral Calculus. Archived from the original on 15 October 2011. Retrieved 18 October 2015.
- ↑ "Election Data 1987". Electoral Calculus. Archived from the original on 15 October 2011. Retrieved 18 October 2015.
- ↑ "Election Data 1983". Electoral Calculus. Archived from the original on 15 October 2011. Retrieved 18 October 2015.
Coordinates: 51°35′06″N 0°21′50″W / 51.585°N 0.364°W