Goodman relation
In materials science and fatigue, the Goodman relation is an equation used to quantify the interaction of mean and alternating stresses on the fatigue life of a material.
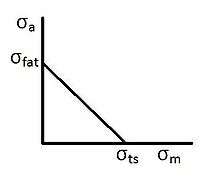
A Goodman diagram,[1][2] sometimes called a Haigh diagram[3] or a Haigh-Soderberg diagram,[4] is a graph of (linear) mean stress vs. (linear) alternating stress, showing when the material fails at some given number of cycles.
A scatterplot of experimental data shown on such a plot can often be approximated by a parabola known as the Gerber line, which can in turn be (conservatively) approximated by a straight line called the Goodman line. [4][5]
Mathematical description

The Goodman relation can be represented mathematically as:
Where is the alternating stress, is the mean stress, is the fatigue limit for completely reversed loading, and is the ultimate tensile strength of the material. The general trend given by the Goodman relation is one of decreasing fatigue life with increasing mean stress for a given level of alternating stress. The relation can be plotted to determine the safe cyclic loading of a part; if the coordinate given by the mean stress and the alternating stress lies under the curve given by the relation, then the part will survive. If the coordinate is above the curve, then the part will fail for the given stress parameters.[6]
References
- ↑ Herbert J. Sutherland and John F. Mandell. "Optimized Goodman diagram for the analysis of fiberglass composites used in wind turbine blades".
- ↑ David Roylance. "Fatigue". 2001.
- ↑ "Fatigue Theory > Total Life (S-N) Analysis"
- 1 2 Tapany Udomphol. "Fatigue of metals". 2007.
- ↑ "Fatigue" Figure 3.9
- ↑ Hertzberg, p. 530-31.
Bibliography
- Goodman, J., Mechanics Applied to Engineering, Longman, Green & Company, London, 1899
- Hertzberg, Richard W., Deformation and Fracture Mechanics and Engineering Materials. John Wiley and Sons, Hoboken, NJ: 1996.
- Mars, W. V., Computed dependence of rubber's fatigue behavior on strain crystallization. Rubber Chemistry and Technology, 82(1), 51-61. 2009
Further reading
- Mott, Robert L. (2004). Machine elements in mechanical design (4th ed.). Upper Saddle River, N.J.: Pearson Prentice Hall. pp. 190–192. ISBN 0130618853.
- Nisbett, Richard G. Budynas, J. Keith (2008). Shigley's mechanical engineering design (8th ed.). Boston [Mass.]: McGraw-Hill Higher Education. pp. 295–300. ISBN 9780073121932.