Gedling Borough Council election, 2007
| | |||||||||||||||||||||||||||||||||||||||||||||||||||||||||
| |||||||||||||||||||||||||||||||||||||||||||||||||||||||||
| |||||||||||||||||||||||||||||||||||||||||||||||||||||||||
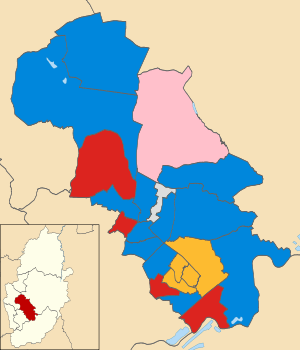
Map of the results of the 2007 Gedling council election. Conservatives in blue, Labour in red, Liberal Democrats in yellow, Calverton First Independents in pink and independent in grey.
The 2007 Gedling Borough Council election took place on 3 May 2007 to elect members of Gedling Borough Council in Nottinghamshire, England. The whole council was up for election and the Conservative party gained overall control of the council from no overall control.[1]
Election result
The results saw the Conservative win a majority on the council, which they had previously shared control of with Labour.[2] The Conservatives took 28 seats, up from 22 before the election.[2] Labour dropped 11 seats to end level with the Liberal Democrats, who gained 2 seats, on 9 councillors.[2] Overall turnout in the election was 40.4%,[3] up from 32.4% in 2003.[4]
| Gedling Local Election Result 2007[3][5] | ||||||||||
|---|---|---|---|---|---|---|---|---|---|---|
| Party | Seats | Gains | Losses | Net gain/loss | Seats % | Votes % | Votes | +/− | ||
| Conservative | 28 | 7 | 1 | +6 | 56.0 | 44.9 | 37,183 | +2.0% | ||
| Labour | 9 | 1 | 12 | -11 | 18.0 | 33.7 | 27,925 | -7.4% | ||
| Liberal Democrat | 9 | 2 | 0 | +2 | 18.0 | 14.9 | 12,339 | +3.6% | ||
| Calverton First Independents | 3 | 2 | 0 | +2 | 6.0 | 4.0 | 3,334 | +0.7% | ||
| Independent | 1 | 1 | 0 | +1 | 2.0 | 1.3 | 1,063 | +0.0% | ||
| UKIP | 0 | 0 | 0 | 0 | 0 | 0.9 | 780 | +0.9% | ||
| Green | 0 | 0 | 0 | 0 | 0 | 0.2 | 165 | +0.1% | ||
One Labour candidate was unopposed at the election.[3]
Ward results
| Party | Candidate | Votes | % | ± | |
|---|---|---|---|---|---|
| Labour | Denis Beeston | unopposed | |||
| Labour hold | Swing | ||||
| Party | Candidate | Votes | % | ± | |
|---|---|---|---|---|---|
| Conservative | Wilf Doe | 867 | |||
| Conservative | Gillian Fullwood | 854 | |||
| Conservative | Sally Mason-Kempster | 838 | |||
| Labour | Stella Lane | 737 | |||
| Labour | Andrew Rigby | 725 | |||
| Labour | Vivienne McCrossen | 707 | |||
| Turnout | 4,728 | 32.3 | +6.4 | ||
| Conservative gain from Labour | Swing | ||||
| Conservative gain from Labour | Swing | ||||
| Conservative gain from Labour | Swing | ||||
| Party | Candidate | Votes | % | ± | |
|---|---|---|---|---|---|
| Conservative | Patricia Blandamer | 702 | |||
| Conservative | Alan Bexon | 663 | |||
| Liberal Democrat | Richard Berry | 658 | |||
| Liberal Democrat | Richard Fife | 595 | |||
| Labour | Ian Howarth | 291 | |||
| Labour | Brigitte Maguire | 274 | |||
| Turnout | 3,183 | 54.6 | +10.7 | ||
| Conservative hold | Swing | ||||
| Conservative hold | Swing | ||||
| Party | Candidate | Votes | % | ± | |
|---|---|---|---|---|---|
| Calverton First Independents | William Peet | 1,175 | |||
| Calverton First Independents | Anthony Barton | 1,094 | |||
| Calverton First Independents | Grant Withers | 1,065 | |||
| Labour | Gareth Griffiths | 669 | |||
| Labour | Pat Osbaldiston | 444 | |||
| Labour | Daniel Taylor | 443 | |||
| Turnout | 4,890 | 34.4 | -0.6 | ||
| Independent hold | Swing | ||||
| Independent gain from Labour | Swing | ||||
| Independent gain from Labour | Swing | ||||
| Party | Candidate | Votes | % | ± | |
|---|---|---|---|---|---|
| Conservative | Robert Day | 991 | |||
| Conservative | Wendy Golland | 980 | |||
| Conservative | Richard Goodwin | 959 | |||
| Labour | Dennis Jones | 706 | |||
| Labour | Cheryl Hewlett | 677 | |||
| Labour | Christina Luckett | 657 | |||
| Liberal Democrat | Andrew Dunkin | 385 | |||
| Liberal Democrat | Andrew Sowter | 325 | |||
| Turnout | 5,680 | 39.9 | +11.3 | ||
| Conservative hold | Swing | ||||
| Conservative hold | Swing | ||||
| Conservative hold | Swing | ||||
| Party | Candidate | Votes | % | ± | |
|---|---|---|---|---|---|
| Labour | Seamus Creamer | 992 | |||
| Labour | Darrell Pulk | 987 | |||
| Labour | Paul Feeney | 961 | |||
| Conservative | Elaine Goodwin | 799 | |||
| Conservative | Thomas Butcher | 771 | |||
| Conservative | Mick Middleton | 768 | |||
| Liberal Democrat | Michael Shucksmith | 324 | |||
| Turnout | 5,602 | 38.4 | +8.7 | ||
| Labour hold | Swing | ||||
| Labour hold | Swing | ||||
| Labour hold | Swing | ||||
| Party | Candidate | Votes | % | ± | |
|---|---|---|---|---|---|
| Labour | Peter Barnes | 706 | |||
| Labour | Sandra Barnes | 693 | |||
| Conservative | Hazel Wilson | 461 | |||
| Conservative | Michael Smedley | 459 | |||
| Turnout | 2,319 | 33.8 | +5.4 | ||
| Labour hold | Swing | ||||
| Labour hold | Swing | ||||
| Party | Candidate | Votes | % | ± | |
|---|---|---|---|---|---|
| Liberal Democrat | Gordon Tunnicliffe | 1,115 | |||
| Liberal Democrat | Marguerite Wright | 1,041 | |||
| Liberal Democrat | Margaret Dunkin | 985 | |||
| Conservative | Edward Godfrey | 634 | |||
| Conservative | Judith Nicholson | 622 | |||
| Conservative | Kevin Pitman | 619 | |||
| Labour | Jenny Hollingsworth | 409 | |||
| Labour | Allan Leadbeater | 393 | |||
| Labour | Ned Flaherty | 348 | |||
| Green | Helen Collyer | 165 | |||
| UKIP | Gemma Wolfe | 102 | |||
| Turnout | 6,433 | 43.7 | +7.5 | ||
| Liberal Democrat hold | Swing | ||||
| Liberal Democrat hold | Swing | ||||
| Liberal Democrat hold | Swing | ||||
| Party | Candidate | Votes | % | ± | |
|---|---|---|---|---|---|
| Independent | Harvey Maddock | 356 | 58.2 | +58.2 | |
| Labour | Henry Wheeler | 256 | 41.8 | -10.9 | |
| Majority | 100 | 16.3 | |||
| Turnout | 612 | 36.4 | +7.8 | ||
| Independent gain from Labour | Swing | ||||
| Party | Candidate | Votes | % | ± | |
|---|---|---|---|---|---|
| Conservative | Rodney Kempster | 954 | |||
| Conservative | Vernon Bradley | 893 | |||
| Labour | Julia Buckby | 446 | |||
| Labour | Paul Maguire | 399 | |||
| UKIP | Peter Foulkes | 145 | |||
| Turnout | 2,837 | 41.5 | +4.4 | ||
| Conservative hold | Swing | ||||
| Conservative hold | Swing | ||||
| Party | Candidate | Votes | % | ± | |
|---|---|---|---|---|---|
| Conservative | Roland Spencer | 514 | 74.8 | +0.5 | |
| Labour | Marion Welton | 173 | 25.2 | -0.5 | |
| Majority | 341 | 49.6 | +0.9 | ||
| Turnout | 687 | 42.2 | +7.7 | ||
| Conservative hold | Swing | ||||
| Party | Candidate | Votes | % | ± | |
|---|---|---|---|---|---|
| Conservative | Veronica Pepper | 1,360 | |||
| Conservative | Gerald Clarke | 1,341 | |||
| Conservative | John Parr | 1,308 | |||
| Labour | Jenny Gale | 492 | |||
| Labour | Paul Wilkinson | 487 | |||
| Labour | Peter Osbaldiston | 482 | |||
| Liberal Democrat | Vera West | 351 | |||
| Liberal Democrat | Margaret Swift | 333 | |||
| Liberal Democrat | Minna Patterson | 299 | |||
| Turnout | 6,453 | 38.9 | +10.9 | ||
| Conservative hold | Swing | ||||
| Conservative hold | Swing | ||||
| Conservative hold | Swing | ||||
| Party | Candidate | Votes | % | ± | |
|---|---|---|---|---|---|
| Labour | William Clarke | 826 | |||
| Labour | Barbara Miller | 807 | |||
| Labour | James O'Riordan | 780 | |||
| Conservative | Allen Clarke | 541 | |||
| Conservative | Allen M Clarke | 462 | |||
| Conservative | Cheryl Clarke | 443 | |||
| Liberal Democrat | Nora Crossland | 243 | |||
| UKIP | Patricia Wolfe | 235 | |||
| Liberal Democrat | Michael Kirk | 232 | |||
| Turnout | 4,569 | 32.1 | +8.8 | ||
| Labour hold | Swing | ||||
| Labour gain from Conservative | Swing | ||||
| Labour hold | Swing | ||||
| Party | Candidate | Votes | % | ± | |
|---|---|---|---|---|---|
| Conservative | Patricia Andrews | 360 | 50.7 | +0.8 | |
| Labour | Philip Burnham | 289 | 40.7 | -9.4 | |
| UKIP | Peter Wolfe | 61 | 8.6 | +8.6 | |
| Majority | 71 | 10.0 | |||
| Turnout | 710 | 43.7 | +10.8 | ||
| Conservative gain from Labour | Swing | ||||
| Party | Candidate | Votes | % | ± | |
|---|---|---|---|---|---|
| Liberal Democrat | Raymond Poynter | 637 | |||
| Liberal Democrat | Andrew Ellwood | 600 | |||
| Labour | Ivan Gollop | 522 | |||
| Labour | Marje Paling | 424 | |||
| Conservative | Colin Blandamer | 242 | |||
| Conservative | Susan Jakeman | 240 | |||
| Turnout | 2,665 | 39.6 | +6.0 | ||
| Liberal Democrat hold | Swing | ||||
| Liberal Democrat gain from Labour | Swing | ||||
| Party | Candidate | Votes | % | ± | |
|---|---|---|---|---|---|
| Conservative | John Tanner | 1,127 | |||
| Conservative | Eric Collin | 1,060 | |||
| Conservative | Jennifer Spencer | 1,034 | |||
| Labour | John Truscott | 853 | |||
| Labour | Pauline Allan | 830 | |||
| Labour | Cameron Macleod | 715 | |||
| Liberal Democrat | Josephine James | 373 | |||
| Liberal Democrat | Alasdair Pratt | 320 | |||
| UKIP | Mark Brinsley-Day | 237 | |||
| Turnout | 6,549 | 43.8 | +9.8 | ||
| Conservative hold | Swing | ||||
| Conservative hold | Swing | ||||
| Conservative hold | Swing | ||||
| Party | Candidate | Votes | % | ± | |
|---|---|---|---|---|---|
| Conservative | Christopher Barnfather | 1,506 | |||
| Conservative | Colin Powell | 1,433 | |||
| Conservative | Mark Spencer | 1,148 | |||
| Independent | Raj Chandran | 707 | |||
| Labour | Carol Wright | 480 | |||
| Labour | Gwilym Griffith | 421 | |||
| Labour | John Kendrick | 411 | |||
| Turnout | 6,106 | 47.8 | +10.1 | ||
| Conservative hold | Swing | ||||
| Conservative hold | Swing | ||||
| Conservative hold | Swing | ||||
| Party | Candidate | Votes | % | ± | |
|---|---|---|---|---|---|
| Liberal Democrat | Anthony Gillam | 588 | |||
| Liberal Democrat | Christopher Pratt | 562 | |||
| Conservative | David Doherty | 411 | |||
| Conservative | Bernard Leaper | 404 | |||
| Labour | Christine Russell | 348 | |||
| Labour | Melanie Fredericks | 345 | |||
| Turnout | 2,658 | 41.6 | +16.5 | ||
| Liberal Democrat hold | Swing | ||||
| Liberal Democrat hold | Swing | ||||
| Party | Candidate | Votes | % | ± | |
|---|---|---|---|---|---|
| Conservative | Magdalen Roach | 1,033 | |||
| Conservative | Robert Tait | 1,033 | |||
| Conservative | Terence Pepper | 1,018 | |||
| Labour | Jennifer Cole | 845 | |||
| Labour | Stewart Ragsdale | 790 | |||
| Labour | Grace Millar | 786 | |||
| Turnout | 5,505 | 38.6 | +9.6 | ||
| Conservative gain from Labour | Swing | ||||
| Conservative gain from Labour | Swing | ||||
| Conservative gain from Labour | Swing | ||||
| Party | Candidate | Votes | % | ± | |
|---|---|---|---|---|---|
| Liberal Democrat | Paul Hughes | 511 | |||
| Liberal Democrat | Deva Kumarasiri | 491 | |||
| Labour | Gary Gregory | 436 | |||
| Labour | Colette Roberts | 379 | |||
| Conservative | Mavis Gunson | 244 | |||
| Conservative | Derek Smith | 223 | |||
| Turnout | 2,284 | 36.5 | +5.9 | ||
| Liberal Democrat hold | Swing | ||||
| Liberal Democrat gain from Labour | Swing | ||||
| Party | Candidate | Votes | % | ± | |
|---|---|---|---|---|---|
| Conservative | Francis Boot | 646 | 79.8 | +0.2 | |
| Labour | Rosemary Gollop | 164 | 20.2 | -0.2 | |
| Majority | 482 | 59.5 | +0.2 | ||
| Turnout | 810 | 54.5 | +14.5 | ||
| Conservative hold | Swing | ||||
| Party | Candidate | Votes | % | ± | |
|---|---|---|---|---|---|
| Conservative | Suzanne Prew-Smith | 1,478 | |||
| Conservative | Melvyn Shepherd | 1,375 | |||
| Conservative | Richard Nicholson | 1,365 | |||
| Labour | Ron McCrossen | 682 | |||
| Labour | Les Nourse | 629 | |||
| Labour | Joy Knowles | 609 | |||
| Liberal Democrat | Andrew Swift | 491 | |||
| Liberal Democrat | Sandra Thornley | 469 | |||
| Liberal Democrat | Roger Patterson | 411 | |||
| Turnout | 7,509 | 47.3 | +7.6 | ||
| Conservative hold | Swing | ||||
| Conservative hold | Swing | ||||
| Conservative hold | Swing | ||||
References
- ↑ "Gedling". BBC News Online. Retrieved 21 August 2011.
- 1 2 3 "Gedling won by resurgent Tories". BBC News Online. 4 May 2007. Retrieved 24 August 2011.
- 1 2 3 4 5 6 7 8 9 10 11 12 13 14 15 16 17 18 19 20 21 22 23 24 25 "Borough Council Elections 3 May 2007" (PDF). Gedling Borough Council. Retrieved 21 August 2011.
- ↑ "Gedling Borough Council elections summary" (PDF). Gedling Borough Council. Retrieved 24 August 2011.
- ↑ "Local Elections - Results for Gedling". Express.co.uk. Retrieved 24 August 2011.
This article is issued from Wikipedia - version of the 2/26/2016. The text is available under the Creative Commons Attribution/Share Alike but additional terms may apply for the media files.