Fylde (UK Parliament constituency)
| Fylde | |
|---|---|
|
County constituency for the House of Commons | |
|
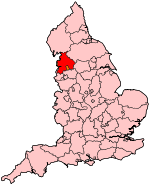
Boundary of Fylde in Lancashire for the 2010 general election. | |
|
Location of Lancashire within England. | |
| County | Lancashire |
| Electorate | 66,504 (December 2010)[1] |
| Major settlements | Kirkham, Wesham, Lytham St Annes, Freckleton |
| Current constituency | |
| Created | 1983 |
| Member of parliament | Mark Menzies (Conservative) |
| Number of members | One |
| Created from | Fylde North and Fylde South |
| 1918–1950 | |
| Type of constituency | County constituency |
| Replaced by | Fylde North and Fylde South |
| Overlaps | |
| European Parliament constituency | North West England |

Fylde is a Lancashire constituency[n 1] represented in the House of Commons of the UK Parliament since 2010 by Mark Menzies, a Conservative.[n 2]
History
The Fylde constituency was originally formed for the 1918 general election, but was abolished for the 1950 general election, when it was split into Fylde North and Fylde South. For the 1983 General Election those two constituencies were merged to form a new Fylde constituency.
The seat was reduced in the boundary review leading to the United Kingdom general election, 2010, losing most of its elements from the Borough of Wyre and the City of Preston to the new seat of Wyre and Preston North.
Boundaries
1918-1950: The Urban Districts of Fleetwood, Kirkham, Longridge, Poulton-le-Fylde, Thornton, and Walton-le-Dale, the Rural District of Preston, and part of the Rural District of Fylde.
1983-1997: The Borough of Fylde, and the Borough of Preston ward of Preston Rural West.
1997-2010: The Borough of Fylde, the Borough of Preston wards of Ingol and Preston Rural West, and the Borough of Wyre ward of Great Eccleston.
2010-present: The Borough of Fylde, and the City of Preston ward of Lea.
The constituency has three main population centres, namely Kirkham/Wesham, Lytham St Annes and Freckleton. Kirkham, Wesham and Freckleton are small towns with some light industrial development and have a considerable Labour vote, but Lytham and St Annes are comfortable seaside resorts, favoured by families and retired couples, and along with the more rural parts of the seat, are safely Conservative.
Members of Parliament
MPs 1918–1950
| Election | Member[2] | Party | |
|---|---|---|---|
| 1918 | Wilfrid William Ashley | Conservative | |
| 1922 | Lord Stanley | Conservative | |
| 1938 by-election | Claude Lancaster | Conservative | |
| 1950 | constituency split into Fylde North and Fylde South | ||
MPs since 1983
| Election | Member[2] | Party | |
|---|---|---|---|
| 1983 | Sir Edward Gardner | Conservative | |
| 1987 | Michael Jack | Conservative | |
| 2010 | Mark Menzies | Conservative | |
Elections
Elections in the 2010s
| Party | Candidate | Votes | % | ± | |
|---|---|---|---|---|---|
| Conservative | Mark Menzies | 21,406 | 49.1 | −3.1 | |
| Labour | Jed Sullivan | 8,182 | 18.8 | −1.0 | |
| UKIP | Paul White | 5,569 | 12.8 | +8.3 | |
| Independent | Mike Hill | 5,166 | 11.9 | +11.9 | |
| Liberal Democrat | Freddie van Mierlo | 1,623 | 3.7 | −18.3 | |
| Green | Bob Dennett | 1,381 | 3.2 | +1.7 | |
| Northern | Elizabeth Clarkson | 230 | 0.5 | +0.5 | |
| Majority | 13,224 | 30.4 | +0.2 | ||
| Turnout | 43,557 | 66.3 | +0.0 | ||
| Conservative hold | Swing | ||||
| Party | Candidate | Votes | % | ± | |
|---|---|---|---|---|---|
| Conservative | Mark Menzies | 22,826 | 52.2 | −1.2 | |
| Liberal Democrat | Bill Winlow | 9,641 | 22.1 | +6.2 | |
| Labour | Liam Robinson | 8,624 | 19.7 | −5.9 | |
| UKIP | Martin Bleeker | 1,945 | 4.5 | +4.5 | |
| Green | Phillip Mitchell | 654 | 1.5 | +1.5 | |
| Majority | 13,185 | 30.2 | |||
| Turnout | 43,690 | 66.3 | +7.0 | ||
| Conservative hold | Swing | +4.5 | |||
Elections in the 2000s
| Party | Candidate | Votes | % | ± | |
|---|---|---|---|---|---|
| Conservative | John Michael Jack | 24,287 | 53.4 | +1.1 | |
| Labour | William Parbury | 11,828 | 26.0 | −4.8 | |
| Liberal Democrat | Bill Winlow | 7,748 | 17.0 | +2.2 | |
| Liberal | Tim Akeroyd | 1,647 | 3.6 | N/A | |
| Majority | 12,459 | 27.4 | |||
| Turnout | 45,510 | 60.1 | −0.8 | ||
| Conservative hold | Swing | +2.9 | |||
| Party | Candidate | Votes | % | ± | |
|---|---|---|---|---|---|
| Conservative | John Michael Jack | 23,383 | 52.3 | +3.4 | |
| Labour | John Robert Stockton | 13,773 | 30.8 | −0.9 | |
| Liberal Democrat | John Lovet Begg | 6,599 | 14.8 | +0.1 | |
| UKIP | Mrs. Lesley Frances Brown | 982 | 2.2 | N/A | |
| Majority | 9,610 | 21.5 | |||
| Turnout | 44,737 | 60.9 | −12.0 | ||
| Conservative hold | Swing | ||||
Elections in the 1990s
| Party | Candidate | Votes | % | ± | |
|---|---|---|---|---|---|
| Conservative | John Michael Jack | 25,443 | 48.87 | −11.3 | |
| Labour | John L. Garrett | 16,480 | 31.65 | +13.1 | |
| Liberal Democrat | William L. Greene | 7,609 | 14.61 | −6.1 | |
| Referendum | David J. Britton | 2,372 | 4.56 | N/A | |
| Natural Law | Terry B. Kerwin | 163 | 0.31 | N/A | |
| Majority | 8,963 | 17.2 | |||
| Turnout | 52,069 | 72.9 | |||
| Conservative hold | Swing | ||||
| Party | Candidate | Votes | % | ± | |
|---|---|---|---|---|---|
| Conservative | John Michael Jack | 30,639 | 61.4 | +0.7 | |
| Liberal Democrat | Nigel Cryer | 9,648 | 19.3 | −4.9 | |
| Labour | Ms. Carol Hughes | 9,382 | 18.8 | +4.5 | |
| Natural Law | Peter Douglas Napier Leadbetter | 239 | 0.5 | N/A | |
| Majority | 20,991 | 42.1 | +5.6 | ||
| Turnout | 49,908 | 78.5 | +1.5 | ||
| Conservative hold | Swing | +2.8 | |||
Elections in the 1980s
| Party | Candidate | Votes | % | ± | |
|---|---|---|---|---|---|
| Conservative | John Michael Jack | 29,559 | 60.7 | −2.2 | |
| Liberal | Mrs. Elizabeth Anne Smith | 11,787 | 24.2 | −0.1 | |
| Labour | Dr. Geoffrey Wilfred Tracey Smith | 6,955 | 14.3 | +3.4 | |
| Restore Capital Punishment | Harold Fowler | 405 | 0.8 | −1.2 | |
| Majority | 17,772 | 36.5 | |||
| Turnout | 48,706 | 77.0 | |||
| Conservative hold | Swing | ||||
| Party | Candidate | Votes | % | ± | |
|---|---|---|---|---|---|
| Conservative | Sir Edward Gardner | 27,879 | 62.9 | N/A | |
| Liberal | Mrs. Elizabeth Anne Smith | 10,777 | 24.3 | N/A | |
| Labour | David John King | 4,821 | 10.9 | N/A | |
| Independent | Harold Fowler | 863 | 2.0 | N/A | |
| Majority | 17,102 | 38.6 | N/A | ||
| Turnout | 44,340 | 71.2 | N/A | ||
| Conservative win (new seat) | |||||
Election in the 1940s
| Party | Candidate | Votes | % | ± | |
|---|---|---|---|---|---|
| Conservative | Claude Granville Lancaster | 37,930 | 61.36 | ||
| Labour | E Hewitt | 22,102 | 35.75 | ||
| Common Wealth | K Heath | 1,784 | 2.89 | n/a | |
| Majority | 15,828 | 25.61 | |||
| Turnout | 70.60 | ||||
| Conservative hold | Swing | ||||
Elections in the 1930s
| Party | Candidate | Votes | % | ± | |
|---|---|---|---|---|---|
| Conservative | Claude Granville Lancaster | 38,263 | |||
| Labour | Mabel Tylecote | 17,648 | |||
| Majority | 20,615 | ||||
| Turnout | |||||
| Conservative hold | Swing | ||||
| Party | Candidate | Votes | % | ± | |
|---|---|---|---|---|---|
| Conservative | Lord Stanley | 39,731 | 70.81 | n/a | |
| Labour | T. McNamee | 16,379 | 29.19 | n/a | |
| Majority | 23,352 | 41.62 | n/a | ||
| Turnout | 71.99 | n/a | |||
| Conservative hold | Swing | n/a | |||
| Party | Candidate | Votes | % | ± | |
|---|---|---|---|---|---|
| Conservative | Lord Stanley | Unopposed | n/a | n/a | |
| Conservative hold | Swing | n/a | |||
Elections in the 1920s
| Party | Candidate | Votes | % | ± | |
|---|---|---|---|---|---|
| Unionist | Lord Stanley | 29,894 | 64.7 | ||
| Labour | Joseph Williamson | 16,318 | 35.3 | ||
| Majority | 13,576 | 29.4 | |||
| Turnout | 46,212 | ||||
| Unionist hold | Swing | ||||
| Party | Candidate | Votes | % | ± | |
|---|---|---|---|---|---|
| Unionist | Lord Stanley | 16,510 | 55.5 | n/a | |
| Liberal | Robert Parkinson Tomlinson | 13,230 | 44.5 | n/a | |
| Majority | 3,280 | 11.0 | n/a | ||
| Turnout | 29,740 | n/a | |||
| Unionist hold | Swing | n/a | |||
See also
References
- ↑ A county constituency (for the purposes of election expenses and type of returning officer)
- ↑ As with all constituencies, the constituency elects one Member of Parliament (MP) by the first past the post system of election at least every five years.
- ↑ "Electorate Figures - Boundary Commission for England". 2011 Electorate Figures. Boundary Commission for England. 4 March 2011. Retrieved 13 March 2011.
- 1 2 Leigh Rayment's Historical List of MPs – Constituencies beginning with "F"
- ↑ "Election Data 2015". Electoral Calculus. Archived from the original on 17 October 2015. Retrieved 17 October 2015.
- ↑ "Fylde". BBC News Online. Retrieved 8 May 2015.
- ↑ "Election Data 2010". Electoral Calculus. Archived from the original on 17 October 2015. Retrieved 17 October 2015.
- ↑ "Election Data 2005". Electoral Calculus. Archived from the original on 15 October 2011. Retrieved 18 October 2015.
- ↑ "Election Data 2001". Electoral Calculus. Archived from the original on 15 October 2011. Retrieved 18 October 2015.
- ↑ "Election Data 1997". Electoral Calculus. Archived from the original on 15 October 2011. Retrieved 18 October 2015.
- ↑ "Election Data 1992". Electoral Calculus. Archived from the original on 15 October 2011. Retrieved 18 October 2015.
- ↑ "UK General Election results April 1992". Richard Kimber's Political Science Resources. Politics Resources. 9 April 1992. Retrieved 2010-12-06.
- ↑ "Election Data 1987". Electoral Calculus. Archived from the original on 15 October 2011. Retrieved 18 October 2015.
- ↑ "Election Data 1983". Electoral Calculus. Archived from the original on 15 October 2011. Retrieved 18 October 2015.
- ↑ The Liberal Year Book, 1930
- ↑ The Liberal Year Book, 1930