Resting state fMRI
![Movie of the in vivo BOLD signal from the cortical surface of a human subject, acquired using fMRI and pre-processed to suppress the noise[1][2], from the Human Connectome Project, played back at a real-time rate. The BOLD signal intensities are visualized on a smoothed cortical surface. At each point on the cortex, white color represents the average BOLD signal while blue and red colors represents lower and higher signal than average BOLD signal respectively[3].](../I/m/-Temporal-Non-Local-Means-Filtering-Reveals-Real-Time-Whole-Brain-Cortical-Interactions-in-Resting-pone.0158504.s002.ogv.jpg)
Resting state fMRI (rsfMRI or R-fMRI) is a method of functional brain imaging that can be used to evaluate regional interactions that occur when a subject is not performing an explicit task.[3][4] This resting brain activity is observed through changes in blood flow in the brain which creates what is referred to as a blood-oxygen-level dependent (BOLD) signal that can be measured using functional Magnetic Resonance Imaging (fMRI). Because brain activity is present even in the absence of an externally prompted task, any brain region will have spontaneous fluctuations in BOLD signal. The resting state approach is useful to explore the brain’s functional organization and to examine if it is altered in neurological or psychiatric diseases. Resting-state functional connectivity research has revealed a number of networks which are consistently found in healthy subjects, different stages of consciousness and across species, and represent specific patterns of synchronous activity.[5][6][7]
Basics of fMRI

Functional magnetic resonance imaging (functional MRI or fMRI) is a specific magnetic resonance imaging (MRI) procedure that measures brain activity by detecting associated changes in blood flow. More specifically, brain activity is measured through low frequency BOLD signal in the brain.[8]
The procedure is similar to MRI but uses the change in magnetization between oxygen-rich and oxygen-poor blood as its basic measure. This measure is frequently corrupted by noise from various sources and hence statistical procedures are used to extract the underlying signal. The resulting brain activation can be presented graphically by color-coding the strength of activation across the brain or the specific region studied. The technique can localize activity to within millimeters but, using standard techniques, no better than within a window of a few seconds.[9]
FMRI is used both in research, and to a lesser extent, in clinical settings. It can also be combined and complemented with other measures of brain physiology such as EEG and NIRS.[10] Arterial spin labeling fMRI can be used as a complementary approach for assessing resting brain functions.[11]
Physiological basis
The physiological blood-flow response largely decides the temporal sensitivity, how well we can measure when neurons are active, in BOLD fMRI. The basic time resolution parameter is the sampling rate, or TR, which dictates how often a particular brain slice is excited and allowed to lose its magnetization. TRs could vary from the very short (500 ms) to the very long (3 seconds). For fMRI specifically, the haemodynamic response is assumed to last over 10 seconds, rising multiplicatively (that is, as a proportion of current value), peaking at 4 to 6 seconds, and then falling multiplicatively. Changes in the blood-flow system, the vascular system, integrate responses to neuronal activity over time. Because this response is a smooth continuous function, sampling with faster TRs helps only to map faster fluctuations like respiratory and heart rate signals.[12]
While fMRI strives to measure the neuronal activity in the brain, the BOLD signal can be influenced by many other physiological factors other than neuronal activity. For example, respiratory fluctuations and cardiovascular cycles affect the BOLD signal being measured in the brain and therefore are usually tried to be removed during processing of the raw fMRI data. Due to these sources of noise, there have been many experts who have approached the idea of resting state fMRI very skeptically during the early uses of fMRI. It has only been very recently that researchers have become confident that the signal being measured is not an artifact caused by other physiological function.[13]
Resting state functional connectivity between spatially distinct brain regions reflects the repeated history of co-activation patterns within these regions, thereby serving as a measure of plasticity.[14] Somatosensory input from acupuncture needles and electrical nerve stimulation modulates functional connectivity of resting state networks and regions of the secondary somatosensory cortex, thalamus, as well as association areas.[14]
History
Bharat Biswal
- In 1992, Bharat Biswal started his work as a graduate student at The Medical College of Wisconsin under the direction of his advisor, James S. Hyde, and discovered that the brain, even during rest, contains information about its functional organization. He had used fMRI to study how different regions of the brain communicate while the brain is at rest and not performing any active task. Though at the time, Biswal’s research was mostly disregarded and attributed to another signal source, his resting neuroimaging technique has now been widely replicated and considered a valid method of mapping functional brain networks. Mapping the brain’s activity while the body is at rest holds many potentials for brain research and even helps doctors diagnose various diseases of the brain.[3]
- Experiments by neurologist Marcus E. Raichle's lab at Washington University School of Medicine and other groups showed that the brain's energy consumption is increased by less than 5% of its baseline energy consumption while performing a focused mental task. These experiments showed that the brain is constantly active with a high level of activity even when the person is not engaged in focused mental work (the resting state). His lab has been primarily focused on finding the basis of this resting activity and is credited with many groundbreaking discoveries. These include the relative independence of blood flow and oxygen consumption during changes in brain activity, which provided the physiological basis of fMRI, as well the discovery of the well known Default Mode Network.[15]
Connectivity
Functional
Functional connectivity is the connectivity between brain regions that share functional properties. More specifically, it can be defined as the temporal correlation between spatially remote neurophysiological events, expressed as deviation from statistical independence across these events in distributed neuronal groups and areas.[16] This applies to both resting state and task-state studies. While functional connectivity can refer to correlations across subjects, runs, blocks, trials, or individual time points, resting state functional connectivity focuses on connectivity assessed across individual BOLD time points during resting conditions.[17] Functional connectivity has also been evaluated using the perfusion time series sampled with arterial spin labeled perfusion fMRI.[18] Functional connectivity MRI (fcMRI), which can include resting state fMRI and task-based MRI, might someday help provide more definitive diagnoses for mental health disorders such as bipolar disorder and may also aid in understanding the development and progression of post-traumatic stress disorder as well as evaluate the effect of treatment.[19] Functional connectivity has been suggested to be an expression of the network behavior underlying high level cognitive function partially because unlike structural connectivity, functional connectivity often changes on the order of seconds as in the case of Dynamic functional connectivity.
Structural
The connectivity of brain regions that are physically or anatomically attached to one another is referred to as structural connectivity. Regions of the brain do not have to be structurally connected to have functional connectivity, and a structural connection does not necessarily signify a functional link.[20] Several initiatives such as the Human Connectome Project try to build a connectome or a neural connectivity map that will shed light on the anatomical as well as functional connectivity within the healthy human brain.[21]
Networks
Default mode network
- The default mode network (DMN) is a network of brain regions that are active when an individual is awake and at rest.[22] The default mode network is an interconnected and anatomically defined brain system that preferentially activates when individuals focus on internal tasks such as daydreaming, envisioning the future, retrieving memories, and gauging others' perspectives.[23] It is negatively correlated with brain systems that focus on external visual signals. It is one of the most studied networks present during resting state and is one of the most easily visualized networks.[24]
Other resting state networks
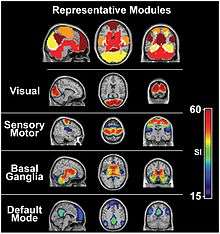
- Depending on the method of resting state analysis, functional connectivity studies have reported a number of neural networks that result to be strongly functionally connected during rest. The key networks, also referred as components, which are more frequently reported include: the DMN, the sensory/motor component, the executive control component, up to three different visual components, two lateralized frontal/parietal components, the auditory component and the temporal/parietal component.[25] As already reported, these resting-state networks consist of anatomically separated, but functionally connected regions displaying a high level of correlated BOLD signal activity. These networks are found to be quite consistent across studies, despite differences in the data acquisition and analysis techniques.[25][26] Importantly, most of these resting-state components represent known functional networks, that is, regions that are known to share and support cognitive functions.[6]
Analyzing Data
Processing data
Many programs exist for the processing of resting state fMRI data. Some of the most commonly used programs for processing and analyzing resting-state fMRI data include SPM, AFNI, FSL (esp. Melodic for ICA), CONN, C-PAC, and Connectome Computation System (CCS).
Common methods
There are many methods of both acquiring and processing rsfMRI data, yet there are two methods of analysis that have become the most popular methods for the analysis of functional connectivity in the brain.
Independent component analysis
- Independent component analysis (ICA) is a useful statistical approach in the detection of resting state networks. ICA separates a signal into non-overlapping spatial and time components. It is highly data-driven and allows for better removal of noisy components of the signal (motion, scanner drift, etc). It also has been shown to reliably extract default mode network as well as many other networks with very high consistency.[27]
Seed-based/Region of interest
- Another method of observing networks and connectivity in the brain is the Seed-Based or region of interest (ROI) method of analysis. In this case, signal from only a certain voxel or cluster of voxels known as the seed or ROI are used to calculate correlations with other voxels of the brain. This provides a much more precise and detailed look at specific connectivity in brain areas of interest.[28][29]
Other methods for characterizing resting-state networks include partial correlation, coherence and partial coherence, phase relationships, clustering, and graph theory.[30][31]
Reliability and Reproducibility
Resting-state functional magnetic resonance imaging (rfMRI) can image low-frequency fluctuations in the spontaneous brain activities, representing a popular tool for macro-scale functional connectomics to characterize inter-individual differences in normal brain function, mind-brain associations, and the various disorders. This suggests reliability and reproducibility for commonly used rfMRI-derived measures of the human brain functional connectomics. These metrics hold great potentials of accelerating biomarker identification for various brain diseases, which call the need of addressing reliability and reproducibility at first place.[32]
Combining imaging techniques

fMRI with EEG
Many imaging experts feel that in order to obtain the best combination of spatial and temporal information from brain activity, both fMRI as well as electroencephalography (EEG) should be used simultaneously. This dual technique combines the EEG’s well documented ability to characterize certain brain states with high temporal resolution and to reveal pathological patterns, with fMRI’s (more recently discovered and less well understood) ability to image blood dynamics through the entire brain with high spatial resolution. Up to now, EEG-fMRI has been mainly seen as an fMRI technique in which the synchronously acquired EEG is used to characterize brain activity (‘brain state’) across time allowing to map (through statistical parametric mapping, for example) the associated haemodynamic changes.[33]
The clinical value of these findings is the subject of ongoing investigations, but recent researches suggest an acceptable reliability for EEG-fMRI studies and better sensitivity in higher field scanner. Outside the field of epilepsy, EEG-fMRI has been used to study event-related (triggered by external stimuli) brain responses and provided important new insights into baseline brain activity in during resting wakefulness and sleep.[34]
fMRI with TMS
Transcranial magnetic stimulation (TMS) uses small and relatively precise magnetic fields to stimulate regions of the cortex without dangerous invasive procedures. When these magnetic fields stimulate an area of the cortex, focal blood flow increases at the site of stimulation as well as at distant sites anatomically connected to the stimulated location. Positron emission tomography (PET) can then be used to image the brain and changes in blood flow and results show very similar regions of connectivity confirming networks found in fMRI studies and TMS can also be used to support and provide more detailed information on the connected regions.[35]
Potential pitfalls
Potential pitfalls when using rsfMRI to determine functional network integrity are contamination of the BOLD signal by the before-mentioned sources of physiological noise such as heart rate, respiration ,[36][37] and head motion.[38][39][40][41] It is crucial that investigators that apply rsfMRI are aware of these confounding factors since they often bias results in studies where patients are compared to healthy controls in the direction of hypothesized effects (e.g. one might find lower coherence in the default network in the patient group, while the patient groups also moved more during the scan). Also, it has been shown that the use of global signal regression can produce artificial correlations between a small number of signals (e.g., two or three).[42] Fortunately, the brain has many signals.[43]
Current and future applications
Research using resting state fMRI has the potential to be applied in clinical context, including use in the assessment of many different diseases and mental disorders.[44]
Disease Condition and Changes in Resting State Functional Connectivity
- Alzheimer's disease: decreased connectivity[45]
- Autism: altered connectivity[46]
- Depression: abnormal connectivity[47][48][49]
- Schizophrenia: disrupted networks[50]
- Attention deficit hyperactivity disorder (ADHD): Altered "small networks" and Thalamus changes[51]
- Aging brain: disruption of brain systems and motor network[45]
- Epilepsy: disruption and decrease/increase in connectivity[52]
- Parkinson's disease: altered connectivity[53]
- Obsessive Compulsive Disorder:increase/decrease in connectivity[54]
- Pain Disorder: altered connectivity[55][56]
- Anorexia nervosa: connectivity alterations within corticolimbic circuitry and of insular cortex[57]
Other types of current and future clinical applications for resting state fMRI include identifying group differences in brain disease, obtaining diagnostic and prognostic information, longitudinal studies and treatment effects, clustering in heterogeneous disease states, and pre-operative mapping and targeting intervention.[58] As resting state measurements have no cognitive demands (instead of psychological experiments including tasks), cognitively impaired persons can also be measured easily.
See also
- Default mode network
- Issues in fMRI
- Medical image computing
- List of functional connectivity software
References
- ↑ Smith, Stephen M; Andersson, Jesper; Auerbach, Edward J.; Beckmann, Christian F; Bijsterbosch, Janine; Douaud, Gwenaëlle; Duff, Eugene; Feinberg, David A; Griffanti, Ludovica (2013-10-15). "Resting-state fMRI in the Human Connectome Project". NeuroImage. 80: 144–168. doi:10.1016/j.neuroimage.2013.05.039. ISSN 1053-8119. PMC 3720828
 . PMID 23702415.
 - 1 2 Bhushan, Chitresh; Chong, Minqi; Choi, Soyoung; Joshi, Anand A.; Haldar, Justin P.; Damasio, Hanna; Leahy, Richard M. (2016-07-08). "Temporal Non-Local Means Filtering Reveals Real-Time Whole-Brain Cortical Interactions in Resting fMRI". PLOS ONE. 11 (7): e0158504. doi:10.1371/journal.pone.0158504. ISSN 1932-6203. PMC 4938391. PMID 27391481.
- 1 2 Biswal, B. B. (2012). Resting state fMRI: A personal history. [Review]. Neuroimage, 62(2), p. 938-944.
- ↑ Buckner RL, Krienen FM, Yeo BT (2013). Opportunities and limitations of intrinsic functional connectivity MRI. Nature Neuroscience, 16(7), p. 832-837.
- ↑ Biswal, B. B. (2011). Resting State Functional Connectivity. Biological Psychiatry, 69(9), 200S-200S.
- 1 2 Rosazza, C., & Minati, L. (2011). Resting-state brain networks: literature review and clinical applications. Neurol Sci, 32(5), 773-785.
- ↑ Cole, David M. & Smith, Stephen M. & Beckmann, Christian F. (2010) "Advances and pitfalls in the analysis and interpretation of resting-state FMRI data." Frontiers in systems neuroscience 4
- ↑ DeYoe, E. A., Bandettini, P., Neitz, J., Miller, D., & Winans, P. (1994). Functional magnetic resonance imaging (FMRI) of the human brain. J Neurosci Methods, 54(2), 171-187.
- ↑ Bandettini, P. A. (2009). Seven topics in functional magnetic resonance imaging. J Integr Neurosci, 8(3), 371-403.
- ↑ Bandettini, P. (2007). Functional MRI today. Int J Psychophysiology, 63(2), 138-145.
- ↑ Chuang, KH. et al. (2008). Mapping resting-state functional connectivity using perfusion MRI. Neuroimage, 40(4), 1595-605
- ↑ Huettel, S. A.; Song, A. W.; McCarthy, G. (2009), Functional Magnetic Resonance Imaging (2 ed.), Massachusetts: Sinauer, ISBN 978-0-87893-286-3
- ↑ Damoiseaux, J. S., Rombouts, S., Barkhof, F., Scheltens, P., Stam, C. J., Smith, S. M., et al. (2006). Consistent resting-state networks across healthy subjects. Proceedings of the National Academy of Sciences of the United States of America, 103(37), 13848-13853.
- 1 2 Guerra-Carrillo, B.; Mackey, A. P.; Bunge, S. A. (21 February 2014). "Resting-State fMRI: A Window into Human Brain Plasticity". The Neuroscientist. 20 (5): 522–533. doi:10.1177/1073858414524442.
- ↑ Fox, M. D., Snyder, A. Z., Vincent, J. L., Corbetta, M., Van Essen, D. C., & Raichle, M. E. (2005). The human brain is intrinsically organized into dynamic, anticorrelated functional networks. Proceedings of the National Academy of Sciences of the United States of America, 102(27), 9673-9678.
- ↑ Biswal, B. B., VanKylen, J., & Hyde, J. S. (1997). Simultaneous assessment of flow and BOLD signals in resting-state functional connectivity maps. NMR in Biomedicine, 10(4-5), 165-170.
- ↑ Friston, K. (2009). Causal Modelling and Brain Connectivity in Functional Magnetic Resonance Imaging. [Editorial Material]. Plos Biology, 7(2), 220-225.
- ↑ Fernandez-Seara, MA. (2011). Effects on resting cerebral blood flow and functional connectivity induced by metoclopramide: a perfusion MRI study in healthy volunteers. Br J Pharmacol, 163(8), 1639-52
- ↑ Smith, S. M. (2012). The future of FMRI connectivity. Neuroimage, 62(2), 1257-1266.
- ↑ Biswal, B. B., Mennes, M., Zuo, X. N., Gohel, S., Kelly, C., Smith, S. M., et al. (2010). Toward discovery science of human brain function. Proc Natl Acad Sci U S A, 107(10), 4734-4739.
- ↑ Van Essen, D. C., & Ugurbil, K. (2012). The future of the human connectome. [Review]. Neuroimage, 62(2), 1299-1310.
- ↑ Raichle, M. E. (2015). The brain's default mode network. Annual Review of Neuroscience, 38(1), 433-447.
- ↑ Greicius, M. D., Krasnow, B., Reiss, A. L., & Menon, V. (2003). Functional connectivity in the resting brain: A network analysis of the default mode hypothesis. Proceedings of the National Academy of Sciences of the United States of America, 100(1), 253-258.
- ↑ Buckner, R. L. (2012). The serendipitous discovery of the brain's default network. Neuroimage, 62(2), 1137-1145.
- 1 2 Moussa, M. N., Steen, M. R., Laurienti, P. J., & Hayasaka, S. (2012). Consistency of network modules in resting-state FMRI connectome data. PLoS One, 7(8), e44428.
- ↑ Lee, M. H., Hacker, C. D., Snyder, A. Z., Corbetta, M., Zhang, D. Y., Leuthardt, E. C., et al. (2012). Clustering of Resting State Networks. PLoS One, 7(7).
- ↑ Beckmann, C. F., DeLuca, M., Devlin, J. T., & Smith, S. M. (2005). Investigations into resting-state connectivity using independent component analysis. Philosophical Transactions of the Royal Society B-Biological Sciences, 360(1457), 1001-1013.
- ↑ Margulies, D. S., Kelly, A. M. C., Uddin, L. Q., Biswal, B. B., Castellanos, F. X., & Milham, M. P. (2007). Mapping the functional connectivity of anterior cingulate cortex. Neuroimage, 37(2), 579-588.
- ↑ Van Dijk KRA, Hedden T, Venkataraman A, Evans KC, Lazar SW, and Buckner RL (2010) Intrinsic Functional Connectivity As a Tool For Human Connectomics: Theory, Properties, and Optimization. Journal of Neurophysiology. 103: 297-321.
- ↑ Chang, C., & Glover, G. H. (2010). Time-frequency dynamics of resting-state brain connectivity measured with fMRI. Neuroimage, 50(1), 81-98.
- ↑ Faria, A. V., Joel, S. E., Zhang, Y. J., Oishi, K., van Zjil, P. C. M., Miller, M. I., et al. (2012). Atlas-based analysis of resting-state functional connectivity: Evaluation for reproducibility and multi-modal anatomy-function correlation studies. Neuroimage, 61(3), 613-621.
- ↑ Zuo XN, Xing XX. (2014). Test-retest reliabilities of resting-state FMRI measurements in human brain functional connectomics: A systems neuroscience perspective. Neuroscience & Biobehavioral Reviews, 45, 100-118.
- ↑ Majeed, W., Magnuson, M., & Keilholz, S. D. (2009). Spatiotemporal Dynamics of Low Frequency Fluctuations in BOLD fMRI of the Rat. Journal of Magnetic Resonance Imaging, 30(2), 384-393.
- ↑ Keilholz, S. D., Magnuson, M., & Thompson, G. (2010). Evaluation of data-driven network analysis approaches for functional connectivity MRI. Brain Structure & Function, 215(2), 129-140.
- ↑ Fox, M. D., Halko, M. A., Eldaief, M. C., & Pascual-Leone, A. (2012). Measuring and manipulating brain connectivity with resting state functional connectivity magnetic resonance imaging (fcMRI) and transcranial magnetic stimulation (TMS). Neuroimage, 62(4), 2232-2243.
- ↑ Birn, R.M., Diamond, J.B., Smith, M.A., Bandettini, P.A., 2006. Separating respiratory-variation-related fluctuations from neuronal-activity-related fluctuations in fMRI. Neuroimage 31, 1536-1548.
- ↑ Chang, C., Glover, G.H., 2009. Relationship between respiration, end-tidal CO(2), and BOLD signals in resting-state fMRI. Neuroimage.
- ↑ Ing A, Schwarzbauer C (2012) A dual echo approach to motion correction for functional connectivity studies. NeuroImage 63: 1487–1497
- ↑ Van Dijk, K.R.A., Sabuncu, M.R., Buckner, R.L., 2012. The influence of head motion on intrinsic functional connectivity MRI. Neuroimage 59, 431-438.
- ↑ Power, J.D., Barnes, K.A., Snyder, A.Z., Schlaggar, B.L., Petersen, S.E., 2012. Spurious but systematic correlations in functional connectivity MRI networks arise from subject motion. Neuroimage 59, 2142-2154.
- ↑ Satterthwaite, T.D., Wolf, D.H., Loughead, J., Ruparel, K., Elliott, M.A., Hakonarson, H., Gur, R.C., Gur, R.E., 2012. Impact of in-scanner head motion on multiple measures of functional connectivity: relevance for studies of neurodevelopment in youth. Neuroimage 60, 623-632.
- ↑ Saad, Z.S., Gotts, S.J., Murpy, K., Chen, G., Jo, H.J., Martin, A., Cox, R.W., 2012. Brain Connectivity 2, 25-32.
- ↑ Cordes, D., Nandy, R.R., 2006. Neuroimage 29, 145-154.
- ↑ Holtbernd, F., & Eidelberg, D. (2012). Functional brain networks in movement disorders: recent advances. Current Opinion in Neurology, 25(4), p. 392-401.
- 1 2 Li, R., Wu, X., Chen, K., Fleisher, A. S., Reiman, E. M., & Yao, L. (2012). Alterations of Directional Connectivity among Resting-State Networks in Alzheimer Disease. AJNR Am J Neuroradiol.
- ↑ Müller, R-A., Shih, P., Keehn, B., Deyoe, J., Leyden, K., & Shukla, D. (2011). Underconnected but how? A survey of functional connectivity MRI studies in autism spectrum disorders. Cerebral Cortex, 21(10), 2233–2243.
- ↑ Anand A, Li Y, Wang Y, Wu J, Gao S, Kalnin A, et al. Activity and connectivity of mood regulating circuit in depression: a functional magnetic resonance study. Biological Psychiatry. 2005;15(10):1079-88.
- ↑ Greicius MD, Flores BH, Menon V, Glover GH, Solvason HB, Kenna H, et al. Resting-State Functional Connectivity in Major Depression: Abnormally Increased Contributions from Subgenual Cingulate Cortex and Thalamus. Biological Psychiatry. 2007;62(5):429-37.
- ↑ Anand A, Li Y, Wang Y, Lowe MJ, Dzemidzic M. Resting state corticolimbic connectivity abnormalities in unmedicated bipolar disorder and unipolar depression. Psychiatry Research-Neuroimaging. 2009;171(3):189-98.
- ↑ Venkataraman, A., Whitford, T. J., Westin, C. F., Golland, P., & Kubicki, M. (2012). Whole brain resting state functional connectivity abnormalities in schizophrenia. Schizophrenia Research, 139(1-3), 7-12.
- ↑ Uddin, L. Q., Kelly, A. M. C., Biswal, B. B., Margulies, D. S., Shehzad, Z., Shaw, D., et al. (2008). Network homogeneity reveals decreased integrity of default-mode network in ADHD. Journal of Neuroscience Methods, 169(1), 249-254.
- ↑ Wurina, Zang, Y. F., & Zhao, S. G. (2012). Resting-state fMRI studies in epilepsy. Neuroscience Bulletin, 28(4), 449-455.
- ↑ Tessitore, A., Amboni, M., Esposito, F., Russo, A., Picillo, M., Marcuccio, L., et al. (2012). Resting-state brain connectivity in patients with Parkinson's disease and freezing of gait. Parkinsonism & Related Disorders, 18(6), 781-787.
- ↑ Li, P., Li, S. F., Dong, Z. Y., Luo, J., Han, H. Y., Xiong, H. F., et al. (2012). Altered resting state functional connectivity patterns of the anterior prefrontal cortex in obsessive-compulsive disorder. Neuroreport, 23(11), 681-686.
- ↑ Otti A, Guendel H, Wohlschlager A, Zimmer C, Noll-Hussong M. Frequency shifts in the anterior default mode network and the salience network in chronic pain disorder. BMC Psychiatry. 2013;13:84.
- ↑ Otti A, Guendel H, Henningsen P, Zimmer C, Wohlschlaeger AM, Noll-Hussong M. Functional network connectivity of pain-related resting state networks in somatoform pain disorder: an exploratory fMRI study. J Psychiatry Neurosci. [Research Support, Non-U.S. Gov't]. 2013 Jan;38(1):57-65.
- ↑ Gaudio S, Wiemerslage L, Brooks SJ, Schiöth HB (2016). "A systematic review of resting-state functional-MRI studies in anorexia nervosa: Evidence for functional connectivity impairment in cognitive control and visuospatial and body-signal integration.". Neurosci Biobehav Rev. doi:10.1016/j.neubiorev.2016.09.032. PMID 27725172.
- ↑ Fox, M. D., & Greicius, M. (2010). Clinical applications of resting state functional connectivity. Front Syst Neurosci, 4, 19.