Froideville, Switzerland
| Froideville | ||
|---|---|---|
 | ||
| ||
 Froideville | ||
|
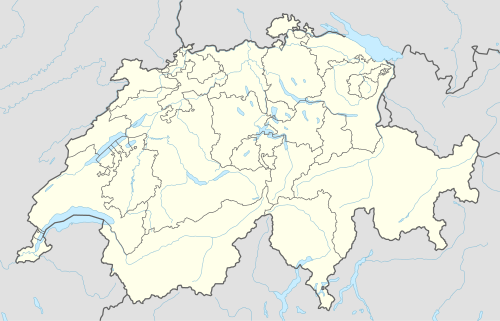
Location of Froideville  | ||
| Coordinates: 46°36′N 6°41′E / 46.600°N 6.683°ECoordinates: 46°36′N 6°41′E / 46.600°N 6.683°E | ||
| Country | Switzerland | |
| Canton | Vaud | |
| District | Gros-de-Vaud | |
| Government | ||
| • Mayor | Syndic | |
| Area[1] | ||
| • Total | 7.08 km2 (2.73 sq mi) | |
| Elevation | 819 m (2,687 ft) | |
| Population (Dec 2015[2]) | ||
| • Total | 2,429 | |
| • Density | 340/km2 (890/sq mi) | |
| Postal code | 1055 | |
| SFOS number | 5523 | |
| Surrounded by | Bottens, Corcelles-le-Jorat, Lausanne, Montpreveyres, Poliez-Pittet, Villars-Tiercelin | |
| Website |
www Profile (French), SFSO statistics | |

Froideville is a municipality in the district of Gros-de-Vaud in the canton of Vaud in Switzerland.
History
Froideville is first mentioned in 1284 as Frigida Villa.[3]
Geography
Froideville has an area, as of 2009, of 7.08 square kilometers (2.73 sq mi). Of this area, 2.71 km2 (1.05 sq mi) or 38.3% is used for agricultural purposes, while 3.63 km2 (1.40 sq mi) or 51.3% is forested. Of the rest of the land, 0.73 km2 (0.28 sq mi) or 10.3% is settled (buildings or roads).[4]
Of the built up area, housing and buildings made up 6.9% and transportation infrastructure made up 2.8%. Out of the forested land, all of the forested land area is covered with heavy forests. Of the agricultural land, 27.5% is used for growing crops and 10.0% is pastures.[4]
The municipality was part of the Echallens District until it was dissolved on 31 August 2006, and Froideville became part of the new district of Gros-de-Vaud.[5]
The municipality is located in the Jorat range.
Coat of arms
The blazon of the municipal coat of arms is Per fess: 1. Azure a Cross Pattee Or; 2. Gules, a plough Argent.[6]
Demographics
Froideville has a population (as of December 2015) of 2,429.[7] As of 2008, 9.5% of the population are resident foreign nationals.[8] Over the last 10 years (1999–2009 ) the population has changed at a rate of 16.7%. It has changed at a rate of 11.1% due to migration and at a rate of 5.7% due to births and deaths.[9]
Most of the population (as of 2000) speaks French (1,326 or 91.3%), with German being second most common (77 or 5.3%) and Italian being third (13 or 0.9%).[10]
Of the population in the municipality 281 or about 19.3% were born in Froideville and lived there in 2000. There were 703 or 48.4% who were born in the same canton, while 233 or 16.0% were born somewhere else in Switzerland, and 181 or 12.5% were born outside of Switzerland.[10]
In 2008 there were 15 live births to Swiss citizens and 1 birth to non-Swiss citizens, and in same time span there were 6 deaths of Swiss citizens. Ignoring immigration and emigration, the population of Swiss citizens increased by 9 while the foreign population increased by 1. There were 3 Swiss men and 7 Swiss women who immigrated back to Switzerland. At the same time, there were 3 non-Swiss men and 5 non-Swiss women who immigrated from another country to Switzerland. The total Swiss population change in 2008 (from all sources, including moves across municipal borders) was an increase of 39 and the non-Swiss population increased by 7 people. This represents a population growth rate of 2.9%.[8]
The age distribution, as of 2009, in Froideville is; 228 children or 13.2% of the population are between 0 and 9 years old and 236 teenagers or 13.7% are between 10 and 19. Of the adult population, 171 people or 9.9% of the population are between 20 and 29 years old. 241 people or 14.0% are between 30 and 39, 291 people or 16.9% are between 40 and 49, and 256 people or 14.8% are between 50 and 59. The senior population distribution is 192 people or 11.1% of the population are between 60 and 69 years old, 82 people or 4.7% are between 70 and 79, there are 25 people or 1.4% who are between 80 and 89, and there are 5 people or 0.3% who are 90 and older.[11]
As of 2000, there were 604 people who were single and never married in the municipality. There were 718 married individuals, 48 widows or widowers and 83 individuals who are divorced.[10]
As of 2000 the average number of residents per living room was 0.6 which is about equal to the cantonal average of 0.61 per room.[9] In this case, a room is defined as space of a housing unit of at least 4 m2 (43 sq ft) as normal bedrooms, dining rooms, living rooms, kitchens and habitable cellars and attics.[12] About 65.5% of the total households were owner occupied, or in other words did not pay rent (though they may have a mortgage or a rent-to-own agreement).[13]
As of 2000, there were 551 private households in the municipality, and an average of 2.6 persons per household.[9] There were 117 households that consist of only one person and 42 households with five or more people. Out of a total of 561 households that answered this question, 20.9% were households made up of just one person and there was 1 adult who lived with their parents. Of the rest of the households, there are 172 married couples without children, 220 married couples with children There were 32 single parents with a child or children. There were 9 households that were made up of unrelated people and 10 households that were made up of some sort of institution or another collective housing.[10]
In 2000 there were 316 single family homes (or 75.8% of the total) out of a total of 417 inhabited buildings. There were 61 multi-family buildings (14.6%), along with 31 multi-purpose buildings that were mostly used for housing (7.4%) and 9 other use buildings (commercial or industrial) that also had some housing (2.2%). Of the single family homes 21 were built before 1919, while 39 were built between 1990 and 2000. The greatest number of single family homes (108) were built between 1971 and 1980. The most multi-family homes (23) were built between 1971 and 1980 and the next most (12) were built before 1919. There were 2 multi-family houses built between 1996 and 2000.[14]
In 2000 there were 574 apartments in the municipality. The most common apartment size was 4 rooms of which there were 171. There were 12 single room apartments and 226 apartments with five or more rooms. Of these apartments, a total of 534 apartments (93.0% of the total) were permanently occupied, while 28 apartments (4.9%) were seasonally occupied and 12 apartments (2.1%) were empty.[14] As of 2009, the construction rate of new housing units was 2.9 new units per 1000 residents.[9] The vacancy rate for the municipality, in 2010, was 0.47%.[9]
The historical population is given in the following chart:[3][15]

Twin Town
Froideville is twinned with the town of La Pacaudière, France.[16]
Politics
In the 2007 federal election the most popular party was the SVP which received 28.52% of the vote. The next three most popular parties were the SP (18.8%), the FDP (14.25%) and the Green Party (10.84%). In the federal election, a total of 545 votes were cast, and the voter turnout was 49.5%.[17]
Economy
As of 2010, Froideville had an unemployment rate of 2.7%. As of 2008, there were 17 people employed in the primary economic sector and about 8 businesses involved in this sector. 51 people were employed in the secondary sector and there were 17 businesses in this sector. 113 people were employed in the tertiary sector, with 37 businesses in this sector.[9] There were 773 residents of the municipality who were employed in some capacity, of which females made up 41.3% of the workforce.
In 2008 the total number of full-time equivalent jobs was 131. The number of jobs in the primary sector was 14, all of which were in agriculture. The number of jobs in the secondary sector was 39 of which 20 or (51.3%) were in manufacturing and 20 (51.3%) were in construction. The number of jobs in the tertiary sector was 78. In the tertiary sector; 18 or 23.1% were in wholesale or retail sales or the repair of motor vehicles, 4 or 5.1% were in the movement and storage of goods, 6 or 7.7% were in a hotel or restaurant, 4 or 5.1% were in the information industry, 8 or 10.3% were technical professionals or scientists, 20 or 25.6% were in education and 3 or 3.8% were in health care.[18]
In 2000, there were 49 workers who commuted into the municipality and 621 workers who commuted away. The municipality is a net exporter of workers, with about 12.7 workers leaving the municipality for every one entering.[19] Of the working population, 8.9% used public transportation to get to work, and 75.8% used a private car.[9]
Religion
From the 2000 census, 373 or 25.7% were Roman Catholic, while 795 or 54.7% belonged to the Swiss Reformed Church. Of the rest of the population, there were 3 members of an Orthodox church (or about 0.21% of the population), there were 2 individuals (or about 0.14% of the population) who belonged to the Christian Catholic Church, and there were 50 individuals (or about 3.44% of the population) who belonged to another Christian church. There were 2 (or about 0.14% of the population) who were Islamic. There were 5 individuals who were Buddhist, 2 individuals who were Hindu and 2 individuals who belonged to another church. 169 (or about 11.63% of the population) belonged to no church, are agnostic or atheist, and 71 individuals (or about 4.89% of the population) did not answer the question.[10]
Education
In Froideville about 599 or (41.2%) of the population have completed non-mandatory upper secondary education, and 209 or (14.4%) have completed additional higher education (either university or a Fachhochschule). Of the 209 who completed tertiary schooling, 61.7% were Swiss men, 27.3% were Swiss women, 6.7% were non-Swiss men and 4.3% were non-Swiss women.[10]
In the 2009/2010 school year there were a total of 243 students in the Froideville school district. In the Vaud cantonal school system, two years of non-obligatory pre-school are provided by the political districts.[20] During the school year, the political district provided pre-school care for a total of 296 children of which 96 children (32.4%) received subsidized pre-school care. The canton's primary school program requires students to attend for four years. There were 130 students in the municipal primary school program. The obligatory lower secondary school program lasts for six years and there were 111 students in those schools. There were also 2 students who were home schooled or attended another non-traditional school.[21]
As of 2000, there were 140 students from Froideville who attended schools outside the municipality.[19]
References
- ↑ Arealstatistik Standard - Gemeindedaten nach 4 Hauptbereichen
- ↑ Swiss Federal Statistical Office - STAT-TAB, online database – Ständige und nichtständige Wohnbevölkerung nach institutionellen Gliederungen, Geburtsort und Staatsangehörigkeit (German) accessed 30 August 2016
- 1 2 Froideville in German, French and Italian in the online Historical Dictionary of Switzerland.
- 1 2 Swiss Federal Statistical Office-Land Use Statistics 2009 data (German) accessed 25 March 2010
- ↑ Nomenklaturen – Amtliches Gemeindeverzeichnis der Schweiz (German) accessed 4 April 2011
- ↑ Flags of the World.com accessed 27-May-2011
- ↑ Swiss Federal Statistical Office - STAT-TAB, online database – Ständige und nichtständige Wohnbevölkerung nach institutionellen Gliederungen, Geburtsort und Staatsangehörigkeit (German) accessed 30 August 2016
- 1 2 Swiss Federal Statistical Office - Superweb database - Gemeinde Statistics 1981-2008 (German) accessed 19 June 2010
- 1 2 3 4 5 6 7 Swiss Federal Statistical Office accessed 27-May-2011
- 1 2 3 4 5 6 STAT-TAB Datenwürfel für Thema 40.3 - 2000 (German) accessed 2 February 2011
- ↑ Canton of Vaud Statistical Office (French) accessed 29 April 2011
- ↑ Eurostat. "Housing (SA1)". Urban Audit Glossary (pdf). 2007. p. 18. Retrieved 12 February 2010.
- ↑ Urban Audit Glossary pg 17
- 1 2 Swiss Federal Statistical Office STAT-TAB - Datenwürfel für Thema 09.2 - Gebäude und Wohnungen (German) accessed 28 January 2011
- ↑ Swiss Federal Statistical Office STAT-TAB Bevölkerungsentwicklung nach Region, 1850-2000 (German) accessed 29 January 2011
- ↑ Conseil des Communes et Regions d'Europe (French) accessed 27 April 2011
- ↑ Swiss Federal Statistical Office, Nationalratswahlen 2007: Stärke der Parteien und Wahlbeteiligung, nach Gemeinden/Bezirk/Canton (German) accessed 28 May 2010
- ↑ Swiss Federal Statistical Office STAT-TAB Betriebszählung: Arbeitsstätten nach Gemeinde und NOGA 2008 (Abschnitte), Sektoren 1-3 (German) accessed 28 January 2011
- 1 2 Swiss Federal Statistical Office - Statweb (German) accessed 24 June 2010
- ↑ Organigramme de l'école vaudoise, année scolaire 2009-2010 (French) accessed 2 May 2011
- ↑ Canton of Vaud Statistical Office - Scol. obligatoire/filières de transition (French) accessed 2 May 2011
| Wikimedia Commons has media related to Froideville. |