Australian House of Representatives
| Australian House of Representatives | |
|---|---|
| 45th Parliament | |
 | |
| Type | |
| Type | |
| Leadership | |
| Structure | |
| Seats | 150 |
 | |
Political groups |
Government (76)
|
| Elections | |
| Full preferential voting | |
Last election | 2 July 2016 |
Next election | by 2019 |
| Meeting place | |
 | |
|
House of Representatives chamber Parliament House Canberra, ACT, Australia | |
| Website | |
| House of Representatives | |
|
| This article is part of a series on the politics and government of Australia |
|
|
|
Related topics |
The Australian House of Representatives is one of the two houses (chambers) of the Parliament of Australia. It is referred to as the lower house, with the Senate being referred to as the upper house. The term of members of the House of Representatives is a maximum of three years from the date of the first sitting of the House, but on only one occasion since Federation has the maximum term been reached. The House is almost always dissolved earlier, usually alone but sometimes in a double dissolution of both Houses. A member of the House may be referred to as a "Member of Parliament" ("MP" or "Member"), while a member of the Senate is usually referred to as a "Senator".
The House of Representatives currently consists of 150 members, elected by and representing single member districts, known as electoral divisions (commonly referred to as "electorates" or "seats"). The number of members is not fixed, but can vary with boundary changes resulting from electoral redistributions, which are required on a regular basis. The most recent overall increase in the size of the House, which came into effect at the 1984 election, increased the number of members from 125 to 148. It reduced to 147 at the 1993 election, returned to 148 at the 1996 election, and has been 150 since the 2001 election.
Each division elects one member using full-preference preferential voting. After the 1918 Swan by-election, which Labor unexpectedly won with the largest primary vote, the Nationalist government led by Billy Hughes changed the lower house voting system from first-past-the-post to full-preference preferential voting, effective from the 1919 general election. The system has remained in place, allowing the Coalition parties to safely contest the same seats. The system would continuously benefit the Coalition until the 1990 election, which was the first time Labor obtained a net benefit from preferential voting.[1]
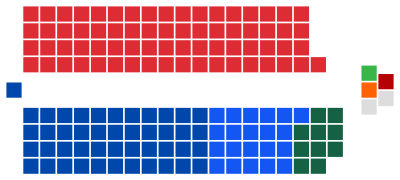
The outcome of the 2016 double dissolution election in the 150-seat House of Representatives saw the one-term incumbent Liberal/National Coalition government re-elected with a reduced 76 seats, a bare one-seat majority government − the closest federal majority result since the 1961 election. Resulting from the national two-party swing against the Turnbull government, the Shorten Labor opposition picked up a significant number of previously government-held seats − totaling 69 seats. On the crossbench the Australian Greens, the Nick Xenophon Team, Katter's Australian Party, and independents Andrew Wilkie and Cathy McGowan won a seat each.[2][3]
Origins and role
The Commonwealth of Australia Constitution Act (Imp.) of 1900 established the House of Representatives as part of the new system of dominion government in newly federated Australia. The House is presided over by the Speaker. Members of the House are elected from single member electorates (geographic districts, commonly referred to as "seats" but officially known as "Divisions of the Australian House of Representatives"). One vote one value legislation requires all electorates to have approximately the same number of voters with a maximum 10% variation. However, the baseline quota for the number of voters in an electorate is determined by the number of voters in the state in which that electorate is found. Consequently, the electorates of the smallest states and territories have more variation in the number of voters in their electorates, with larger seats like Fenner containing more than double the electors of smaller seats like Lingiari. Meanwhile, all the states except Tasmania have electorates approximately within the same 10% tolerance, with most electorates holding 85,000 to 105,000 voters. Voting is by the 'preferential system', also known as instant-runoff voting. A full allocation of preferences is required for a vote to be considered formal. This allows for a calculation of the two-party-preferred vote.
Under Section 24 of the Constitution, each state is entitled to members based on a population quota determined from the "latest statistics of the Commonwealth."[4] These statistics arise from the census conducted under the auspices of section 51(xi).[5] Until its repeal by the 1967 referendum, section 127 prohibited the inclusion of Aboriginal people in section 24 determinations as including the Indigenous peoples could alter the distribution of seats between the states to the benefit of states with larger Aboriginal populations.[6] Section 127, along with section 25 (allowing for race-based disqualification of voters by states)[4] and the race power,[7] have been described as racism built into Australia's constitutional DNA,[8] and modifications to prevent lawful race-based discrimination have been proposed.[9]
The parliamentary entitlement of a state or territory is established by the Electoral Commissioner dividing the number of the people of the Commonwealth by twice the number of Senators. The population of each state and territory is then divided by this quota to determine the number of members to which each state and territory is entitled. Under the Australian Constitution all original states are guaranteed at least five members. The Federal Parliament itself has decided that the Australian Capital Territory and the Northern Territory should have at least one member each.
According to the Constitution, the powers of both houses are nearly equal, with the consent of both houses needed to pass legislation. The difference mostly relates to taxation legislation. In practice, by convention, the person who can control a majority of votes in the lower house is invited by the Governor-General to form the Government. In practice that means that the leader of the party (or coalition of parties) with a majority of members in the House becomes the Prime Minister, who then can nominate other elected members of the government party in both the House and the Senate to become ministers responsible for various portfolios and administer government departments. Bills appropriating money (supply bills) can only be introduced in the lower house and thus only the party with a majority in the lower house can govern. In the current Australian party system, this ensures that virtually all contentious votes are along party lines, and the Government always has a majority in those votes.
The Opposition party's main role in the House is to present arguments against the Government's policies and legislation where appropriate, and attempt to hold the Government accountable as much as possible by asking questions of importance during Question Time and during debates on legislation. By contrast, the only period in recent times during which the government of the day has had a majority in the Senate was from July 2005 (following the 2004 election) to December 2007 (following the Coalition's defeat at the federal election that year). Hence, votes in the Senate are usually more meaningful. The House's well-established committee system is not always as prominent as the Senate committee system because of the frequent lack of Senate majority.
In a reflection of the United Kingdom House of Commons, the predominant colour of the furnishings in the House of Representatives is green. However, the colour was tinted slightly in the new Parliament House (opened 1988) to suggest the colour of eucalyptus trees. Also, unlike the House of Commons, the seating arrangement of the crossbench is curved, similar to the curved seating arrangement of the United States House of Representatives. This suggests a more collaborative, and less oppositional, system than in the United Kingdom parliament (where all members of parliament are seated facing the opposite side).
Australian parliaments are notoriously rowdy, with MPs often trading colourful insults. As a result, the Speaker often has to use the disciplinary powers granted to him or her under Standing Orders.[10]
Since 2015, Australian Federal Police officers armed with assault rifles have been present in both chambers of the Federal Parliament.[11]
Federation Chamber
The Federation Chamber is a second debating chamber that considers relatively uncontroversial matters referred by the House. The Federation Chamber cannot, however, initiate or make a final decision on any parliamentary business, although it can perform all tasks in between.[12]

The Federation Chamber was created in 1994 as the Main Committee, to relieve some of the burden of the House: different matters can be processed in the House at large and in the Federation Chamber, as they sit simultaneously. It is designed to be less formal, with a quorum of only three members: the Deputy Speaker of the House, one government member, and one non-government member. Decisions must be unanimous: any divided decision sends the question back to the House at large.

The Federation Chamber was created through the House's Standing Orders:[13] it is thus a subordinate body of the House, and can only be in session while the House itself is in session. When a division vote in the House occurs, members in the Federation Chamber must return to the House to vote.
The Federation Chamber is housed in one of the House's committee rooms; the room is customised for this purpose and is laid out to resemble the House chamber.[14]
Due to the unique role of what was then called the Main Committee, proposals were made to rename the body to avoid confusion with other parliamentary committees, including "Second Chamber"[15] and "Federation Chamber".[16] The House of Representatives later adopted the latter proposal.[17]
The concept of a parallel body to expedite Parliamentary business, based on the Australian Federation Chamber, was mentioned in a 1998 British House of Commons report,[18] which led to the creation of that body's parallel chamber Westminster Hall.[19]
Lower house primary, two-party and seat results since 1910
A two-party system has existed in the Australian House of Representatives since the two non-Labor parties merged in 1909. The 1910 election was the first to elect a majority government, with the Australian Labor Party concurrently winning the first Senate majority. A two-party-preferred vote (2PP) has been calculated since the 1919 change from first-past-the-post to preferential voting and subsequent introduction of the Coalition. ALP = Australian Labor Party, L+NP = grouping of Liberal/National/LNP/CLP Coalition parties (and predecessors), Oth = other parties and independents.
| Primary vote | 2PP vote | Seats | |||||||
|---|---|---|---|---|---|---|---|---|---|
| ALP | L+NP | Oth. | ALP | L+NP | ALP | L+NP | Oth. | Total | |
| 2 July 2016 election | 34.7% | 42.0% | 23.3% | 49.6% | 50.4% | 69 | 76 | 5 | 150 |
| 28 Jun – 1 Jul 2016 Newspoll | 35% | 42% | 23% | 49.5% | 50.5% | ||||
| 7 September 2013 election | 33.4% | 45.6% | 21.0% | 46.5% | 53.5% | 55 | 90 | 5 | 150 |
| 3–5 Sep 2013 Newspoll | 33% | 46% | 21% | 46% | 54% | ||||
| 21 August 2010 election | 38.0% | 43.3% | 18.7% | 50.1% | 49.9% | 72 | 72 | 6 | 150 |
| 17–19 Aug 2010 Newspoll | 36.2% | 43.4% | 20.4% | 50.2% | 49.8% | ||||
| 24 November 2007 election | 43.4% | 42.1% | 14.5% | 52.7% | 47.3% | 83 | 65 | 2 | 150 |
| 20–22 Nov 2007 Newspoll | 44% | 43% | 13% | 52% | 48% | ||||
| 9 October 2004 election | 37.6% | 46.7% | 15.7% | 47.3% | 52.7% | 60 | 87 | 3 | 150 |
| 6–7 Oct 2004 Newspoll | 39% | 45% | 16% | 50% | 50% | ||||
| 10 November 2001 election | 37.8% | 43.0% | 19.2% | 49.0% | 51.0% | 65 | 82 | 3 | 150 |
| 7–8 Nov 2001 Newspoll | 38.5% | 46% | 15.5% | 47% | 53% | ||||
| 3 October 1998 election | 40.1% | 39.5% | 20.4% | 51.0% | 49.0% | 67 | 80 | 1 | 148 |
| 30 Sep – 1 Oct 1998 Newspoll | 44% | 40% | 16% | 53% | 47% | ||||
| 2 March 1996 election | 38.7% | 47.3% | 14.0% | 46.4% | 53.6% | 49 | 94 | 5 | 148 |
| 28–29 Feb 1996 Newspoll | 40.5% | 48% | 11.5% | 46.5% | 53.5% | ||||
| 13 March 1993 election | 44.9% | 44.3% | 10.7% | 51.4% | 48.6% | 80 | 65 | 2 | 147 |
| 11 Mar 1993 Newspoll | 44% | 45% | 11% | 49.5% | 50.5% | ||||
| 24 March 1990 election | 39.4% | 43.5% | 17.1% | 49.9% | 50.1% | 78 | 69 | 1 | 148 |
| 11 July 1987 election | 45.8% | 46.1% | 8.1% | 50.8% | 49.2% | 86 | 62 | 0 | 148 |
| 1 December 1984 election | 47.6% | 45.0% | 7.4% | 51.8% | 48.2% | 82 | 66 | 0 | 148 |
| 5 March 1983 election | 49.5% | 43.6% | 6.9% | 53.2% | 46.8% | 75 | 50 | 0 | 125 |
| 18 October 1980 election | 45.2% | 46.3% | 8.5% | 49.6% | 50.4% | 51 | 74 | 0 | 125 |
| 10 December 1977 election | 39.7% | 48.1% | 12.2% | 45.4% | 54.6% | 38 | 86 | 0 | 124 |
| 13 December 1975 election | 42.8% | 53.1% | 4.1% | 44.3% | 55.7% | 36 | 91 | 0 | 127 |
| 18 May 1974 election | 49.3% | 44.9% | 5.8% | 51.7% | 48.3% | 66 | 61 | 0 | 127 |
| 2 December 1972 election | 49.6% | 41.5% | 8.9% | 52.7% | 47.3% | 67 | 58 | 0 | 125 |
| 25 October 1969 election | 47.0% | 43.3% | 9.7% | 50.2% | 49.8% | 59 | 66 | 0 | 125 |
| 26 November 1966 election | 40.0% | 50.0% | 10.0% | 43.1% | 56.9% | 41 | 82 | 1 | 124 |
| 30 November 1963 election | 45.5% | 46.0% | 8.5% | 47.4% | 52.6% | 50 | 72 | 0 | 122 |
| 9 December 1961 election | 47.9% | 42.1% | 10.0% | 50.5% | 49.5% | 60 | 62 | 0 | 122 |
| 22 November 1958 election | 42.8% | 46.6% | 10.6% | 45.9% | 54.1% | 45 | 77 | 0 | 122 |
| 10 December 1955 election | 44.6% | 47.6% | 7.8% | 45.8% | 54.2% | 47 | 75 | 0 | 122 |
| 29 May 1954 election | 50.0% | 46.8% | 3.2% | 50.7% | 49.3% | 57 | 64 | 0 | 121 |
| 28 April 1951 election | 47.6% | 50.3% | 2.1% | 49.3% | 50.7% | 52 | 69 | 0 | 121 |
| 10 December 1949 election | 46.0% | 50.3% | 3.7% | 49.0% | 51.0% | 47 | 74 | 0 | 121 |
| 28 September 1946 election | 49.7% | 39.3% | 11.0% | 54.1% | 45.9% | 43 | 26 | 5 | 74 |
| 21 August 1943 election | 49.9% | 23.0% | 27.1% | 58.2% | 41.8% | 49 | 19 | 6 | 74 |
| 21 September 1940 election | 40.2% | 43.9% | 15.9% | 50.3% | 49.7% | 32 | 36 | 6 | 74 |
| 23 October 1937 election | 43.2% | 49.3% | 7.5% | 49.4% | 50.6% | 29 | 44 | 2 | 74 |
| 15 September 1934 election | 26.8% | 45.6% | 27.6% | 46.5% | 53.5% | 18 | 42 | 14 | 74 |
| 19 December 1931 election | 27.1% | 48.4% | 24.5% | 41.5% | 58.5% | 14 | 50 | 11 | 75 |
| 12 October 1929 election | 48.8% | 44.2% | 7.0% | 56.7% | 43.3% | 46 | 24 | 5 | 75 |
| 17 November 1928 election | 44.6% | 49.6% | 5.8% | 48.4% | 51.6% | 31 | 42 | 2 | 75 |
| 14 November 1925 election | 45.0% | 53.2% | 1.8% | 46.2% | 53.8% | 23 | 50 | 2 | 75 |
| 16 December 1922 election | 42.3% | 47.8% | 9.9% | 48.8% | 51.2% | 29 | 40 | 6 | 75 |
| 13 December 1919 election | 42.5% | 54.3% | 3.2% | 45.9% | 54.1% | 25 | 38 | 2 | 75 |
| 5 May 1917 election | 43.9% | 54.2% | 1.9% | – | – | 22 | 53 | 0 | 75 |
| 5 September 1914 election | 50.9% | 47.2% | 1.9% | – | – | 42 | 32 | 1 | 75 |
| 31 May 1913 election | 48.5% | 48.9% | 2.6% | – | – | 37 | 38 | 0 | 75 |
| 13 April 1910 election | 50.0% | 45.1% | 4.9% | – | – | 42 | 31 | 2 | 75 |
| Polling conducted by Newspoll and published in The Australian. Three percent margin of error. | |||||||||
See also
- Australian House of Representatives committees
- Canberra Press Gallery
- Chronology of Australian federal parliaments
- Clerk of the Australian House of Representatives
- Father of the Australian House of Representatives
- List of Australian federal by-elections
- Members of the Australian House of Representatives
- Members of the Australian Parliament who have served for at least 30 years
- Members of the Australian Parliament who have represented more than one state or territory
- Speaker of the Australian House of Representatives
- Women in the Australian House of Representatives
- Browne–Fitzpatrick privilege case, 1955
References
- ↑ The Origin of Senate Group Ticket Voting, and it didn't come from the Major Parties: Antony Green ABC 23 September 2015
- ↑ Labor takes seat of Herbert, leaving Malcolm Turnbull with majority of just one seat: SMH 31 July 2016
- ↑ House of Reps 2016 election results: AEC
- 1 2 "Commonwealth of Australia Constitution Act 1900 (UK), page 6". Museum of Australian Democracy. Retrieved 10 November 2016.
- ↑ "Commonwealth of Australia Constitution Act 1900 (UK), page 10". Museum of Australian Democracy. Retrieved 10 November 2016.
- ↑ Korff, Jens (8 October 2014). "Australian 1967 Referendum". creativespirits.info. Retrieved 9 November 2016.
- ↑ "Commonwealth of Australia Constitution Act 1900 (UK), page 11". Museum of Australian Democracy. Retrieved 10 November 2016.
- ↑ Williams, George (2012). "Removing racism from Australia's constitutional DNA". Alternative Law Journal. 37 (3): 151–155.
- ↑ Report of the Expert Committee (2012). Recognising Aboriginal and Torres Strait Islander Peoples in the Constitution. Commonwealth of Australia. ISBN 9781921975301.
- ↑ Madigan, Michael (27 February 2009). "Barking, biting dog House". Winnipeg Free Press. Retrieved 22 August 2010.
- ↑ Armed guards now stationed to protect Australian MPs and senators in both chambers of Federal Parliament: SMH 9 February 2015
- ↑ "The Structure Of The Australian House Of Representatives Over Its First One Hundred Years: The Impact Of Globalisation," Ian Harris
- ↑ Standing and Sessional Orders Archived 3 September 2006 at the Wayback Machine., House of Representatives
- ↑ Main Committee Fact Sheet Archived 31 August 2007 at the Wayback Machine., Parliamentary Education Office
- ↑ The Second Chamber: Enhancing the Main Committee, House of Representatives
- ↑ Renaming the Main Committee, House of Representatives
- ↑ [House of Representatives Vote and Proceedings], 8 February 2012, Item 8.
- ↑ "Select Committee on Modernisation of the House of Commons First Report". House of Commons of the United Kingdom. 7 December 1998. Retrieved 20 June 2007.
- ↑ House of Commons Standard Note—Modernization: Westminster Hall, SN/PC/3939. Updated 6 March 2006. Retrieved 27 February 2012.
External links
| Library resources about Australian House of Representatives |
- House of Representatives Committees – Parliament of Australia
- Australian Parliament – live broadcasting
| Components |
| | |||||
|---|---|---|---|---|---|---|---|
| Parliamentary officers |
| ||||||
| Members |
| ||||||
| Procedure | |||||||
| Elections |
| ||||||
| Locations | |||||||
| Commonwealth | | |
|---|---|---|
| Federal elections | ||
| State/Territory governments | ||
| State/Territory elections | ||
| Local government | ||
| Political parties | ||