Demographics of Sri Lanka
| Demographics of Sri Lanka | |
|---|---|
|
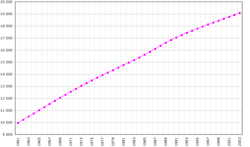
Population of Sri Lanka, 1961-2003 (FAO, 2005) | |
| Population | 20,359,439 (2012 census) |
| Density | 325/km2 (2012 census) |
| Growth rate | 0.913% (2012 est.) |
| Birth rate | 17.04 births/1,000 population (2012 est.) |
| Death rate | 5.96 deaths/1,000 population (July 2012 est.) |
| Life expectancy | 75.94 years (2012 est.) |
| • male | 72.43 years (2012 est.) |
| • female | 79.59 years (2012 est.) |
| Fertility rate | 2.17 children born/woman (2012 est.) |
| Infant mortality rate | 9.47 deaths/1,000 live births (2012 est.) |
| Age structure | |
| 0–14 years | 25.2% (2012 census) |
| 15–64 years | 66.9% (2012 census) |
| 65 and over | 7.9% (2012 census) |
| Sex ratio | |
| Total | 0.96 male(s)/female (2011 est.) |
| At birth | 1.04 male(s)/female (2011 est.) |
| Under 15 | 1.04 male(s)/female (2011 est.) |
| 15–64 years | 0.96 male(s)/female (2011 est.) |
| 65 and over | 0.75 male(s)/female (2011 est.) |
| Nationality | |
| Nationality |
noun: Sri Lankan(s) adjective: Sri Lankan |
| Major ethnic | Sinhalese (74.9%) (2012 census) |
| Minor ethnic |
|
| Language | |
| Official | Sinhalese, Tamil |
| Spoken | English |
This article is about the demographic features of the population of Sri Lanka, including population density, ethnicity, education level, health of the populace, economic status, religious affiliations and other aspects of the population.
Sri Lanka is an island in the Indian Ocean also called Ceylon and many other names. It is about the size of Ireland. It is about 28 kilometres (18 mi.) off the south-eastern coast of India with a population of about 20 million. Density is highest in the south west where Colombo, the country's main port and industrial center, is located. The net population growth is about 0.7%. Sri Lanka is ethnically, linguistically, and religiously diverse.
Overview
| Population of Sri Lanka | ||
|---|---|---|
| Year | Pop. | ±% |
| 1789[lower-alpha 1] | 1,200,000 | — |
| 1827[lower-alpha 2] | 889,584 | −25.9% |
| 1871 | 2,400,380 | +169.8% |
| 1881 | 2,759,738 | +15.0% |
| 1891 | 3,007,789 | +9.0% |
| 1901 | 3,565,954 | +18.6% |
| 1911 | 4,106,350 | +15.2% |
| 1921 | 4,498,605 | +9.6% |
| 1931 | 5,306,871 | +18.0% |
| 1946 | 6,657,339 | +25.4% |
| 1953 | 8,097,895 | +21.6% |
| 1963 | 10,582,064 | +30.7% |
| 1971 | 12,689,897 | +19.9% |
| 1981 | 14,846,750 | +17.0% |
| 2012 | 20,359,439 | +37.1% |
| Source: [1][2][3][4][5] | ||
According to the 2012 census the population of Sri Lanka was 20,359,439, giving a population density of 325/km2.[5] The population had grown by 5,512,689 (37.1%) since the 1981 census (the last full census), equivalent to an annual growth rate of 1.1%.[5] 3,704,470 (18.2%) lived in urban sectors - areas governed by municipal and urban councils.[6]
5,131,666 (25.2%) of the population were aged 14 or under whilst 2,525,573 (12.4%) were aged 60 or over, leaving a working age (15-59) population of 12,702,700.[7] The dependency ratio was 60.2%.[5] The mean age was 32 years and the median age was 31 years.[5] The sex ratio was 94 males per 100 females.[5] The fertility rate for married females aged 15 or over was 2.65 live births.[8] There were 5,264,282 households of which 3,986,236 (75.7%) were headed by males and 1,278,046 (24.3%) were headed by females.[5]
Of the 15,227,773 aged 15 or over, 10,322,105 (67.8%) were married, 3,927,602 (25.8%) were never married, 792,947 (5.2%) were widowed and 185,119 (1.2%) were divorced or separated.[9]
Of those aged 15 or over, 7,857,370 (51.6%) were economically active, 4,199,558 (27.6%) did housework, 1,431,105 (9.4%) were students, 914,934 (6.0%) were unable to work and 346,084 (2.3%) were pensioners.[10] 521,938 (6.6%) of the economically active were unemployed.[5] 604,540 Sri Lankans were living aboard for more than six months but were intending to return to Sri Lanka, mostly in the Gulf states (373,050 61.7%).[11]
The overall literacy rate for those aged 10 and over was 95.7% but amongst those living in the estate sector it was only 86.1%.[12] Of the 18,615,577 aged 5 or over, 499,563 (2.7%) had received a higher education qualification, 2,293,841 (12.3%) had passed G.C.E. A/L, 3,159,402 (17.0%) had passed G.C.E. O/L and 700,419 (3.8%) had no formal schooling.[13] The remaining 11,962,352 (64.3%) had left school with no qualifications or were currently at school.[13]
Ethnicity
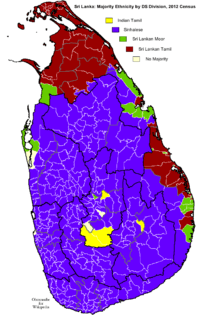
The Sinhalese make up 74.9% of the population (according to 2012 census) and are concentrated in the densely populated south-west and central parts of the island.[14] The Sri Lanka Tamils, who live predominantly in the north and east of the island, form the largest minority group at 11.1% (according to the 2012 census) of the population.[14]
The Moors, descendants of Arab traders that settled in Sri Lanka and married local women, form the third largest ethnic group at 9.3% of the population.[14] They are mostly concentrated in urban areas in the southern parts of the island with substantial populations in the Central and Eastern provinces. During times of Portuguese colonization, Moors were persecuted, and many forced to retreat to the central highlands and the eastern coast.
There are also Indian Tamils who form a distinct ethnic group comprising 4.1% of the population.[14] The British brought them to Sri Lanka in the 19th century as tea and rubber plantation workers, and they remain concentrated in the "tea country" of south-central Sri Lanka. The Indian Tamils of Sri Lanka were considered to be "stateless" and over 300 000 Indian Tamils were deported back to India, due to the agreement between Sri Lanka and India in 1964.[15] Under the pact, India granted citizenship to the remainder, some 200,000 of whom now live in India. Another 75,000 Indian Tamils, who themselves or whose parents once applied for Indian citizenship, now wish to remain in Sri Lanka. The government has stated these Tamils will not be forced to return to India, although they are not technically citizens of Sri Lanka. By the 1990s most Indian Tamils had received Sri Lankan citizenship, and some even were not granted Sri Lankan citizenship until 2003.[15][16]
Smaller minorities include the Malays who descent from South East Asian settlers, and the Burghers, who are descendants of European colonists, principally from Portugal, the Netherlands and the UK.
| Year | Sinhalese | Sri Lankan Tamils[lower-alpha 3] | Sri Lankan Moors[lower-alpha 4] | Indian Tamils[lower-alpha 3] | Sri Lankan Malays | Burghers/ Eurasian |
Indian Moors[lower-alpha 4] | Others | Total No. | ||||||||
|---|---|---|---|---|---|---|---|---|---|---|---|---|---|---|---|---|---|
| No. | % | No. | % | No. | % | No. | % | No. | % | No. | % | No. | % | No. | % | ||
| 1881 Census | 1,846,600 | 66.91% | 687,200 | 24.90% | 184,500 | 6.69% | 8,900 | 0.32% | 17,900 | 0.65% | 14,500 | 0.53% | 2,759,700 | ||||
| 1891 Census | 2,041,200 | 67.86% | 723,900 | 24.07% | 197,200 | 6.56% | 10,100 | 0.34% | 21,200 | 0.70% | 14,200 | 0.47% | 3,007,800 | ||||
| 1901 Census | 2,330,800 | 65.36% | 951,700 | 26.69% | 228,000 | 6.39% | 11,900 | 0.33% | 23,500 | 0.66% | 20,000 | 0.56% | 3,566,000 | ||||
| 1911 Census | 2,715,500 | 66.13% | 528,000 | 12.86% | 233,900 | 5.70% | 531,000 | 12.93% | 13,000 | 0.32% | 26,700 | 0.65% | 32,700 | 0.80% | 25,600 | 0.62% | 4,106,400 |
| 1921 Census | 3,016,200 | 67.05% | 517,300 | 11.50% | 251,900 | 5.60% | 602,700 | 13.40% | 13,400 | 0.30% | 29,400 | 0.65% | 33,000 | 0.73% | 34,600 | 0.77% | 4,498,600 |
| 1931 Estimate | 3,473,000 | 65.45% | 598,900 | 11.29% | 289,600 | 5.46% | 818,500 | 15.43% | 16,000 | 0.30% | 32,300 | 0.61% | 36,300 | 0.68% | 41,800 | 0.79% | 5,306,000 |
| 1946 Census[lower-alpha 5] | 4,620,500 | 69.41% | 733,700 | 11.02% | 373,600 | 5.61% | 780,600 | 11.73% | 22,500 | 0.34% | 41,900 | 0.63% | 35,600 | 0.53% | 48,900 | 0.73% | 6,657,300 |
| 1953 Census[lower-alpha 6] | 5,616,700 | 69.36% | 884,700 | 10.93% | 464,000 | 5.73% | 974,100 | 12.03% | 25,400 | 0.31% | 46,000 | 0.57% | 47,500 | 0.59% | 39,500 | 0.49% | 8,097,900 |
| 1963 Census | 7,512,900 | 71.00% | 1,164,700 | 11.01% | 626,800 | 5.92% | 1,123,000 | 10.61% | 33,400 | 0.32% | 45,900 | 0.43% | 55,400 | 0.52% | 19,900 | 0.19% | 10,582,000 |
| 1971 Census | 9,131,241 | 71.96% | 1,423,981 | 11.22% | 855,724 | 6.74% | 1,174,606 | 9.26% | 43,459 | 0.34% | 45,376 | 0.36% | 15,510 | 0.12% | 12,689,897 | ||
| 1981 Census | 10,979,561 | 73.95% | 1,886,872 | 12.71% | 1,046,926 | 7.05% | 818,656 | 5.51% | 46,963 | 0.32% | 39,374 | 0.27% | 28,398 | 0.19% | 14,846,750 | ||
| 2001 Census[lower-alpha 7] | |||||||||||||||||
| 2011 Census[lower-alpha 8] | 15,250,081 | 74.90% | 2,269,266 | 11.15% | 1,892,638 | 9.30% | 839,504 | 4.12% | 44,130 | 0.22% | 38,293 | 0.19% | 25,527 | 0.13% | 20,359,439 | ||
Religion
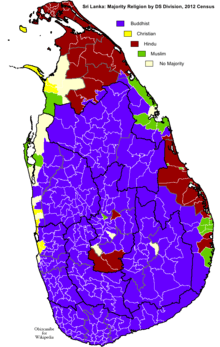

According to the 2012 census Buddhists make up 70.1% of the population, Hindus 12.6%, Muslims 9.7% and Christians 7.6%.[20] Most Sinhalese are Buddhist; most Tamils are Hindu; and the Moors and Malays are mostly Muslim. Sizeable minorities of both Sinhalese and Tamils are Christians, most of whom are Roman Catholic. The Burgher population is mostly Roman Catholic or Presbyterian. The Veddahs have Animist and Buddhist practices. The 1978 constitution, while assuring freedom of religion, gives "the foremost place" Buddhism.[21][22]
| Year | Buddhist | Hindu | Muslim | Christian | Others | Total | ||||||
|---|---|---|---|---|---|---|---|---|---|---|---|---|
| No. | % | No. | % | No. | % | No. | % | No. | % | No. | ||
| 1881 Census | 1,698,100 | 61.53% | 593,600 | 21.51% | 197,800 | 7.17% | 268,000 | 9.71% | 2,300 | 0.08% | 2,759,800 | |
| 1891 Census | 1,877,000 | 62.40% | 615,900 | 20.48% | 212,000 | 7.05% | 302,100 | 10.04% | 800 | 0.03% | 3,007,800 | |
| 1901 Census | 2,141,400 | 60.06% | 826,800 | 23.19% | 246,100 | 6.90% | 349,200 | 9.79% | 2,500 | 0.07% | 3,566,000 | |
| 1911 Census | 2,474,200 | 60.25% | 938,300 | 22.85% | 283,600 | 6.91% | 409,200 | 9.96% | 1,100 | 0.03% | 4,106,400 | |
| 1921 Census | 2,769,800 | 61.57% | 982,100 | 21.83% | 302,500 | 6.72% | 443,400 | 9.86% | 800 | 0.02% | 4,498,600 | |
| 1931 Estimate | 3,266,600 | 61.55% | 1,166,900 | 21.99% | 354,200 | 6.67% | 518,100 | 9.76% | 1,100 | 0.02% | 5,306,900 | |
| 1946 Census | 4,294,900 | 64.51% | 1,320,400 | 19.83% | 436,600 | 6.56% | 603,200 | 9.06% | 2,200 | 0.03% | 6,657,300 | |
| 1953 Census | 5,209,400 | 64.33% | 1,610,500 | 19.89% | 541,500 | 6.69% | 724,400 | 8.95% | 12,100 | 0.15% | 8,097,900 | |
| 1963 Census | 7,003,300 | 66.18% | 1,958,400 | 18.51% | 724,000 | 6.84% | 884,900 | 8.36% | 11,400 | 0.11% | 10,582,000 | |
| 1971 Census | 8,536,868 | 67.27% | 2,238,666 | 17.64% | 901,785 | 7.11% | 1,004,326 | 7.91% | 8,252 | 0.07% | 12,689,897 | |
| 1981 Census | 10,288,325 | 69.30% | 2,297,806 | 15.48% | 1,121,717 | 7.56% | 1,130,568 | 7.61% | 8,334 | 0.06% | 14,846,750 | |
| 2001 Census[lower-alpha 7] | ||||||||||||
| 2012 Census[lower-alpha 8] | 14,272,056 | 70.10% | 2,561,299 | 12.58% | 1,967,523 | 9.66% | 1,552,161 | 7.62% | 6,400 | 0.03% | 20,359,439 | |
Languages
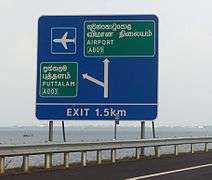
Sinhala, an Indo-European language, is the first language of the Sinhalese. Tamil, a Dravidian language, is the first language of the Tamils. Tamil is also the first language the majority of Moors and the Indian Tamils - according to the 2012 census 98% of Moors could speak Tamil but only 59% could speak Sinhala.[25]
Malays speak Sri Lanka Malay, a Creole language mixing Sinhala, Tamil and Malay. Many of the Burghers speak Sri Lankan Indo-Portuguese although its use has declined and the majority now speak Sinhala.[25] The Veddahs speak Vedda, a Creole language closely based on Sinhala. Use of English has declined since independence, but it continues to be spoken by many in the middle and upper middle classes, particularly in Colombo. According to the 2012 census 24% of the population could speak English.[25] The government is seeking to reverse the decline in the use of English, mainly for economic but also for political reasons. According to the constitution Sinhala and Tamil are official languages whilst English is the link language.[26]
Vital statistics
UN estimates:[27]
| Period | Live births per year | Deaths per year | Natural change per year | CBR1 | CDR1 | NC1 | TFR1 | IMR1 |
|---|---|---|---|---|---|---|---|---|
| 1950–1955 | 322 000 | 171 000 | 151 000 | 37.4 | 19.8 | 17.5 | 5.80 | 103.9 |
| 1955–1960 | 367 000 | 143 000 | 223 000 | 38.6 | 15.1 | 23.5 | 5.80 | 86.7 |
| 1960–1965 | 377 000 | 128 000 | 248 000 | 35.5 | 12.1 | 23.4 | 5.20 | 77.5 |
| 1965–1970 | 391 000 | 116 000 | 276 000 | 32.9 | 9.7 | 23.2 | 4.70 | 69.3 |
| 1970–1975 | 383 000 | 103 000 | 280 000 | 29.1 | 7.8 | 21.3 | 4.00 | 55.4 |
| 1975–1980 | 401 000 | 99 000 | 302 000 | 27.8 | 6.9 | 20.9 | 3.61 | 38.8 |
| 1980–1985 | 401 000 | 96 000 | 305 000 | 25.6 | 6.1 | 19.5 | 3.19 | 30.3 |
| 1985–1990 | 362 000 | 110 000 | 253 000 | 21.6 | 6.5 | 15.1 | 2.64 | 24.1 |
| 1990–1995 | 349 000 | 119 000 | 230 000 | 19.6 | 6.7 | 12.9 | 2.39 | 22.1 |
| 1995–2000 | 329 000 | 146 000 | 183 000 | 17.8 | 7.9 | 9.9 | 2.16 | 18.9 |
| 2000–2005 | 360 000 | 121 000 | 239 000 | 18.7 | 6.3 | 12.4 | 2.27 | 15.9 |
| 2005–2010 | 386 000 | 132 000 | 253 000 | 19.0 | 6.5 | 12.5 | 2.36 | 12.4 |
| 1 CBR = crude birth rate (per 1000); CDR = crude death rate (per 1000); NC = natural change (per 1000); TFR = total fertility rate (number of children per woman); IMR = infant mortality rate per 1000 births | ||||||||
Fertility and Births
Total Fertility Rate (TFR) (Wanted Fertility Rate) and Crude Birth Rate (CBR):[28]
| Year | CBR (Total) | TFR (Total) | CBR (Urban) | TFR (Urban) | CBR (Rural) | TFR (Rural) | CBR (Estate) | TFR (Estate) |
|---|---|---|---|---|---|---|---|---|
| 1981-1983 | 3,1 | 2,4 | 3,2 | 3,4 | ||||
| 1987 | 2,8 (2,4) | 2,3 (1,9) | 2,9 (2,4) | 3,4 (3,2) | ||||
| 2006-2007 | 18,7 | 2,3 (2,1) | 18,5 | 2,2 (2,0) | 18,6 | 2,3 (2,1) | 20,0 | 2,5 (2,1) |
Births and deaths [29]
| Year | Population | Live births | Deaths | Natural increase | Crude birth rate | Crude death rate | Rate of natural increase | TFR |
|---|---|---|---|---|---|---|---|---|
| 2009 | 368 304 | 127 776 | 240 528 | 18.0 | 6.2 | 11.8 | ||
| 2010 | 364 565 | 128 603 | 235 962 | 17.7 | 6.2 | 11.4 | ||
| 2011 | 363 415 | 123 261 | 240 154 | 17.4 | 5.9 | 11.5 | ||
| 2012 | 20 277 597 | 355 900 | 122 063 | 233 837 | 17.5 | 6.0 | 11.5 | |
| 2013 | 365 792 | 127 124 | 238 668 | 17.9 | 6.2 | 11.7 | ||
| 2015 | 334 821 | 131 634 | 200 187 | 16.0 | 6.3 | 9.7 | ||
Population pyramid[30]
Provisional Estimates (01/07/2013) :
| Age group | Male | Female | Total | % |
|---|---|---|---|---|
| Total | 9 940 000 | 10 544 000 | 20 483 000 | 100 |
| 0-4 | 891 000 | 871 000 | 1 762 000 | 8.60 |
| 5-9 | 895 000 | 869 000 | 1 764 000 | 8.61 |
| 10-14 | 835 000 | 810 000 | 1 645 000 | 8.03 |
| 15-19 | 819 000 | 839 000 | 1 658 000 | 8.09 |
| 20-24 | 754 000 | 777 000 | 1 530 000 | 7.47 |
| 25-29 | 751 000 | 806 000 | 1 557 000 | 7.60 |
| 30-34 | 799 000 | 849 000 | 1 649 000 | 8.05 |
| 35-39 | 688 000 | 732 000 | 1 421 000 | 6.94 |
| 40-44 | 673 000 | 711 000 | 1 384 000 | 6.76 |
| 45-49 | 625 000 | 666 000 | 1 291 000 | 6.30 |
| 50-54 | 585 000 | 643 000 | 1 228 000 | 6.00 |
| 55-59 | 505 000 | 561 000 | 1 066 000 | 5.20 |
| 60-64 | 428 000 | 495 000 | 924 000 | 4.51 |
| 65-69 | 287 000 | 348 000 | 635 000 | 3.10 |
| 70-74 | 182 000 | 231 000 | 413 000 | 2.02 |
| 75-79 | 116 000 | 170 000 | 286 000 | 1.40 |
| 80+ | 107 000 | 164 000 | 270 000 | 1.32 |
| Age group | Male | Female | Total | Percent |
|---|---|---|---|---|
| 0-14 | 2 621 000 | 2 550 000 | 5 171 000 | 25.25 |
| 15-64 | 6 627 000 | 7 081 000 | 13 708 000 | 66.92 |
| 65+ | 692 000 | 913 000 | 1 605 000 | 7.84 |
CIA World Factbook demographic statistics
Ethnicity in Sri Lanka (2012)[19]
The following demographic statistics are from the CIA World Factbook, unless otherwise indicated:[31]
- Population - 21,481,334 (July 2012 est.)[lower-alpha 9]
- Age structure - 0–14 years: 23.9% (male 2,594,815/female 2,493,002); 15–64 years: 68% (male 7,089,307/female 7,418,123); 65 years and over:8.1% (male 803,172/female 926,372) (2010 est.)
- Median age - total: 31.1 years; male: 30.1 years; female: 32.2 years (2012 est.)
- Population growth rate - 0.913% (2012 est.)
- Birth rate - 17.04 births/1,000 population (2012 est.)
- Death rate - 5.96 deaths/1,000 population (July 2012 est.)
- Net migration rate - -1.95 migrant(s)/1,000 population (2012 est.)
- Urbanization - urban population: 14% of total population (2010); rate of urbanization: 1.1% annual rate of change (2010-15 est.)
- Sex ratio - at birth: 1.04 male(s)/female; under 15 years: 1.04 male(s)/female; 15–64 years: 0.96 male(s)/female; 65 years and over: 0.75 male(s)/female; total population: 0.96 male(s)/female (2011 est.)
- Infant mortality rate - total: 9.47 deaths/1,000 live births; male: 10.44 deaths/1,000 live births; female: 8.45 deaths/1,000 live births
- Life expectancy at birth - total population: 75.94 years; male: 72.43 years; female: 79.59 years (2012 est.)
- Total fertility rate - 2.17 children born/woman (2012 est.)
- Health expenditures - 4% of GDP (2009)
- Physicians density - 0.492 physicians/1,000 population (2006)
- Hospital bed density - 3.1 beds/1,000 population (2004)
- HIV/AIDS - adult prevalence rate - less than 0.1% (2009 est.)
- HIV/AIDS - people living with HIV/AIDS - 2,800 (2009 est.)
- HIV/AIDS - deaths - fewer than 200 (2009 est.)
- Major infectious diseases - degree of risk: high; food or waterborne diseases: bacterial diarrhea and hepatitis A; vectorborne disease: dengue fever and chikungunya; water contact disease:leptospirosis; animal contact disease: rabies(2009)
- Nationality - noun: Sri Lankan(s);
adjective: Sri Lankan - Ethnic group - Sinhalese 73.8%; Sri Lankan Moors 7.2%; Indian Tamil 4.6%; Sri Lankan Tamil 3.9%; other 0.5%; unspecified 10% (2001 census provisional data)[lower-alpha 10]
- Religion - Buddhism 70.19%; Hinduism 12.61%; Islam 9.71%; Christianity 7.45%; Other 0.05% (2012 [32] provisional data)
- Languages - Sinhala 74%; Tamil 25%; other 1%[lower-alpha 11]
- Literacy - definition: age 15 and over can read and write; total population: 91.2%; male: 92.6%; female:90% (2010 census)
Notes
- ↑ Estimate.
- ↑ Non scientific census of the whole island.
- 1 2 Indian Tamils were only classified as a separate ethnic group from 1911 onwards. Prior to this they were included with Sri Lankan Tamils.
- 1 2 Indian Moors were only classified as a separate ethnic group from 1911 to 1971. Prior to 1911 they were included with Sri Lankan Moors. After 1971 they were included with Others.
- ↑ The 1941 Census was postponed due to World War II.
- ↑ The 1951 Census was postponed due to a shortage of paper at the time.
- 1 2 2001 Census was only carried out in 18 of the 25 districts. Inclusion of data would be misleading.
- 1 2 The official census dates for the 2011 Census was 20 March 2012.
- ↑ Since the outbreak of hostilities between the government and armed Tamil separatists in the mid-1980s, several hundred thousand Tamil civilians have fled the island and more than 200,000 Tamils have sought refuge in the West (July 2010 est.) Aside from such migrants, there is an estimated 1.7 million Sri Lankans who are employed abroad (2010 est.), through which Sri Lanka earned USD 4.1 billion in annual worker remittances in 2010. Such remittances are a key source of foreign exchange for Sri Lanka.
- ↑ These figures are based on the 2001 census which was only carried out partially in the Northern and Eastern provinces, where the majority of Sri Lankan Tamils and Hindus live. Therefore the Sri Lankan Tamil and Hindu percentage is grossly understated. The Sri Lankan government estimates that the Tamils (Sri Lankan and Indian) account for 18% of the population.
- ↑ English is commonly used in government and is spoken competently by about 10% of the population as second language.
References
- ↑ The Population of Sri Lanka (PDF). Population Growth: C.I.C.R.E.D. Series. 1974. pp. 3–4. Retrieved 2 August 2014.
- ↑ Census of Population Sri Lanka 1971 - General Report. Department of Census & Statistics, Sri Lanka. 1977. p. 18.
- ↑ "Table 2.1: Population by sex and district, census years" (PDF). Statistical Abstract 2013. Department of Census & Statistics, Sri Lanka.
- ↑ "Population by age group and sex". LankaSIS Sri Lanka Statistical Information Service. Department of Census & Statistics, Sri Lanka.
- 1 2 3 4 5 6 7 8 "Census of Population and Housing of Sri Lanka, 2012" (PDF). Department of Census & Statistics, Sri Lanka.
- ↑ "Census of Population and Housing of Sri Lanka, 2012 - Table A1: Population by district,sex and sector" (PDF). Department of Census & Statistics, Sri Lanka.
- ↑ "Census of Population and Housing of Sri Lanka, 2012 - Table A2: Population by district, age and sex" (PDF). Department of Census & Statistics, Sri Lanka.
- ↑ "Census of Population and Housing of Sri Lanka, 2012 - Table A44: Ever married female population aged 15 years and over by number of children born alive,average children per woman,age and sector" (PDF). Department of Census & Statistics, Sri Lanka.
- ↑ "Census of Population and Housing of Sri Lanka, 2012 - Table A10: Population by marital status, age, sex and sector" (PDF). Department of Census & Statistics, Sri Lanka.
- ↑ "Census of Population and Housing of Sri Lanka, 2012 - Table A37 Population aged 15 years and over by economic activity status,age,sex and sector" (PDF). Department of Census & Statistics, Sri Lanka.
- ↑ "Census of Population and Housing of Sri Lanka, 2012 - Table A47: Population living abroad temporary by country of usual residence, age and sex" (PDF). Department of Census & Statistics, Sri Lanka.
- ↑ "Census of Population and Housing of Sri Lanka, 2012 - Table A31: Population aged 10 years and over by literacy rate, age, sex and sector" (PDF). Department of Census & Statistics, Sri Lanka.
- 1 2 "Census of Population and Housing of Sri Lanka, 2012 - Table A30: Population aged 5 years and over, by educational attainment, age, sex and sector" (PDF). Department of Census & Statistics, Sri Lanka.
- 1 2 3 4 5 "Census of Population and Housing of Sri Lanka, 2012 - Table A3: Population by district, ethnic group and sex" (PDF). Department of Census & Statistics, Sri Lanka.
- 1 2 Kingsbury, Damien; Kingsbury, Senior Lecturer in International Development Damien (2012-03-12). Sri Lanka and the Responsibility to Protect: Politics, Ethnicity and Genocide. Routledge. ISBN 9781136639975.
- ↑ De Silva, C.R. A History. p. 262.
- ↑ "Table 2.10: Population by ethnic group and census years" (PDF). Statistical Abstract 2013. Department of Census & Statistics, Sri Lanka.
- ↑ "Population by ethnic group". LankaSIS Sri Lanka Statistical Information Service. Department of Census & Statistics, Sri Lanka.
- 1 2 3 "South Asia ::SRI LANKA". CIA The World Factbook.
- 1 2 "Census of Population and Housing of Sri Lanka, 2012 - Table A4: Population by district, religion and sex" (PDF). Department of Census & Statistics, Sri Lanka.
- ↑ "Chapter III - Fundamental Rights". Constitution of Sri Lanka. Policy Research & Information Unit, Presidential Secretariat, Sri Lanka.
- ↑ "Chapter II - Buddhism". Constitution of Sri Lanka. Policy Research & Information Unit, Presidential Secretariat, Sri Lanka.
- ↑ "Table 2.13: Population by religion and census years" (PDF). Statistical Abstract 2013. Department of Census & Statistics, Sri Lanka.
- ↑ "Population by religion". LankaSIS Sri Lanka Statistical Information Service. Department of Census & Statistics, Sri Lanka.
- 1 2 3 "Census of Population and Housing of Sri Lanka, 2012 - Table A32 :Population aged 10 years and over, by ability to speak, ability to read and write main languages, ethnic group, sex and sector" (PDF). Department of Census & Statistics, Sri Lanka.
- ↑ "Chapter IV - Language". Constitution of Sri Lanka. Policy Research & Information Unit, Presidential Secretariat, Sri Lanka.
- ↑ World Population Prospects: The 2010 Revision
- ↑ http://microdata.worldbank.org/index.php/catalog/dhs#_r=&collection=&country=&dtype=&from=1890&page=14&ps=&sk=&sort_by=nation&sort_order=&to=2014&topic=&view=s&vk=
- ↑ http://unstats.un.org/unsd/demographic/products/dyb/dyb2.htm
- ↑ "Demographic Yearbook". UN Data. United Nations. Retrieved 4 December 2015.
- ↑ "Sri Lanka". The World Factbook. Central Intelligence Agency.
- ↑ ": Population by religion according to districts" (PDF). Department of Census and Statistics, Sri Lanka. Retrieved 22 June 2014.
External links
| Indigenous | ||
|---|---|---|
| See also |
| |