Demographics of Nepal
Nepalese also referred to as Nepalis or Nepali people (Nepali: नेपाली गण) are the Indo-Aryan and Sino-Tibetan citizens of Nepal under the provisions of Nepali nationality law. The country is home to people of many different national origins. As a result, people of Nepal do not equate their nationality with ethnicity, but with citizenship and allegiance. Although citizens make up the majority of Nepalese, non-citizen residents, dual citizen, and expatriates may also claim a Nepalese identity. Nepalese are descendants of migrants from parts of India, Kashmir, Tibet, and parts of Burma and Yunnan, and much further traces origin to Central Asia, along with indigenous peoples. Nepal is a multicultural and multiethnic country. Kathmandu Valley, in the middle hill region, constitutes a small fraction of the nation's area but is the most densely populated, with almost 5 percent of the nation's population.[1]
Demographic history
The population of Nepal is estimated to be 26,494,504 people based on the 2011 Nepal census,[2] with a population growth rate of 1.35% and a median age of 21.6 years. Female median age is estimated to be 22.5 years, and male median age to be 20.7 years. Only 4.4% of the population is estimated to be more than 65 years old, comprising 681,252 females and 597,628 males. 61% of the population is between 15 and 64 years old, and 34.6% is younger than 14 years. Birth rate is estimated to be 22.17 births/1,000 population with an infant mortality rate of 44.54 deaths per 1000 live births. Life expectancy at birth is estimated to be 67.44 years for females and 64.94 years for males. The mortality rate is estimated to be 681 deaths per 100,000 people. Net migration rate is estimated to be 61 migrants per 100,000 people. According to the 2011 census, 65.9% of the total population is literate.[1]
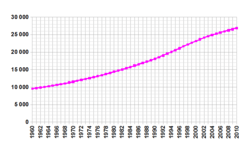
Population growth
The population of Nepal has been steadily rising recent decades. The current population is roughly 28 million which contributes to an increase of about 3 million people every 5 years.
Vital statistics
UN estimates
| Period | Live births per year | Deaths per year | Natural change per year | CBR1 | CDR1 | NC1 | TFR1 | IMR1 |
|---|---|---|---|---|---|---|---|---|
| 1975–1980 | 597 000 | 254 000 | 343 000 | 42.0 | 17.9 | 24.1 | 5.92 | 139.2 |
| 1980–1985 | 651 000 | 253 000 | 398 000 | 40.7 | 15.8 | 24.9 | 5.72 | 122.9 |
| 1985–1990 | 707 000 | 249 000 | 458 000 | 39.3 | 13.8 | 25.5 | 5.39 | 106.8 |
| 1990–1995 | 767 000 | 244 000 | 523 000 | 37.7 | 12.0 | 25.7 | 4.96 | 91.5 |
| 1995–2000 | 805 000 | 224 000 | 581 000 | 35.0 | 9.7 | 25.3 | 4.41 | 72.3 |
| 2000–2005 | 797 000 | 201 000 | 596 000 | 30.9 | 7.8 | 23.1 | 3.74 | 54.9 |
| 2005–2010 | 732 000 | 177 000 | 555 000 | 25.6 | 6.2 | 19.4 | 2.95 | 38.7 |
| 1 CBR = crude birth rate (per 1000); CDR = crude death rate (per 1000); NC = natural change (per 1000); TFR = total fertility rate (number of children per woman); IMR = infant mortality rate per 1000 births | ||||||||
Source:[3]
Births and deaths [4]
| Year | Population (x1000) | Live births | Deaths | Natural increase | Crude birth rate | Crude death rate | Rate of natural increase | TFR |
|---|---|---|---|---|---|---|---|---|
| 2011 | 326 725 | 129 978 | 196 747 | 11.4 | 4.5 | 6.9 | ||
Structure of the population [5]
Structure of the population (22.06.2011) (Census) :
| Age Group | Male | Female | Total | % |
|---|---|---|---|---|
| Total | 12 849 041 | 13 645 463 | 26 494 504 | 100 |
| 0-4 | 1 314 957 | 1 253 006 | 2 567 963 | 9,69 |
| 5-9 | 1 635 176 | 1 569 683 | 3 204 859 | 12,10 |
| 10-14 | 1 764 630 | 1 710 794 | 3 475 424 | 13,12 |
| 15-19 | 1 443 191 | 1 488 789 | 2 931 980 | 11,07 |
| 20-24 | 1 043 981 | 1 314 090 | 2 358 071 | 8,90 |
| 25-29 | 917 243 | 1 162 111 | 2 079 354 | 7,85 |
| 30-34 | 770 577 | 964 728 | 1 735 305 | 6,55 |
| 35-39 | 740 200 | 864 119 | 1 604 319 | 6,06 |
| 40-44 | 660 290 | 725 831 | 1 386 121 | 5,23 |
| 45-49 | 575 101 | 597 858 | 1 172 959 | 4,43 |
| 50-54 | 505 864 | 499 612 | 1 005 476 | 3,80 |
| 55-59 | 412 892 | 405 371 | 818 263 | 3,09 |
| 60-64 | 368 451 | 388 376 | 756 827 | 2,86 |
| 65-69 | 277 782 | 276 667 | 554 449 | 2,09 |
| 70-74 | 199 610 | 195 543 | 395 153 | 1,49 |
| 75-79 | 117 358 | 117 777 | 235 135 | 0,89 |
| 80-84 | 62 787 | 65 990 | 128 777 | 0,49 |
| 85-89 | 25 810 | 26 716 | 52 526 | 0,20 |
| 90-94 | 8 940 | 11 395 | 20 335 | 0,08 |
| 95+ | 4 201 | 7 007 | 11 208 | 0,04 |
| Age group | Male | Female | Total | Percent |
|---|---|---|---|---|
| 0-14 | 4 714 763 | 4 533 483 | 9 248 246 | 34,91 |
| 15-64 | 7 437 790 | 8 410 885 | 15 848 675 | 59,82 |
| 65+ | 696 488 | 701 095 | 1 397 583 | 5,27 |
Demographic statistics
| Most Populous Caste/Ethnic groups (Census 2011)[6] | Population | % of total |
|---|---|---|
| Khas-Chhetri | 4,398,053 | 16.6% |
| Khas/bahun | 3,226,903 | 12.2% |
| Magar | 1,887,733 | 7.1% |
| Tharu | 1,737,470 | 6.5% |
| Tamang | 1,539,830 | 5.8% |
| Newar (taken as a single communal group) | 1,321,933 | 5.0% |
| Khas-Kami | 1,258,554 | 4.7% |
| Muslim (taken as a single religious group) | 1,164,255 | 4.4% |
| Yadav | 1,054,458 | 4.0% |
| Rai | 620,004 | 2.3% |
| Gurung | 522,641 | 1.9% |
| Damai/Dholi | 472,862 | 1.8% |
| Khas-Thakuri | 425,623 | 1.6% |
| Limbu | 387,300 | 1.4% |
| Sarki | 374,816 | 1.41% |
| Teli | 369,688 | 1.4% |
| Chamar/Harijan/Ram | 335,893 | 1.3% |
| Koiri/Kushwaha | 306,393 | 1.1% |
| Musahar | 234,490 | 0.88% |
| Kurmi | 231,129 | 0.87% |
| Sanyasi/Dasnami | 227,822 | 0.86% |
| Dhanuk | 219,808 | 0.82% |
| Dusadh/Pasawan | 208,910 | 0.79% |
| Sherpa | 112,946 | 0.42% |
| Sunuwar | 100,000 | 0.38% |
| Other (more than 100 caste/ethnic groups) | 4,229,290 | 15.96% |
Nepal Demographic and Health Survey
Total Fertility Rate (TFR) (Wanted Fertility Rate) and Crude Birth Rate (CBR):[7]
| Year | CBR (Total) | TFR (Total) | CBR (Urban) | TFR (Urban) | CBR (Rural) | TFR (Rural) |
|---|---|---|---|---|---|---|
| 1996 | 37 | 4.64 (2,9) | 27 | 2.85 (1,9) | 38 | 4.83 (3,1) |
| 2001 | 33.5 | 4.1 (2,5) | 20.6 | 2.1 (1,4) | 34.9 | 4.4 (2,6) |
| 2006 | 28.4 | 3.1 (2,0) | 21.9 | 2.1 (1,4) | 29.5 | 3.3 (2,1) |
| 2011 | 24.3 | 2.6 (1,8) | 16.6 | 1.6 (1,2) | 25.5 | 2.8 (1,8) |
The following demographic statistics are from the 2011 Nepal Demographic and Health Survey (NDHS).[8]
Median birth intervals (Median number of months since preceding birth)
- Total: 36.2
- Rural: 35.9
- Urban: 40.3 (2011)
Median age at first birth
- Median age: 20.1 (2011)
Fertility rate - past trend and present
- Total fertility rate: 4.6 children born/woman (1996)
- Total fertility rate: 4.1 children born/woman (2001)
- Total fertility rate: 3.1 children born/woman (2006)
- Total fertiltiy rate: 2.6 children born/woman
- Rural fertility rate: 2.8 children born/woman
- Urban fertility rate: 1.6 children born/woman (2011)
Ideal family size - Mean ideal number of children
- Overall (female/male): 2.1 / 2.3
- Currently married (female/male): 2.2 / 2.3
- Urban (female/male): 1.9 / 2.0
- Rural (female/male): 2.2 / 2.3 (2011)
Ideal family size by gender and age group
- Below is a table of the ideal family size by gender and age for 2011.
| Age | Women | Men |
|---|---|---|
| 15-19 | 1.9 | 2.2 |
| 20-24 | 1.9 | 2.1 |
| 25-29 | 2.1 | 2.1 |
| 30-34 | 2.2 | 2.3 |
| 35-39 | 2.3 | 2.4 |
| 40-44 | 2.5 | 2.4 |
| 45-49 | 2.6 | 2.6 |
CIA World Factbook
The following demographic statistics are from the CIA World Factbook, unless otherwise indicated.
Nationality
- Noun: Nepali, Nepalese, Gorkhali (singular and plural)
- Adjective: Nepali, Nepalese,Gorkhali
Religions
- Hindu 81.34%, Buddhist 9.04%, Muslim 4.38%, Kirant 3.04%, other 2.2% (2011 census).
Literacy
- Definition: age 15 and over can read and write
- Total population: 48.6%
- Male: 62.7%
- Female: 34.9% (2001 census)
Population
- 29,033,914 (July 2016 est.)
Age structure
- 0-14 years: 30.93% (male 4,646,048/female 4,333,105)
- 15-24 years: 21.86% (male 3,176,158/female 3,169,721)
- 25-54 years: 35.99% (male 4,707,264/female 5,740,985)
- 55-64 years: 6.22% (male 877,288/female 927,202)
- 65 years and over: 5.02% (male 723,523/female 732,620) (2016 est.)
Median age
- total: 23.6 years
- male: 22.4 years
- female: 24.8 years (2016 est.)
Population growth rate
- 1.24% (2016 est.)
Birth rate
- 19.9 births/1,000 population (2016 est.)
Death rate
- 5.7 deaths/1,000 population (2016 est.)
Net migration rate
- -1.9 migrant(s)/1,000 population (2016 est.)
Total fertility rate
- 2.18 children born/woman (2016 est.)
Urbanization
- urban population: 18.6% of total population (2015)
- rate of urbanization: 3.18% annual rate of change (2010-15 est.)
Sex ratio
- at birth: 1.04 male(s)/female
- 0-14 years: 1.07 male(s)/female
- 15-24 years: 1 male(s)/female
- 25-54 years: 0.82 male(s)/female
- 55-64 years: 0.95 male(s)/female
- 65 years and over: 0.86 male(s)/female
- total population: 0.99 male(s)/female (2016 est.)
Life expectancy at birth
- total population: 70.7 years
- male: 70.1 years
- female: 71.3 years (2016 est.)
Languages
Nepal's diverse linguistic heritage evolved from three major language groups: Indo-Aryan, Tibeto-Burman languages, and various indigenous language isolates. According to the 2001 national census, 92 different living languages are spoken in Nepal (a 93rd category was "unidentified"). The major languages of Nepal as of 2011 census.[10] (percent spoken as mother tongue language) includes
Nepali (derived from Khas bhasa) is considered to be a member of Indo-European language and is written in Devanagari script. Nepali was the language of the house of Gorkhas in the late 18th century and became the official, national language that serves as the lingua franca among Nepalese of different ethnolinguistic groups. Maithili—along with regional dialects Awadhi and Bhojpuri—are originated in Terai of Nepal and spoken in the southern Terai Region. Many Nepali in government and business uses English as an official language. English is the language of technical, medical and scientific community as well as the elite bankers, traders and entrepreneurs. There has been a surge in the number and percentage of people who understand English. Majority of the urban and a significant number of the rural schools are English-medium schools. Higher education in technical, medical, scientific and engineering fields are entirely in English. Nepal Bhasa, the mother-tongue of the Newars, is widely used and spoken in and around Kathmandu Valley and in major Newar trade towns across Nepal.
Other languages, particularly in the Inner Terai, hill and mountain regions are remnants of the country's pre-unification history of dozens of political entities isolated by mountains and gorges. These languages typically are limited to an area spanning about one day's walk. Beyond that distance dialects and languages lose mutual intelligibility.
Religion

As of the 2011 census, 81.3% of the Nepalese population was Hindu, 9.0% Buddhist, 4.4% Muslim, 3.0% Kirant/Yumaist, 1.42% Christian, and 0.9% followed other religions or no religion.[11]
Religion is important in Nepal; the Kathmandu Valley alone has more than 2,700 religious shrines. The dissolved constitution of Nepal described the country as a "Hindu kingdom", although it did not establish Hinduism as the state religion. Nepal's constitution continues long-standing legal provisions prohibiting discrimination against other religions (but also proselytization). The king was deified as the earthly manifestation of the Hindu god Vishnu. Then on 19 May 2006, the government facing a constitutional crisis, the House of Representatives which had been just reformed, having been previously dissolved, declared Nepal a "secular state".
The 2001 census identified 80.6% of the population as Hindu and 10.7% as Buddhist (although many people labeled Hindu or Buddhist often practice a syncretic blend of Hinduism, Buddhism, or animist traditions), 4.2% of the population was Muslim, 3.6% of the population followed the indigenous Kirant Mundhum religion and Christianity was practiced by 0.45% of the population.[12]
Buddhist and Hindu shrines and festivals are respected and celebrated by most Nepalese. Certain animist practices of old indigenous religions survive.
Ethnic and regional equity
Pahari Hill Hindus of the Khas Gorkha tribe (Bahun and Chhetri castes) and the Newar ethnicity dominated the civil service, the judiciary and upper ranks of the army throughout the Shah regime (1768–2008). Nepali was the national language and Sanskrit became a required school subject. Children who spoke Nepali natively and who were exposed to Sanskrit had much better chances of passing the national examinations at the end of high school, which meant they had better employment prospects and could continue into higher education. Children who natively spoke local languages of the Madhesh and Hills, or Tibetan dialects prevailing in the high mountains were at a considerable disadvantage. This history of exclusion coupled with poor prospects for improvement created grievances that encouraged many in ethnic communities such as Madhesi and Tharu in the Tharuhat and Madhesh and Kham Magar in the mid-western hills to support the Unified Communist Party of Nepal (Maoist) and various other armed Maoist opposition groups such as the JTMM during and after the Nepalese Civil War. The negotiated end to this war forced King Gyanendra to abdicate in 2008. Issues of ethnic and regional equity have tended to dominate the agenda of the new republican government and continue to be divisive.[13][14][15][16][17]
Nepalese in the U.K.
According to latest figure from Office for National Statistics estimates that 51,000 Nepal-born people are currently resident in the UK .[18]
Nepalese in Hong Kong
Nepali people in Hong Kong are mainly the children of ex-Gurkhas born in Hong Kong during their parents' service with the British Army's Brigade of Gurkhas, which was based in Hong Kong from the 1970s until the handover. Large groups can be found in Shek Kong, Yuen Long District, of the main bases of the British army. Many ex-Gurkhas remained in Hong Kong after the end of their service under the sponsorship of their Hong Kong-born children, who held right of abode.
Nepalese of middle age or older generations in Hong Kong are predominantly found in security, while those of younger generations are predominantly found in the business industry.
Nepalese overseas
Nepalese migrants abroad have suffered tremendous hardships, including some 7,500 deaths in the Middle East and Malaysia alone since the year 2000, some 3,500 in Saudi Arabia.[19]
| Country | Articles | Population |
|---|---|---|
| Saudi Arabia | Nepalese in Saudi Arabia | 550,000 |
| Malaysia | Nepalese people in Malaysia | 617,587 |
| Qatar | Nepalis in Qatar | 400,000[20] |
| Japan | 36,107 | |
| United Arab Emirates | Nepalese in the United Arab Emirates | 400,000 |
| United Kingdom[18] | Nepalis in the United Kingdom | 50,000 |
| Iraq[21] | 30,000 | |
| China | Nepalis in China | 21,000 |
| Continental Europe | 20,000 | |
| Hong Kong | Nepalis in Hong Kong | 16,000 |
| South Korea | Nepalis in South Korea | 22,015 |
| Singapore | Nepalese in Singapore | 4000 |
| Total Overseas Nepal Population | ~1,216,709 | |
Foreign population in Nepal
As per census of 2001 there are 116,571 foreign born citizens in Nepal out of which 90% are Indian origin[22] followed by Bhutan, Pakistan and China. This number does not include the refugees from Bhutan and Tibet.

References
- 1 2 "Nepalese peoples and nationality law". The World Factbook. CIA. Retrieved 3 Septembemer. Check date values in:
|access-date=(help) - ↑ "National Population and Housing Census 2011 (National Report)" (PDF). Central Bureau of Statistics (Nepal). Archived from the original (PDF) on 18 April 2013. Retrieved 26 November 2012.
- ↑ "World Population Prospects, the 2012 Revision". un.org.
- ↑ http://unstats.un.org/unsd/demographic/products/vitstats/serATab3.pdf
- ↑ http://unstats.un.org/unsd/demographic/products/dyb/dyb2.htm
- ↑ "Nepal Demographics Profile 2014". IndexMundi. CIA World Factbook.
- ↑ "MEASURE DHS: Demographic and Health Surveys". worldbank.org.
- ↑ "Nepal Demographic and Health Survey 2011." (PDF). Retrieved 2011-05-07.
- 1 2 "South Asia ::NEPAL". CIA The World Factbook.
- ↑ "Official Summary of Census" (PDF). Central Bureau of Statistics, Nepal. 2011. Archived from the original (PDF) on 2 December 2012.
- ↑ "2011 Nepal Census Report" (PDF). cbs.gov.np. p. 16. Archived from the original (PDF) on 18 April 2013.
- ↑ Archived 9 April 2008 at the Wayback Machine.
- ↑ "OCHA Nepal – Situation Overview" (PDF). Issue 12. OCHA. April 2007. Archived from the original (PDF) on 13 November 2009. Retrieved 2011-05-07.
- ↑ "OCHA Nepal – Situation Overview" (PDF). Issue 16. OCHA. July–August 2007. Retrieved 2011-05-07.
- ↑ "OCHA Nepal – Situation Overview" (PDF). Issue 30. OCHA. June–July 2008. Archived from the original (PDF) on 18 February 2010. Retrieved 2011-05-07.
- ↑ Sharma, Hari (2010-11-18). "Body of murder victim found in Gulmi". Gulmi: The Himalayan Times online. Archived from the original on 25 May 2012. Retrieved 2011-05-07.
- ↑ Hatlebakk, Magnus (2007). "Economic and social structures that may explain the recent conflicts in the Terai of Nepal" (PDF). Kathmandu: Norwegian Embassy. Retrieved 2011-05-08.
- 1 2 "Population by Country of birth and nationality Jan10-Dec10". Office for National Statistics. September 2011. Retrieved 17 September 2010.
- ↑ "'Natural deaths' raise doubts". ekantipur.com.
- ↑ "Qatar's population - by nationality". bq Magazine.
- ↑ "Nepal government lifts Iraq working ban". BBC News.
- ↑ Subedi, Bhim Prasad (2007). "The Issue of Foreign Born Population in Nepal: A Short Essay in Honor of Dr. Harka Gurung". The Himalayan Review. 38: 23–34.
![]() This article incorporates public domain material from the CIA World Factbook document "2003 edition".
This article incorporates public domain material from the CIA World Factbook document "2003 edition".
External links
| Sino-Tibetan (Trans-Himalayan) |
| ||||||||||||||
|---|---|---|---|---|---|---|---|---|---|---|---|---|---|---|---|
| Indo-Aryan |
| ||||||||||||||
| Indo-Aryan of a distinct origin | |||||||||||||||
| Other peoples (M, D, i) of Indus-Ganga |
| ||||||||||||||
| Immigrants | |||||||||||||||
| Other basis |
| ||||||||||||||
| Africa |  | ||||||||||
|---|---|---|---|---|---|---|---|---|---|---|---|
| Americas | |||||||||||
| Asia |
| ||||||||||
| Europe | |||||||||||
| Oceania | |||||||||||