Economy of Greece
 Greek agriculture, shipping and tourism | |
| Currency | 1 euro (ευρώ) = 100 cents (λεπτά)[1] |
|---|---|
| Calendar year[2] | |
Trade organisations | EU, WTO, OECD, BIS, BSEC[2] |
| Statistics | |
| GDP |
|
| GDP rank |
45th (nominal, 2015)[4] 51st (PPP, 2015)[5] |
GDP growth |
|
GDP per capita |
|
GDP by sector | services: 82.8%; industry: 13.3%; agriculture: 3.9% (2015 est.) |
| −0.5% (October 2016)[7] | |
Population below poverty line |
|
|
| |
Labour force | 4,813,920 (August 2016)[12] |
Labour force by occupation | services: 72.4%; industry: 15%; agriculture: 12.6% (2015 est.) |
| Unemployment |
|
Average gross salary | €18,495 (2013; annual)[13] |
| €9,303 (2013; annual, equivalised)[14] | |
Median net salary | €8,371 (2013; annual, equivalised)[14] |
Main industries | shipping (4th; 2011),[15][16] tourism, food and tobacco processing, textiles, chemicals, metal products; mining, petroleum[2] |
|
| |
| External | |
| Exports |
€25.9 billion ( |
Export goods | petroleum oils (not crude), etc 38.88%, aluminium and articles thereof 4.38%; electrical, electronic equipment 3.75%; pharmaceutical products 3.48%; plastics and articles thereof 3.32%; vegetables, fruits, etc 3.18%; iron and steel products 3.03% (2012)[19] |
Main export partners |
|
| Imports |
€43.6 billion ( |
Import goods | crude petroleum oils, etc 37.47%; electrical, electronic equipment 6.48%; pharmaceutical products 5.92%; machinery, etc 4.2%; ships, boats, etc 4.13%; plastics and articles thereof 2.72%; cars, car parts, motorcycles, etc 2.72% (2012)[19] |
Main import partners |
|
FDI stock |
|
|
| |
Gross external debt |
|
|
| |
| Public finances | |
|
€315.292 billion ( | |
|
€13.237 billion ( | |
| Revenues |
|
| Expenses |
|
Foreign reserves |
|
The economy of Greece is the 45th largest in the world with a nominal gross domestic product (GDP) of $195.212 billion per annum.[4] It is also the 51st largest in the world by purchasing power parity, at $288.778 billion per annum.[5] As of 2015, Greece is the fifteenth-largest economy in the 28-member European Union.[28] Greece is ranked 38th and 45th in the world at $17,988 and $26,391 for nominal GDP per capita and purchasing power parity per capita respectively.[3]
Greece is a developed country with an economy based on the service (82.8%) and industrial sectors (13.3%). The agricultural sector contributed 3.9% of national economic output in 2015.[2] Important Greek industries include tourism and shipping. With 18 million international tourists in 2013, Greece was the 7th most visited country in the European Union and 16th in the world.[29] The Greek Merchant Navy is the largest in the world, with Greek-owned vessels accounting for 15% of global deadweight tonnage as of 2013.[30] The increased demand for international maritime transportation between Greece and Asia has resulted in unprecedented investment in the shipping industry.[31]
The country is a significant agricultural producer within the EU. Greece has the largest economy in the Balkans and is as an important regional investor.[32][33] Greece was the largest foreign investor in Albania in 2013,[34] the third in Bulgaria, in the top-three in Romania and Serbia and the most important trading partner and largest foreign investor in the former Yugoslav Republic of Macedonia.[35][36][37] The Greek telecommunications company OTE has become a strong investor in former Yugoslavia and in other Balkan countries.[35]
Greece is classified as an advanced,[38] high-income economy,[39] and was a founding member of the Organisation for Economic Co-operation and Development (OECD) and of the Organization of the Black Sea Economic Cooperation (BSEC). The country joined what is now the European Union in 1981.[1] In 2001 Greece adopted the euro as its currency, replacing the Greek drachma at an exchange rate of 340.75 drachmae per euro.[1][40] Greece is a member of the International Monetary Fund and of the World Trade Organization, and ranked 34th on Ernst & Young's Globalization Index 2011.[41]
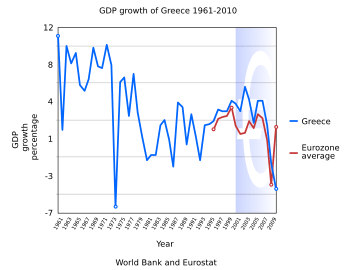
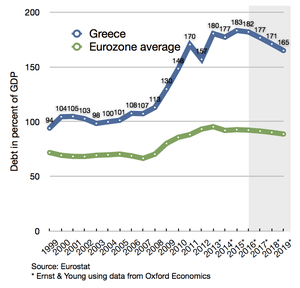
World War II (1939-1945) devastated the country's economy, but the high levels of economic growth that followed from 1950 to 1980 have been called the Greek economic miracle.[42] From 2000 Greece saw high levels of GDP growth above the Eurozone average, peaking at 5.8% in 2003 and 5.7% in 2006.[43] The subsequent Great Recession and Greek government-debt crisis, a central focus of the wider European debt crisis, plunged the economy into a sharp downturn, with real GDP growth rates of −0.3% in 2008, −4.3% in 2009, −5.5% in 2010, −9.1% in 2011, −7.3% in 2012 and −3.2% in 2013.[44] In 2011, the country's public debt reached €356 billion (172% of nominal GDP).[45] After negotiating the biggest debt restructuring in history with the private sector, Greece reduced its sovereign debt burden to €280 billion (137% of GDP) in the first quarter of 2012.[46] Greece achieved a real GDP growth rate of 0.7% in 2014 after 6 years of economic decline,[44][47] but fell back into recession in 2015.[6][48][49]
History

The evolution of the Greek economy during the 19th century (a period that transformed a large part of the world because of the Industrial Revolution) has been little researched. Recent research from 2006[50] examines the gradual development of industry and further development of shipping in a predominantly agricultural economy, calculating an average rate of per capita GDP growth between 1833 and 1911 that was only slightly lower than that of the other Western European nations. Industrial activity, (including heavy industry like shipbuilding) was evident, mainly in Ermoupolis and Piraeus.[51][52] Nonetheless, Greece faced economic hardships and defaulted on its external loans in 1826, 1843, 1860 and 1893.[53]
Other studies support the above view on the general trends in the economy, providing comparative measures of standard of living. The per capita income (in purchasing power terms) of Greece was 65% that of France in 1850, 56% in 1890, 62% in 1938,[54][55] 75% in 1980, 90% in 2007, 96.4% in 2008 and 97.9% in 2009.[56][57]
The country's post-World War II development has largely been connected with the Greek economic miracle.[42] During that period, Greece saw growth rates second only to those of Japan, while ranking first in Europe in terms of GDP growth.[42] It is indicative that between 1960 and 1973 the Greek economy grew by an average of 7.7%, in contrast to 4.7% for the EU15 and 4.9% for the OECD.[42] Also during that period, exports grew by an average annual rate of 12.6%.[42]
Strengths and weaknesses
Greece enjoys a high standard of living and very high Human Development Index, ranking 29th in the world in 2014.[58] However, the severe recession of recent years has seen GDP per capita fall from 94% of the EU average in 2009 to 71% in 2015.[59][60] Actual Individual Consumption (AIC) per capita fell from 104% of the EU average to 81% during the same period.[59][60]
Greece's main industries are tourism, shipping, industrial products, food and tobacco processing, textiles, chemicals, metal products, mining and petroleum. Greece's GDP growth has also, as an average, since the early 1990s been higher than the EU average. However, the Greek economy continues to face significant problems, including high unemployment levels, an inefficient public sector bureaucracy, tax evasion, corruption and low global competitiveness.[61][62]
Greece is ranked 58th in the world on the Corruption Perceptions Index, alongside Romania.[63] Greece has the EU's lowest Index of Economic Freedom and Global Competitiveness Index, ranking 138th and 86th in the world respectively.[64][65]
| Economy of Greece |
|---|
 |
| Overview |
| Greece topics |
|
After fourteen consecutive years of economic growth, Greece went into recession in 2008.[66] By the end of 2009, the Greek economy faced the highest budget deficit and government debt-to-GDP ratios in the EU. After several upward revisions, the 2009 budget deficit is now estimated at 15.7% of GDP.[67] This, combined with rapidly rising debt levels (127.9% of GDP in 2009) led to a precipitous increase in borrowing costs, effectively shutting Greece out of the global financial markets and resulting in a severe economic crisis.[68]
Greece was accused of trying to cover up the extent of its massive budget deficit in the wake of the global financial crisis.[69] The allegation was prompted by the massive revision of the 2009 budget deficit forecast by the new PASOK government elected in October 2009, from "6–8%" (estimated by the previous New Democracy government) to 12.7% (later revised to 15.7%). However, the accuracy of the revised figures has also been questioned, and in February 2012 the Hellenic Parliament voted in favor of an official investigation following accusations by a former member of the Hellenic Statistical Authority that the deficit had been artificially inflated in order to justify harsher austerity measures.[70][71]
| Average GDP growth by era[43] | |||
|---|---|---|---|
| 1961–1970 | 8.44% | ||
| 1971–1980 | 4.70% | ||
| 1981–1990 | 0.70% | ||
| 1991–2000 | 2.36% | ||
| 2001–2007 | 4.11% | ||
| 2008–2011 | −4.8% | ||
| 2012–2015 | −2.52% | ||
The Greek labor force, which amount around 5 million workers, average 2,032 hours of work per worker annually in 2011, is ranked fourth among OECD countries, after Mexico, South Korea and Chile.[72] The Groningen Growth & Development Centre has published a poll revealing that between 1995 and 2005, Greece was the country whose workers have the most hours/year work among European nations; Greeks worked an average of 1,900 hours per year, followed by Spaniards (average of 1,800 hours/year).[73]
As a result of the ongoing economic crisis, industrial production in the country went down by 8% between March 2010 and March 2011,[74] The volume of building activity saw a reduction of 73% in 2010.[75] Additionally, the turnover in retail sales saw a decline of 9% between February 2010 and February 2011.[76]
Between 2008 and 2013 unemployment skyrocketed, from a generational low of 7.2% in the second and third quarters of 2008 to a high of 27.9% in June 2013, leaving over a million jobless.[77][78][79] Youth unemployment peaked at 64.9% in May 2013.[80] In 2015, unemployment was rated around 24% and youth unemployment around 47%.
Eurozone entry
Greece was accepted into the Economic and Monetary Union of the European Union by the European Council on 19 June 2000, based on a number of criteria (inflation rate, budget deficit, public debt, long-term interest rates, exchange rate) using 1999 as the reference year. After an audit commissioned by the incoming New Democracy government in 2004, Eurostat revealed that the statistics for the budget deficit had been under-reported.[81]
Most of the differences in the revised budget deficit numbers were due to a temporary change of accounting practices by the new government, i.e., recording expenses when military material was ordered rather than received.[82] However, it was the retroactive application of ESA95 methodology (applied since 2000) by Eurostat, that finally raised the reference year (1999) budget deficit to 3.38% of GDP, thus exceeding the 3% limit. This led to claims that Greece (similar claims have been made about other European countries like Italy)[83] had not actually met all five accession criteria, and the common perception that Greece entered the Eurozone through "falsified" deficit numbers.
In the 2005 OECD report for Greece,[84] it was clearly stated that "the impact of new accounting rules on the fiscal figures for the years 1997 to 1999 ranged from 0.7 to 1 percentage point of GDP; this retroactive change of methodology was responsible for the revised deficit exceeding 3% in 1999, the year of [Greece's] EMU membership qualification". The above led the Greek minister of finance to clarify that the 1999 budget deficit was below the prescribed 3% limit when calculated with the ESA79 methodology in force at the time of Greece's application, and thus the criteria had been met.[85]
The original accounting practice for military expenses was later restored in line with Eurostat recommendations, theoretically lowering even the ESA95-calculated 1999 Greek budget deficit to below 3% (an official Eurostat calculation is still pending for 1999).
An error sometimes made is the confusion of discussion regarding Greece’s Eurozone entry with the controversy regarding usage of derivatives’ deals with U.S. Banks by Greece and other Eurozone countries to artificially reduce their reported budget deficits. A currency swap arranged with Goldman Sachs allowed Greece to "hide" 2.8 billion Euros of debt, however, this affected deficit values after 2001 (when Greece had already been admitted into the Eurozone) and is not related to Greece’s Eurozone entry.[86]
A study of the period 1999–2009 by forensic accountants has found that data submitted to Eurostat by Greece, among other countries, had a statistical distribution indicative of manipulation; "Greece with a mean value of 17.74, shows the largest deviation from Benford's law among the members of the eurozone, followed by Belgium with a value of 17.21 and Austria with a value of 15.25".[87][88]
2010–2015 government debt crisis
By the end of 2009, as a result of a combination of international and local factors the Greek economy faced its most-severe crisis since the restoration of democracy in 1974 as the Greek government revised its deficit from a prediction of 3.7% in early 2009 and 6% in September 2009, to 12.7% of gross domestic product (GDP).[89][90]
In early 2010, it was revealed that through the assistance of Goldman Sachs, JPMorgan Chase and numerous other banks, financial products were developed which enabled the governments of Greece, Italy and many other European countries to hide their borrowing.[91][92] Dozens of similar agreements were concluded across Europe whereby banks supplied cash in advance in exchange for future payments by the governments involved; in turn, the liabilities of the involved countries were "kept off the books".[92][93][94][95][96][97]
According to Der Spiegel, credits given to European governments were disguised as "swaps" and consequently did not get registered as debt because Eurostat at the time ignored statistics involving financial derivatives. A German derivatives dealer had commented to Der Spiegel that "The Maastricht rules can be circumvented quite legally through swaps," and "In previous years, Italy used a similar trick to mask its true debt with the help of a different US bank."[97] These conditions had enabled Greek as well as many other European governments to spend beyond their means, while meeting the deficit targets of the European Union and the monetary union guidelines.[92][98] In May 2010, the Greek government deficit was again revised and estimated to be 13.6%[99] which was the second highest in the world relative to GDP with Iceland in first place at 15.7% and Great Britain third with 12.6%.[100] Public debt was forecast, according to some estimates, to hit 120% of GDP during 2010.[101]
As a consequence, there was a crisis in international confidence in Greece's ability to repay its sovereign debt, as reflected by the rise of the country's borrowing rates (although their slow rise – the 10-year government bond yield only exceeded 7% in April 2010 – coinciding with a large number of negative articles, has led to arguments about the role of international news media in the evolution of the crisis). In order to avert a default (as high borrowing rates effectively prohibited access to the markets), in May 2010 the other Eurozone countries, and the IMF, agreed to a "rescue package" which involved giving Greece an immediate €45 billion in bail-out loans, with more funds to follow, totaling €110 billion.[102][103] In order to secure the funding, Greece was required to adopt harsh austerity measures to bring its deficit under control.[104] Their implementation will be monitored and evaluated by the European Commission, the European Central Bank and the IMF.[105][106]
The financial crisis – particularly the austerity package put forth by the EU and the IMF – has been met with anger by the Greek public, leading to riots and social unrest, while there have been theories about the offect of international media. Despite - others say because of - the long range of austerity measures, the government deficit has not been reduced accordingly, mainly, according to many economists, because of the subsequent recession.[107][108][109][110][111]
Public sector workers have come out on strike in order to resist job cuts and reductions to salaries as the government promises that a large scale privatisation programme will be accelerated.[112] Immigrants are sometimes treated as scapegoats for economic problems by far-right extremists.[113]
In 2013, Greece became the first developed market to be reclassified as an emerging market by financial services companies MSCI and S&P Dow Jones Indices.[114][115][116]
By July 2014 there was still anger and protests about the austerity measures, with a 24-hour strike among government workers timed to coincide with an audit by inspectors from the International Monetary Fund, the European Union and European Central Bank in advance of a decision on a second bailout of one billion euros ($1.36 billion), due in late July.[117]
Greece exited its six-year recession in the second quarter of 2014,[47][118] but the challenges of securing political stability and debt sustainability remain.[119]
Primary sector
Agriculture and fishery


In 2010, Greece was the European Union's largest producer of cotton (183,800 tons) and pistachios (8,000 tons)[120] and ranked second in the production of rice (229,500 tons)[120] and olives (147,500 tons),[121] third in the production of figs (11,000 tons) and[121] almonds (44,000 tons),[121] tomatoes (1,400,000 tons)[121] and watermelons (578,400 tons)[121] and fourth in the production of tobacco (22,000 tons).[120] Agriculture contributes 3.8% of the country's GDP[2] and employs 12.4% of the country's labor force.[2]
Greece is a major beneficiary of the Common Agricultural Policy of the European Union. As a result of the country's entry to the European Community, much of its agricultural infrastructure has been upgraded and agricultural output increased. Between 2000 and 2007 organic farming in Greece increased by 885%, the highest change percentage in the EU.[122]
In 2007, Greece accounted for 19% of the EU's fishing haul in the Mediterranean Sea,[123] ranked third with 85,493 tons,[123] and ranked first in the number of fishing vessels in the Mediterranean between European Union members.[123] Additionally, the country ranked 11th in the EU in total quantity of fish caught, with 87,461 tons.[123]
Secondary sector
Industry

Between 2005 and 2011, Greece has had the highest percentage increase in industrial output compared to 2005 levels out of all European Union members, with an increase of 6%.[124] Eurostat statistics show that the industrial sector was hit by the Greek financial crisis throughout 2009 and 2010,[125] with domestic output decreasing by 5.8% and industrial production in general by 13.4%.[125] Currently, Greece is ranked third in the European Union in the production of marble (over 920,000 tons), after Italy and Spain.
Between 1999 and 2008, the volume of retail trade in Greece increased by an average of 4.4% per year (a total increase of 44%),[125] while it decreased by 11.3% in 2009.[125] The only sector that did not see negative growth in 2009 was administration and services, with a marginal growth of 2.0%.[125]
In 2009, Greece's labor productivity was 98% that of the EU average,[125] but its productivity-per-hour-worked was 74% that the Eurozone average.[125] The largest industrial employer in the country (in 2007) was the manufacturing industry (407,000 people),[125] followed by the construction industry (305,000)[125] and mining (14,000).[125]
| Rank | Production | Rank | Production | ||
|---|---|---|---|---|---|
| Industry | Value | Industry | Value | ||
| 1 | Portland cement | €897,378,450 | 6 | Cigarettes | €480,399,323 |
| 2 | Pharmaceuticals | €621,788,464 | 7 | Beer | €432,559,943 |
| 3 | Ready-mix concrete | €523,821,763 | 8 | Dairy | €418,527,007 |
| 4 | Beverages (non-alcoholic) | €519,888,468 | 9 | Aluminium slabs | €391,393,930 |
| 5 | Rebars | €499,789,102 | 10 | Coca-Cola products | €388,752,443 |
| – | Total production value: €20,310,940,279 | ||||
| Rank | Production | Rank | Production | ||
|---|---|---|---|---|---|
| Industry | Value (€) | Industry | Value (€) | ||
| 1 | Portland cement | 699,174,850 | 6 | Ready-mixed concrete | 438,489,443 |
| 2 | Pharmaceuticals (medicaments of mixed or unmixed products (other), p.r.s., n.e.c) | 670,923,632 | 7 | Beer made from malt (excluding non-alcoholic beer, beer containing <= 0.5% by volume of alcohol, alcohol duty) | 405,990,419 |
| 3 | Waters, with added sugar, other sweetening matter or flavoured, i.e. soft drinks (including mineral and aerated) | 561,611,081 | 8 | Milk and cream of a fat content by weight of > 1% but <= 6%, not concentrated nor containing added sugar or other sweetening matter, in immediate packings of a net content <= 2l | 373,780,989 |
| 4 | Hot rolled concrete reinforcing bars | 540,919,270 | 9 | Cigarettes containing tobacco or mixtures of tobacco and tobacco substitutes (excluding tobacco duty) | 350,420,600 |
| 5 | Grated, powdered, blue-veined and other non-processed cheese (excluding fresh cheese, whey cheese and curd) | 511,528,250 | 10 | Cheese fondues and other food preparations, n.e.c. | 300,883,207 |
| – | Total production value: €17,489,538,838 | ||||
| – | p.r.s.: packed for retail sale; n.e.c.: non elsewhere classifiable | ||||
Mining


Tertiary sector
Maritime industry


Shipping has traditionally been a key sector in the Greek economy since ancient times.[128] In 1813, the Greek merchant navy was made up of 615 ships.[129] Its total tonnage was 153,580 tons and was manned with 37,526 crewmembers and 5,878 cannons.[129] In 1914 the figures stood at 449,430 tons and 1,322 ships (of which 287 were steam boats).[130]
During the 1960s, the size of the Greek fleet nearly doubled, primarily through the investment undertaken by the shipping magnates Onassis, Vardinoyannis, Livanos and Niarchos.[131] The basis of the modern Greek maritime industry was formed after World War II when Greek shipping businessmen were able to amass surplus ships sold to them by the United States Government through the Ship Sales Act of the 1940s.[131]
Greece has the largest merchant navy in the world, accounting for more than 15% of the world's total deadweight tonnage (dwt) according to the United Nations Conference on Trade and Development.[30] The Greek merchant navy's total dwt of nearly 245 million is comparable only to Japan's, which is ranked second with almost 224 million.[30] Additionally, Greece represents 39.52% of all of the European Union's dwt.[132] However, today's fleet roster is smaller than an all-time high of 5,000 ships in the late 1970s.[128]
Greece is ranked fourth in the world by number of ships (3,695), behind China (5,313), Japan (3,991), and Germany (3,833).[30] A European Community Shipowners' Associations report for 2011–2012 reveals that the Greek flag is the seventh-most-used internationally for shipping, while it ranks second in the EU.[132]
In terms of ship categories, Greek companies have 22.6% of the world's tankers[132] and 16.1% of the world's bulk carriers (in dwt).[132] An additional equivalent of 27.45% of the world's tanker dwt is on order,[132] with another 12.7% of bulk carriers also on order.[132] Shipping accounts for an estimated 6% of Greek GDP,[133] employs about 160,000 people (4% of the workforce),[134] and represents 1/3 of the country's trade deficit.[134] Earnings from shipping amounted to €14.1 billion in 2011,[132] while between 2000 and 2010 Greek shipping contributed a total of €140 billion[133] (half of the country's public debt in 2009 and 3.5 times the receipts from the European Union in the period 2000–2013).[133] The 2011 ECSA report showed that there are approximately 750 Greek shipping companies in operation.[133]
The latest available data from the Union of Greek Shipowners show that "the Greek-owned ocean-going fleet consists of 3,428 ships, totaling 245 million deadweight tonnes in capacity. This equals 15.6 percent of the carrying capacity of the entire global fleet, including 23.6 percent of the world tanker fleet and 17.2 percent of dry bulk".[135]
Counting shipping as quasi-exports and in terms of monetary value, Greece ranked 4th globally in 2011 having exported shipping services worth 17,704.132 million $; only Denmark, Germany and South Korea ranked higher during that year.[15] Similarly counting shipping services provided to Greece by other countries as quasi-imports and the difference between exports and imports as a trade balance, Greece in 2011 ranked in the latter second behind Germany, having imported shipping services worth 7,076.605 million US$ and having run a trade surplus of 10,712.342 million US$.[136][137]
| Year | 2000 | 2001 | 2002 | 2003 | 2004 | 2005 | 2006–2008 | 2009 | 2010 | 2011 |
|---|---|---|---|---|---|---|---|---|---|---|
| Exports: | ||||||||||
| Global ranking[15] | 5th | 5th | 5th | 4th | 3rd | 5th | -b | 5th | 6th | 4th |
| Value (US$ million)[15] | 7,558.995 | 7,560.559 | 7,527.175 | 10,114.736 | 15,402.209 | 16,127.623 | -b | 17,033.714 | 18,559.292 | 17,704.132 |
| Value (€ million)[15] | 8,172.559 | 8,432.670 | 7,957.654 | 8,934.660 | 12,382.636 | 12,949.869 | -b | 12,213.786 | 13,976.558 | 12,710.859 |
| Value (%GDP) | 5.93 | 5.76 | 5.08 | 5.18 | 6.68 | 6.71 | n/a | 5.29 | 6.29 | 6.10 |
| Imports: | ||||||||||
| Global ranking[136] | 14th | 13th | 14th | -b | 14th | 16th | -b | 12th | 13th | 9th |
| Value (US$ million)[136] | 3,314.718 | 3,873.791 | 3,757.000 | -b | 5,570.145 | 5,787.234 | -b | 6,653.395 | 7,846.950 | 7,076.605 |
| Value (€ million)[136] | 3,583.774 | 4,320.633 | 3,971.863 | -b | 4,478.129 | 4,646.929 | -b | 4,770.724 | 5,909.350 | 5,080.720 |
| Value (%GDP) | 2.60 | 2.95 | 2.54 | n/a | 2.42 | 2.41 | n/a | 2.06 | 2.66 | 2.44 |
| Trade balance: | ||||||||||
| Global ranking[137] | 1st | 2nd | 1st | 1ste | 1st | 1st | -b | 2nd | 1st | 2nd |
| Value (US$ million)[137] | 4,244.277 | 3,686.768 | 3,770.175 | 10,114.736e | 9,832.064 | 10,340.389 | -b | 10,340.389 | 10,380.319 | 10,712.342 |
| Value (€ million)[137] | 4,588.785 | 4,112.037 | 3,985.791 | 8,934.660e | 7,904.508 | 8,302.940 | -b | 7,443.063 | 8,067.208 | 7,630.140 |
| Value (%GDP) | 3.33 | 2.81 | 2.54 | 5.18e | 4.27 | 4.30 | n/a | 3.22 | 3.63 | 3.66 |
| GDP (€ million)[138] | 137,930.1 | 146,427.6 | 156,614.3 | 172,431.8 | 185,265.7 | 193,049.7b | n/a | 231,081.2p | 222,151.5p | 208,531.7p |
| b source reports break in time series; p source characterises data as provisional; e reported data may be erroneous because of relevant break in "Imports" time series | ||||||||||
Telecommunications

Between 1949 and the 1980s, telephone communications in Greece were a state monopoly by the Hellenic Telecommunications Organization, better known by its acronym, OTE. Despite the liberalization of telephone communications in the country in the 1980s, OTE still dominates the Greek market in its field and has emerged as one of the largest telecommunications companies in Southeast Europe.[139] Since 2011, the company's major shareholder is Deutsche Telekom with a 40% stake, while the Greek state continues to own 10% of the company's shares.[139] OTE owns several subsidiaries across the Balkans, including Cosmote, Greece's top mobile telecommunications provider, Cosmote Romania and Albanian Mobile Communications.[139]
Other mobile telecommunications companies active in Greece are Wind Hellas and Vodafone Greece. The total number of active cellular phone accounts in the country in 2009 based on statistics from the country's mobile phone providers was over 20 million,[140] a penetration of 180%.[140] Additionally, there are 5.745 million active landlines in the country.[2]
Greece has tended to lag behind its European Union partners in terms of Internet use, with the gap closing rapidly in recent years. The percentage of households with access to the Internet more than doubled between 2006 and 2013, from 23% to 56% respectively (compared with an EU average of 49% and 79%).[141][142] At the same time, there has been a massive increase in the proportion of households with a broadband connection, from 4% in 2006 to 55% in 2013 (compared with an EU average of 30% and 76%).[141][142] However, Greece also has the EU's third highest percentage of people who have never used the Internet: 36% in 2013, down from 65% in 2006 (compared with an EU average of 21% and 42%).[141][142]
Tourism


Tourism in the modern sense has only started to flourish in Greece in the years post-1950,[143][144] although tourism in ancient times is also documented in relation to religious or sports festivals such as the Olympic Games.[144] Since the 1950s, the tourism sector saw an unprecedented boost as arrivals went from 33,000 in 1950 to 11.4 million in 1994.[143]
Greece attracts more than 16 million tourists each year, thus contributing 18.2% to the nation's GDP in 2008 according to an OECD report.[145] The same survey showed that the average tourist expenditure while in Greece was $1,073, ranking Greece 10th in the world.[145] The number of jobs directly or indirectly related to the tourism sector were 840,000 in 2008 and represented 19% of the country's total labor force.[145] In 2009, Greece welcomed over 19.3 million tourists,[146] a major increase from the 17.7 million tourists the country welcomed in 2008.[147]
Among the member states of the European Union, Greece was the most popular destination for residents of Cyprus and Sweden in 2011.[148]
The ministry responsible for tourism is the Ministry of Culture and Tourism, while Greece also owns the Greek National Tourism Organization which aims in promoting tourism in Greece.[145]
In recent years a number of well-known tourism-related organizations have placed Greek destinations in the top of their lists. In 2009 Lonely Planet ranked Thessaloniki, the country's second-largest city, the world's fifth best "Ultimate Party Town", alongside cities such as Montreal and Dubai,[149] while in 2011 the island of Santorini was voted as the best island in the world by Travel + Leisure.[150] The neighbouring island of Mykonos was ranked as the 5th best island Europe.[150] Thessaloniki was the European Youth Capital in 2014.
Trade and investment
Foreign investment
Since the fall of communism, Greece has invested heavily in neighbouring Balkan countries. Between 1997 and 2009, 12.11% of foreign direct investment capital in the Republic of Macedonia was Greek, ranking fourth. In 2009 alone, Greeks invested €380 million in the country,[151] with companies such as Hellenic Petroleum having made important strategic investments.[151]
Greece invested €1.38 billion in Bulgaria between 2005 and 2007[152] and many important companies (including Bulgarian Postbank, United Bulgarian Bank Coca-Cola Bulgaria) are owned by Greek financial groups.[152] In Serbia, 250 Greek companies are active with a total investment of over €2 billion.[153] Romanian statistics from 2005 show that Greek investment in the country exceeded €3 billion.[154] Greece has been the largest investor in Albania since the fall of communism with 25% of foreign investments in 2016 coming from Greece, in addition business relations between both are extremely strong and continuously rising.[155]
Trade

Since the start of the debt crisis, Greece’s negative balance of trade has decreased significantly from €44.3 billion in 2008 to €17.7 billion in 2015.[18][156] Imports decreased by 9.8% in 2015, while exports fell by 4.5%.[18]
| Rank | Imports | Rank | Exports | ||
|---|---|---|---|---|---|
| Origin | Value | Destination | Value | ||
| 1 | | €7,238.2 | 1 | | €2,001.9 |
| 2 | | €6,918.5 | 2 | | €1,821.3 |
| 3 | | €4,454.0 | 3 | | €1,237.0 |
| 4 | | €3,347.1 | 4 | | €1,103.0 |
| 5 | | €3,098.0 | 5 | €885.4 | |
| – | | €33,330.5 | – | | €11,102.0 |
| – | Total | €60,669.9 | – | Total | €17,334.1 |
| Rank | Imports | Rank | Exports | ||
|---|---|---|---|---|---|
| – | | €22,688.5 | – | | €11,377.7 |
| – | Total | €42,045.4 | – | Total | €22,451.1 |
Greece is also the largest trade partner of Cyprus (exports 23.0%, imports 21.6%)[158] and the largest import partner of the Republic of Macedonia (19.0%).[159]
| Imports | Exports | ||||||
|---|---|---|---|---|---|---|---|
| Rank | Origin | Value (€ mil) |
Value (% of total) | Rank | Destination | Value (€ mil) |
Value (% of total) |
| 1 | 5,967.20132 | 12.6 | 1 | 2,940.25203 | 10.8 | ||
| 2 | 4,381.92656 | 9.2 | 2 | 2,033.77413 | 7.5 | ||
| 3 | 3,668.88622 | 7.7 | 3 | 1,687.03947 | 6.2 | ||
| 4 | 2,674.00587 | 5.6 | 4 | 1,493.75355 | 5.5 | ||
| 5 | 2,278.03883 | 4.8 | 5 | 1,319.28598 | 4.8 | ||
| 6 | 2,198.57126 | 4.6 | 6 | 1,024.73686 | 3.8 | ||
| 7 | 1,978.48460 | 4.2 | 7 | 822.74077 | 3 | ||
| #α | OECD | 23,849.94650 | 50.2 | #α | OECD | 13,276.48107 | 48.8 |
| #β | G7 | 11,933.75417 | 25.1 | #β | G7 | 6,380.86705 | 23.4 |
| #γ | BRICS | 8,682.10265 | 18.3 | #ε | BRICS | 1,014.17146 | 3.7 |
| #δ | BRIC | 8,636.02946 | 18.2 | #ζ | BRIC | 977.76016 | 3.6 |
| #ε | OPEC | 8,090.76972 | 17 | #γ | OPEC | 2,158.60420 | 7.9 |
| #ζ | NAFTA | 751.80608 | 1.6 | #δ | NAFTA | 1,215.70257 | 4.5 |
| #a | 21,164.89314 | 44.5 | #a | 11,512.31990 | 42.3 | ||
| #b | 17,794.19344 | 37.4 | #b | 7,234.83595 | 26.6 | ||
| #3 | Africa | 2,787.39502 | 5.9 | #3 | Africa | 1,999.46534 | 7.3 |
| #4 | America | 1,451.15136 | 3.1 | #4 | America | 1,384.04068 | 5.1 |
| #2 | Asia | 14,378.02705 | 30.2 | #2 | Asia | 6,933.51200 | 25.5 |
| #1 | Europe | 28,708.38148 | 60.4 | #1 | Europe | 14,797.20641 | 54.4 |
| #5 | Oceania | 71.70603 | 0.2 | #5 | Oceania | 169.24085 | 0.6 |
| # | World | 47,537.63847 | 100 | # | World | 27,211.06362 | 100 |
| the International Organisations or Country Groups list and ranking presented above (i.e. #greek_letters and/or #latin_letters), is not indicative of the whole picture of Greece's trade; this is instead only an incomplete selection of some major and well known such Organisations and Groups; rounding errors possibly present | |||||||
Transport

As of 2012, Greece had a total of 82 airports,[2] of which 67 were paved and six had runways longer than 3,047 meters.[2] Of these airports, two are classified as "international" by the Hellenic Civil Aviation Authority,[160] but 15 offer international services.[160] Additionally Greece has 9 heliports.[2] Greece does not have a flag carrier, but the country’s airline industry is dominated by Aegean Airlines and its subsidiary Olympic Air.
Between 1975 and 2009, Olympic Airways (known after 2003 as Olympic Airlines) was the country’s state-owned flag carrier, but financial problems led to its privatization and relaunch as Olympic Air in 2009. Both Aegean Airlines and Olympic Air have won awards for their services; in 2009 and 2011, Aegean Airlines was awarded the "Best regional airline in Europe" award by Skytrax,[161] and also has two gold and one silver awards by the ERA,[161] while Olympic Air holds one silver ERA award for "Airline of the Year"[162] as well as a "Condé Nast Traveller 2011 Readers Choice Awards: Top Domestic Airline" award.[163]
The Greek road network is made up of 116,711 km of roads,[2] of which 948 km are highways, ranking 38th worldwide.[2] Since the entry of Greece to the European Community (now the European Union), a number of important projects (such as the Egnatia Odos and the Attiki Odos) have been co-funded by the organization, helping to upgrade the country's road network. In 2007, Greece ranked 8th in the European Union in goods transported by road at almost 500 million tons.
Greece's rail network is estimated to be at 2,548 km.[2] Rail transport in Greece is operated by TrainOSE, a subsidiary of the Hellenic Railways Organization (OSE). Most of the country's network is standard gauge (1,565 km),[2] while the country also has 983 km of narrow gauge.[2] A total of 764 km of rail are electrified.[2] Greece has rail connections with Bulgaria, the Republic of Macedonia and Turkey. A total of three suburban railway systems (Proastiakos) are in operation (in Athens, Thessaloniki and Patras), while one metro system, the Athens Metro, is operational in Athens with another, the Thessaloniki Metro, under construction.
According to Eurostat, Greece's largest port by tons of goods transported in 2010 is the port of Aghioi Theodoroi, with 17.38 million tons.[164] The Port of Thessaloniki comes second with 15.8 million tons,[164] followed by the Port of Piraeus, with 13.2 million tons,[164] and the port of Eleusis, with 12.37 million tons.[164] The total number of goods transported through Greece in 2010 amounted to 124.38 million tons,[164] a considerable drop from the 164.3 million tons transported through the country in 2007.[164] Since then, Piraeus has grown to become the Mediterranean's third-largest port thanks to heavy investment by Chinese logistics giant COSCO. In 2013, Piraeus was declared the fastest-growing port in the world.[165]
In 2010 Piraeus handled 513,319 TEUs,[166] followed by Thessaloniki, which handled 273,282 TEUs.[167] In the same year, 83.9 million people passed through Greece's ports,[168] 12.7 million through the port of Paloukia in Salamis,[168] another 12.7 through the port of Perama,[168] 9.5 million through Piraeus[168] and 2.7 million through Igoumenitsa.[168] In 2013, Piraeus handled a record 3.16 million TEUs, the third-largest figure in the Mediterranean, of which 2.52 million were transported through Pier II, owned by COSCO and 644,000 were transported through Pier I, owned by the Greek state.
Energy

Energy production in Greece is dominated by the Public Power Corporation (known mostly by its acronym ΔΕΗ, or in English DEI). In 2009 DEI supplied for 85.6% of all energy demand in Greece,[169] while the number fell to 77.3% in 2010.[169] Almost half (48%) of DEI's power output is generated using lignite, a drop from the 51.6% in 2009.[169] Another 12% comes from Hydroelectric power plants[170] and another 20% from natural gas.[170] Between 2009 and 2010, independent companies' energy production increased by 56%,[169] from 2,709 Gigawatt hour in 2009 to 4,232 GWh in 2010.[169]
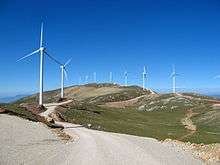
In 2008 renewable energy accounted for 8% of the country's total energy consumption,[171] a rise from the 7.2% it accounted for in 2006,[171] but still below the EU average of 10% in 2008.[171] 10% of the country's renewable energy comes from solar power,[122] while most comes from biomass and waste recycling.[122] In line with the European Commission's Directive on Renewable Energy, Greece aims to get 18% of its energy from renewable sources by 2020.[172] In 2013 and for several months, Greece produced more than 20% of its electricity from renewable energy sources and hydroelectric power plants.[173] Greece currently does not have any nuclear power plants in operation, however in 2009 the Academy of Athens suggested that research in the possibility of Greek nuclear power plants begin.[174]
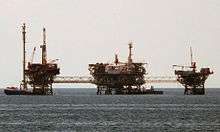
Greece had 10 million barrels of proven oil reserves as of 1 January 2012.[2] Hellenic Petroleum is the country's largest oil company, followed by Motor Oil Hellas. Greece's oil production stands at 1,751 barrels per day (bbl/d), ranked 95th worldwide,[2] while it exports 19,960 bbl/d, ranked 53rd,[2] and imports 355,600 bbl/d, ranked 25th.[2]
In 2011 the Greek government approved the start of oil exploration and drilling in three locations within Greece,[175] with an estimated output of 250 to 300 million barrels over the next 15 to 20 years.[175] The estimated output in euros of the three deposits is €25 billion over a 15-year period,[175] of which €13–€14 billion will enter state coffers.[175] Greece's dispute with Turkey over the Aegean poses substantial obstacles to oil exploration in the Aegean Sea.
In addition to the above, Greece is also to start oil and gas exploration in other locations in the Ionian Sea, as well as the Libyan Sea, within the Greek exclusive economic zone, south of Crete.[176][177] The Ministry of the Environment, Energy and Climate Change announced that there was interest from various countries (including Norway and the United States) in exploration,[177] and the first results regarding the amount of oil and gas in these locations were expected in the summer of 2012.[177] In November 2012, a report published by Deutsche Bank estimated the value of natural gas reserves south of Crete at €427 billion.[178]
A number of oil and gas pipelines are currently under construction or under planning in the country. Such projects include the Interconnector Turkey-Greece-Italy (ITGI) and South Stream gas pipelines.[170]
Taxation and tax evasion

Greece has a tiered tax system based on progressive taxation. Greek law recognizes six categories of taxable income:[179] immovable property, movable property (investment), income from agriculture, business, employment, and income from professional activities. Greece's personal income tax rate, until recently, ranged from 0% for annual incomes below €12,000[179] to 45% for annual incomes over €100,000.[179] Under the new 2010 tax reform, tax exemptions have been abolished.[179]
Also under the new austerity measures and among other changes, the personal income tax-free ceiling has been reduced to €5,000 per annum[180] while further future changes, for example abolition of this ceiling, are already being planned.[181]
Greece's corporate tax dropped from 40% in 2000[179] to 20% in 2010.[179] For 2011 only, corporate tax will be at 24%.[179] Value added tax (VAT) has gone up in 2010 compared to 2009: 23% as opposed to 19%.[179]
The lowest VAT possible is 6.5% (previously 4.5%)[179] for newspapers, periodicals and cultural event tickets, while a tax rate of 13% (from 9%)[179] applies to certain service sector professions. Additionally, both employers and employees have to pay social contribution taxes, which apply at a rate of 16%[179] for white collar jobs and 19.5%[179] for blue collar jobs, and are used for social insurance.
The Ministry of Finance expected tax revenues for 2012 to be €52.7 billion (€23.6 billion in direct taxes and €29.1 billion in indirect taxes),[182] an increase of 5.8% from 2011.[182] In 2012, the government was expected to have considerably higher tax revenues than in 2011 on a number of sectors, primarily housing (an increase of 217.5% from 2011).[182]
Tax evasion
Greece suffers from very high levels of tax evasion. In the last quarter of 2005, tax evasion reached 49%,[183] while in January 2006 it fell to 41.6%.[183] A study by researchers from the University of Chicago concluded that tax evasion in 2009 by self-employed professionals alone in Greece (accountants, dentists, lawyers, doctors, personal tutors and independent financial advisers) was €28 billion or 31% of the budget deficit that year.[184]
The Tax Justice Network has said that there are over €20 billion in Swiss bank accounts held by Greeks.[185] The former Finance Minister of Greece, Evangelos Venizelos, was quoted as saying, "Around 15,000 individuals and companies owe the taxman 37 billion euros".[186] Additionally, the TJN puts the number of Greek-owned off-shore companies to over 10,000.[187]
Following similar actions by the United Kingdom and Germany, the Greek government is in talks with Switzerland in order to tax bank accounts in Switzerland owned by Greek citizens.[188] The Ministry of Finance has revealed that Greek Swiss bank account holders will either have to pay a tax or reveal information such as the identity of the bank account holder to the Greek internal revenue services.[188] The Greek and Swiss governments were to reach a deal on the matter by the end of 2011.[188]
Wealth and standards of living
National and regional GDP
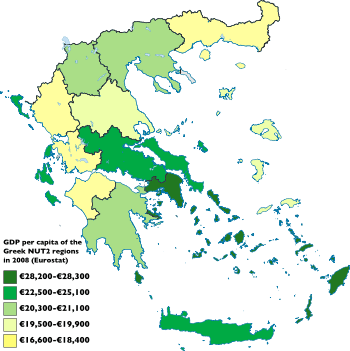
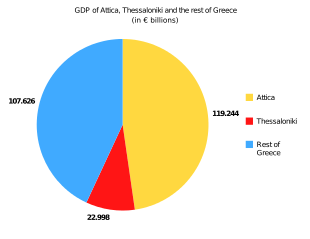
Greece's most economically important regions are Attica, which contributed €85.579 billion to the economy in 2014, and Central Macedonia, which contributed €23.859 billion.[189] The smallest regional economies were those of the North Aegean (€2.545 billion) and Ionian Islands (€3.137 billion).[189]
In terms of GDP per capita, Attica (€22,200) far outranks any other Greek region.[189] The poorest regions in 2014 were Eastern Macedonia and Thrace (€11,200) and Epirus (€11,400).[189] At the national level, GDP per capita in 2014 was €16,200.[189]
| Rank | Region | GDP (€, billions) | GDP (% of total) |
GDP annual growth (%) | GDP per capita (€) |
GDP per capita (PPS, % EU average) |
|---|---|---|---|---|---|---|
| 1 | Attica | 85.579 | 48.20 | −1.72 | 22,200 | 99 |
| 2 | Central Macedonia | 23.859 | 13.44 | −2.90 | 12,500 | 56 |
| 3 | Thessaly | 9.085 | 5.12 | −4.25 | 12,300 | 55 |
| 4 | Crete | 8.934 | 5.03 | −0.18 | 14,100 | 63 |
| 5 | Western Greece | 8.181 | 4.61 | −5.87 | 12,100 | 54 |
| 6 | Central Greece | 7.734 | 4.36 | −3.00 | 13,800 | 61 |
| 7 | Peloponnese | 7.611 | 4.29 | −5.23 | 13,000 | 58 |
| 8 | Eastern Macedonia and Thrace | 6.820 | 3.84 | −8.04 | 11,200 | 50 |
| 9 | South Aegean | 6.045 | 3.40 | +0.92 | 18,000 | 80 |
| 10 | Western Macedonia | 4.125 | 2.32 | +3.83 | 14,800 | 66 |
| 11 | Epirus | 3.904 | 2.20 | −9.52 | 11,400 | 51 |
| 12 | Ionian Islands | 3.137 | 1.77 | −3.39 | 15,100 | 67 |
| 13 | North Aegean | 2.545 | 1.43 | −6.19 | 12,800 | 57 |
| – | Greece | 177.559 | 100 | −2.67 | 16,200 | 72 |
| – | European Union | 13,959.739 | 7862.03 | 3.27% | 27,500 | 100 |
Welfare state
Greece is a welfare state which provides a number of social services such as quasi-universal health care and pensions. In the 2012 budget, expenses for the welfare state (excluding education) stand at an estimated €22.487 billion[182] (€6.577 billion for pensions[182] and €15.910 billion for social security and health care expenses),[182] or 31.9% of the all state expenses.[182]
Largest companies by revenue 2014
According to the Forbes Global 2000 index, Greece's largest publicly traded companies as of May 2014 are:
| Rank | Company | Revenues (€ billion) | Profit (€ billion) | Assets (€ billion) | Market value (€ billion) | |
|---|---|---|---|---|---|---|
| 1 | ELPE | 28.5 | 1.6 | 7.8 | 13.5 | |
| 2 | Motor Oil | 26.8 | 1.3 | 6.8 | 10.2 | |
| 3 | Aegean Oil | 17.7 | 0.9 | 6.0 | 7.5 | |
| 4 | National Bank of Greece | 8.9 | 4.5 | 131.2 | 23.2 | |
| 5 | Coca Cola HBC | 6.5 | 0.3 | - | 8.2 | |
| 6 | OTE | 6.0 | 0.7 | 9.3 | 10.8 | |
| 7 | DEH | 6.0 | 0.7 | - | 9.8 | |
| 8 | Ceres Hellenic Shipping | 5.9 | 1 | - | 10.0 | |
| 9 | Avin International | 5.7 | 0.7 | - | 6.3 | |
| 10 | OPAP | 5.6 | 1 | - | 8.9 | |
| 11 | DryShips Inc | 5.5 | 0.5 | 5.5 | 4.5 | |
| 12 | Bank of Greece | 5.4 | 0.3 | 210.7 | 12.4 | |
| 13 | Piraeus Bank | 5.4 | 3.6 | 92.4 | 18.6 | |
| 14 | Alpha Bank | 5.2 | 1.5 | 90.7 | 13.8 | |
| 15 | Eurobank | 4.6 | 0.4 | 76.9 | 7.5 | |
| 16 | Viohalko | 3.9 | 0.08 | - | 2.0 | |
| 17 | Alfa-Beta Vassilopoulos | 3.6 | 0.31 | - | 4.2 | |
| 18 | Ellaktor | 3.1 | 0.85 | - | 6.8 | |
| 19 | ANEK Lines | 2.6 | 0.3 | - | 3.2 | |
| 20 | Titan Cement | 2.1 | 0.21 | 7.4 | 9.8 | |
| 21 | Intralot | 2.1 | 0.17 | - | 2.8 | |
| 22 | Minoan Lines | 1.9 | 0.11 | - | 3.3 | |
| 23 | Carrefour Marinopoulos | 1.7 | 0.13 | - | 1.0 | |
| 24 | Sklavenitis | 1.1 | 0.09 | - | 0.6 | |
| 25 | Aegean Airlines | 1 | 0.1 | - | 1.9 |
Labour force
Working hours
In 2012, the average Greek worker worked for 2034 hours annually; this figure was the third highest among the OECD countries.[191]
- Working hours per year per worker 2012
- [191] Greece working hours per year per worker 2012
Currency
Between 1832 and 2002 the currency of Greece was the drachma. After signing the Maastricht Treaty, Greece applied to join the eurozone. The two main convergence criteria were a maximum budget deficit of 3% of GDP and a declining public debt if it stood above 60% of GDP. Greece met the criteria as shown in its 1999 annual public account. On 1 January 2001, Greece joined the eurozone, with the adoption of the euro at the fixed exchange rate ₯340.75 to €1. However, in 2001 the euro only existed electronically, so the physical exchange from drachma to euro only took place on 1 January 2002. This was followed by a ten-year period for eligible exchange of drachma to euro, which ended on 1 March 2012.[192]
Prior to the adoption of the euro, 64% of Greek citizens viewed the new currency positively,[193] but in February 2005 this figure fell to 26% and by June 2005 it fell further to 20%.[193] Since 2010 the figure has risen again, and a survey in September 2011 showed that 63% of Greek citizens viewed of the euro positively.[193]
Charts gallery
-

Greek social expenditures as a percentage of GDP (1998–2009)
-

Distribution of income in Greece over the years
-

Distribution of total income in Greece over the years
-

Employment and unemployment in Greece since 2004
-
.png)
Greek GDP, Debt (various) and Budget Deficit over the years
-
.png)
Domestic bank deposits of Greek households by type of account
-
Domestic lending by domestic banks in Greece since 1980
-

House Price Index, Greece (including flats)
Unemployment rate
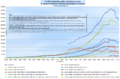
IMF's forecast said that Greece's unemployment rate would hit the highest 14.8 percent in 2012 and decrease to 14.1 in 2014. [194] But in fact, the Greek economy suffered a prolonged high unemployemnt.[195] The unemployment figure was between 9 per cent and 11 per cent in 2009, and it soared to 28 per cent in 2013. In 2015, Greece's jobless rate is around 24 per cent. It is thought that Greece's potential output has been eroded by this prolonged massive unemployment due to the associated hysteresis effects.[195]
Poverty
Greece has been hit hard with recession and the austerity measures that have been put in place and poverty has increased. Those living in extreme poverty rose to 15% in 2015, up from 8.9% in 2011, and a huge increase from 2009 when it wasn’t more than 2.2%.[196] Those people at risk for poverty or social exclusion was one in three or 35.7%.[197] The rate among children 0-17 is 17.6% and for young people 18-29 the rate is 24.4%.[196] With unemployment on the rise, those without jobs are at the highest risk at 70-75%, up from less than 50% in 2011.[196] With jobs harder and harder to come by, a quarter of the population is out of work, and for people under 25 the rate is 50%. In some harder hit areas of western Greece, the younger generation unemployment rate is more than 60%. When people are out of work for more than two years, they lose their health insurance, further increasing the problems of those in poverty. When younger people are out of work, they rely on the older generations of their families to provide for them to get them through the hard times. However, long term unemployment across the country causes pension funds to decrease because they are getting less money from the working population, so those older generations are getting less money to provide for the younger generations and their entire families, putting more of them in poverty. Many aspects of the economic problems add to the problem. The Greek people have continued job loss and wage cuts, as well as deep cuts in workers compensation and social welfare benefits. For those who are working, their wages have dropped. From 2008 to 2013, Greeks have become 40% poorer on average, and in 2014 saw their disposable household income drop below 2003 levels.[198] The Economic Survey of Greece 2016 shows optimism in a stronger recovery in 2017 by using things like the reforms in place and outside investment in jobs to help change the course of the high levels of poverty.

References
- 1 2 3 "Greece, country profile". European Union.
- 1 2 3 4 5 6 7 8 9 10 11 12 13 14 15 16 17 18 19 20 21 22 23 24 25 "CIA World Factbook: Greece, country profile". CIA.
- 1 2 3 4 5 "Report for Selected Countries and Subjects". World Economic Outlook Database, October 2016. Washington, D.C.: International Monetary Fund. 4 October 2016. Retrieved 26 October 2016.
- 1 2 "Gross domestic product 2015" (PDF). World Bank. 11 October 2016. Retrieved 26 October 2016.
- 1 2 "Gross domestic product 2015, PPP" (PDF). World Bank. 11 October 2016. Retrieved 26 October 2016.
- 1 2 "QUARTERLY NATIONAL ACCOUNTS: 3rd Quarter 2016 (Provisional data)" (PDF). Piraeus: Hellenic Statistical Authority. 29 November 2016. Retrieved 29 November 2016.
- ↑ "CONSUMER PRICE INDEX: October 2016" (DOC). Piraeus: Hellenic Statistical Authority. 10 November 2016. Retrieved 14 November 2016.
- ↑ "Risk of poverty: 2015 SURVEY ON INCOME AND LIVING CONDITIONS (Income reference period 2014)" (PDF). Piraeus: Hellenic Statistical Authority. 23 June 2016. Retrieved 23 June 2016.
- ↑ "People at risk of poverty or social exclusion by age and sex". Luxembourg: Eurostat. 7 June 2016. Retrieved 23 June 2016.
- ↑ "Income inequality: 2015 SURVEY ON INCOME AND LIVING CONDITIONS (Income reference period 2014)" (PDF). Piraeus: Hellenic Statistical Authority. 23 June 2016. Retrieved 23 June 2016.
- ↑ "Gini coefficient of equivalised disposable income (source: SILC)". Luxembourg: Eurostat. 7 June 2016. Retrieved 23 June 2016.
- 1 2 "LABOUR FORCE SURVEY: August 2016" (PDF). Piraeus: Hellenic Statistical Authority. 10 November 2016. Retrieved 14 November 2016.
- ↑ "Average annual wages, OECD Stats". OECD. Retrieved 5 March 2015.
- 1 2 "Mean and median income by age and sex (ilc_di03)". Eurostat. Retrieved 5 March 2015.
- 1 2 3 4 5 "ITC Trade Map: List of exporters for Sea Transport, i.e. country ranking in value of exports (services; data code 206; yearly times series)". WTO-ITC. Retrieved 22 May 2013.
- ↑ Sources on Greek shipping:
- OECD (15 March 2010). OECD Environmental Performance Reviews OECD Environmental Performance Reviews: Greece 2009. OECD Publishing. p. 256. ISBN 978-92-64-06083-8. Retrieved 14 April 2013.
The Greek shipping industry is well-organised and influential, both domestically and internationally, ... The Hellenic Chamber of Shipping, the world's largest association of ship owners, is the industry's official advisor to the government on all ...
- Christos C. Frangos (2009). Proceedings of the 2nd International Conference: Quantitative and Qualitative Methodologies in the Economic and Administrative Sciences. Christos Frangos. p. 404. ISBN 978-960-98739-0-1. Retrieved 14 April 2013.
Finally, the most important Greek industry, shipping, is making huge gains establishing its prowess in the global market, being the biggest in the world, makes Greece a real global player. Shipping, which contributed by 4,5% to the country's ...
- Peter Haggett (2002). Encyclopedia of World Geography: Italy. Marshall Cavendish. p. 1470. ISBN 978-0-7614-7300-8. Retrieved 14 April 2013.
The Greek shipping industry, one of the largest in the world, accounts for more than 30 percent of the income derived from services. It is exempt from government control, unlike other
- Ibpus.com; Int'l Business Publications, USA (1 January 2012). Business in Greece for Everyone: Practical Information and Contacts for Success. Int'l Business Publications. p. 42. ISBN 978-1-4387-7220-2. Retrieved 14 April 2013.
Greek shipping and List of ports in Greece The shipping industry is a key element of Greek economic activity dating back to ancient times. Today, shipping is one of the country's most important industries. It accounts for 4.5% of ...
- Jill Dubois; Xenia Skoura; Olga Gratsaniti (2003). Greece. Marshall Cavendish. p. 42. ISBN 978-0-7614-1499-5. Retrieved 14 April 2013.
Greek ships make up 70 percent of the European Union's total merchant fleet. Greece has a large shipbuilding and ship refitting industry. Its six shipyards near Piraeus are among the biggest in Europe. As Greek ships primarily transport ...
- Antōnios M. Antapasēs; Lia I. Athanassiou; Erik Røsæg (2009). Competition and regulation in shipping and shipping related industries. Martinus Nijhoff Publishers. p. 273. ISBN 978-90-04-17395-8. Retrieved 14 April 2013.
which is a powerful tool of tax policy for the shipping industry in Greece.25 4.
- Tullio Treves; Pineshi (1997). The Law of the Sea: The European Union and Its Member States. Martinus Nijhoff Publishers. pp. 239–240. ISBN 978-90-411-0326-0. Retrieved 14 April 2013.
The Shipping Industry The shipping industry (the transport of persons and goods by sea) constitutes one of the most important factors for the Greek society and economy
- Athanasios A. Pallis (2007). Maritime Transport: The Greek Paradigm. Elsevier. p. 175. ISBN 978-0-7623-1449-2. Retrieved 14 April 2013.
Since Greek shipping ranks on top of world shipping business in terms of tonnage and volume, it is of interest to have a closer look at Greek shipping finance.
- OECD (15 March 2010). OECD Environmental Performance Reviews OECD Environmental Performance Reviews: Greece 2009. OECD Publishing. p. 256. ISBN 978-92-64-06083-8. Retrieved 14 April 2013.
- ↑ "Ease of Doing Business in Greece". Doing Business 2017. World Bank Group. Retrieved 26 October 2016.
- 1 2 3 4 "COMMERCIAL TRANSACTIONS OF GREECE : August 2016 ( Provisional Data )" (PDF). Piraeus: Hellenic Statistical Authority. 7 October 2016. Retrieved 7 October 2016.
- 1 2 3 "ITC Trade Map Database". WTO-ITC.
- ↑ "External Debt". Bank of Greece. Retrieved 26 October 2016.
- ↑ "International Investment Position". Bank of Greece. Retrieved 26 October 2016.
- ↑ "Government debt fell to 91.2% of GDP in euro area" (PDF). Luxembourg: Eurostat. 24 October 2016. Retrieved 26 October 2016.
- 1 2 3 "Provision of deficit and debt data for 2015 - second notification" (PDF). Luxembourg: Eurostat. 21 October 2016. Retrieved 26 October 2016.
- ↑ "DBRS Upgrades Hellenic Republic to CCC (High)". Toronto: DBRS. 11 December 2015. Retrieved 2 March 2016.
- ↑ "Fitch Upgrades Greece to 'CCC'". London: Fitch Ratings. 18 August 2015. Retrieved 19 August 2015.
- ↑ "Moody's confirms Greece's government bond rating at Caa3; Outlook stable". London: Moody's Investors Service. 25 September 2015. Retrieved 26 October 2015.
- ↑ "S&P upgrades Greece by 1 notch to B-, outlook stable". The Washington Post. Associated Press. 22 January 2016. Retrieved 27 January 2016.
- ↑ "Gross domestic product at market prices". Luxembourg: Eurostat. 21 July 2016. Retrieved 25 July 2016.
- ↑ "UNWTO Tourism Highlights, 2013 Edition" (PDF). Madrid: World Tourism Organization. June 2013. Archived from the original (PDF) on 30 October 2013. Retrieved 14 December 2013.
- 1 2 3 4 "Review of Maritime Transport 2013" (PDF). Geneva: United Nations Conference on Trade and Development. Retrieved 14 December 2013.
- ↑ Archived 8 November 2014 at the Wayback Machine.
- ↑ "Albania Eyes New Markets as Greek Crisis Hits Home". Balkan Insight. 11 July 2012. Retrieved 16 November 2014.
Greece is the Balkan region's largest economy and has been an important investor in Southeast Europe over the past decade.
- ↑ Keridis, Dimitris (3 March 2006), Greece and the Balkans: From Stabilization to Growth (lecture), Montreal, QC, CA: Hellenic Studies Unit at Concordia University,
Greece has a larger economy than all the Balkan countries combined. Greece is also an important regional investor
- ↑ "Greece was the biggest foreign investor in Albania during 2013". invest-in-albania.org.
- 1 2 Imogen Bell (2002). Central and South-Eastern Europe: 2003. Routledge. p. 282. ISBN 978-1-85743-136-0. Retrieved 27 May 2013.
Greece has become the largest investor into Macedonia (FYRM), while Greek companies such as OTE have also developed strong presences in former Yugoslavia and other Balkan countries.
- ↑ Mustafa Aydin; Kostas Ifantis (28 February 2004). Turkish-Greek Relations: The Security Dilemma in the Aegean. Taylor & Francis. pp. 266–267. ISBN 978-0-203-50191-7. Retrieved 27 May 2013.
second largest investor of foreign capital in Albania, and the third largest foreign investor in Bulgaria. Greece is the most important trading partner of the Former Yugoslav Republic of Macedonia.
- ↑ Wayne C. Thompson (9 August 2012). Western Europe 2012. Stryker Post. p. 283. ISBN 978-1-61048-898-3. Retrieved 27 May 2013.
Greeks are already among the three largest investors in Bulgaria, Romania and Serbia, and overall Greek investment in the ... Its banking sector represents 16% of banking activities in the region, and Greek banks open a new branch in a Balkan country almost weekly.
- ↑ "WEO Groups and Aggregates Information". World Economic Outlook Database. Washington, D.C.: International Monetary Fund. 8 April 2014. Retrieved 13 April 2014.
- ↑ "Country and Lending Groups". Washington, D.C.: World Bank. Retrieved 23 October 2013.
- ↑ "Fixed Euro conversion rates". European Central Bank. Retrieved 23 February 2012.
- ↑ "Singapore takes third spot on Globalization Index 2011". Ernst & Young. 8 February 2012. Retrieved 29 February 2012.
- 1 2 3 4 5 Graham T. Allison; Kalypso Nicolaidis. "The Greek paradox: promise vs. performance". Retrieved 1 March 2012.
- 1 2 "GDP growth rate". World Development Indicators. Google Public Data Explorer. 12 January 2016. Retrieved 13 February 2016.
- 1 2 "Real GDP growth rate - volume". Luxembourg: Eurostat. Retrieved 17 November 2015.
- ↑ "Provision of deficit and debt data for 2014 - second notification" (PDF). Luxembourg: Eurostat. 21 October 2015. Retrieved 21 April 2016.
- ↑ "Euro area government debt up to 92% of GDP" (PDF). Luxembourg: Eurostat. 22 July 2013. Retrieved 20 June 2015.
- 1 2 Bensasson, Marcus (4 November 2014). "Greece exited recession in second quarter, says EU Commission". Kathimerini. Retrieved 4 November 2014.
- ↑ "GDP up by 0.3% in the euro area and by 0.4% in the EU28" (PDF). Luxembourg: Eurostat. 15 November 2016. Retrieved 16 November 2016.
- ↑ "Eurozone recovery falters as Greece slips back into recession". The Guardian. London. 12 February 2016. Retrieved 8 March 2016.
- ↑ K. Kostis; S. Petmezas (2006). Η Ανάπτυξη της Ελληνικής οικονομίας τον 19ο αιώνα [Development of the Greek economy in the 19th century]. Athens: Alexandria Publications.
- ↑ G. Anastasopoulos (1946). Ιστορία της Ελληνικής Βιομηχανίας 1840–1940 [History of Greek Industry 1840–1940]. Athens: Elliniki Ekdotiki Etairia.
- ↑ L.S. Skartsis (2012). Greek Vehicle & Machine Manufacturers 1800 to present: A Pictorial History (eBook). Marathon.
- ↑ "A Greek Odyssey: 1821–2201". Ekathimerini.com. Retrieved 19 May 2011.
- ↑ Paul Bairoch, Europe's GNP 1800–1975, Journal of European Economic History, 5, pgs. 273–340 (1976)
- ↑ Angus Maddison, Monitoring the World Economy 1820–1992, OECD (1995)
- ↑ Eurostat, including updated data since 1980 and data released in April 2008
- ↑ "FIELD LISTING:: GDP – PER CAPITA (PPP)". The World Factbook. Central Intelligence Agency. Retrieved 13 April 2013.
- ↑ "Table 1: Human Development Index and its components". Human Development Report 2014. United Nations Development Programme. Retrieved 19 June 2015.
- 1 2 "GDP per capita varied by one to six across the Member States in 2011" (PDF). Luxembourg: Eurostat. 13 December 2012. Retrieved 19 June 2015.
- 1 2 "Consumption per capita varied by almost one to three across EU Member States" (PDF). Luxembourg: Eurostat. 15 June 2016. Retrieved 15 June 2016.
- ↑ "Premium content". The Economist. 9 December 2008. Retrieved 28 April 2010.
- ↑ Greek taxpayers sense evasion crackdown Financial Times
- ↑ "Corruption Perceptions Index 2015". Berlin: Transparency International. 27 January 2016. Retrieved 27 January 2016.
- ↑ "Country Rankings". 2016 Index of Economic Freedom. Washington, D.C.: The Heritage Foundation. Retrieved 15 June 2016.
- ↑ "The Global Competitiveness Report 2016–2017". Geneva: World Economic Forum. 28 September 2016. Retrieved 29 September 2016.
- ↑ "Report for Selected Countries and Subjects". World Economic Outlook Database. Washington, D.C.: International Monetary Fund. 8 April 2014. Retrieved 13 April 2014.
- ↑ "Provision of deficit and debt data for 2012 - second notification" (PDF). Luxembourg: Eurostat. 21 October 2013. Retrieved 21 April 2016.
- ↑ Charter, David. Storm over bailout of Greece, EU's most ailing economy. Time Online: Brussels, 2010
- ↑ Faiola, Anthony (10 February 2010). "'Greece's economic crisis could signal trouble for its neighbors'". The Washington Post. Retrieved 19 May 2011.
- ↑ "Βουλή: "Ναι" στη σύσταση εξεταστικής για το έλλειμμα το 2009" [Parliament: "Yes" to the creation of a committee to investigate the deficit of 2009]. Skai TV. Retrieved 23 February 2012.
- ↑ "Υπόθεση ΕΛΣΤΑΤ: Για ποινικοποίηση της αλήθειας μίλησε ο Γ. Παπακωνσταντίνου" [ELSTAT case: Criminalization of the truth, says G. Papakonstantinou]. Skai TV. Retrieved 23 February 2012.
According to the referral of the case, 'from the entire collection of evidence, and especially from witnesses, there exists proof in relation to actions deserving of criminal punishment and with persons who held offices in the previous government of Greece' and from most interviews with witnesses it is noted that 'they speak of an artificial and arbitrary swelling of the national deficit in 2009 and for the liability of the -then- Prime Minister, members of the then-government and then-officials of the Ministry of Finance'
- ↑ "Average annual hours actually worked per worker" (database). OECD. Retrieved 21 May 2013.
- ↑ Groningen Growth; Development Centre; Pegasus Interactive (6 October 2008). "v4.ethnos.gr – Oι αργίες των Eλλήνων – ειδησεις, κοινωνια, ειδικες δημοσιευσεις". Ethnos.gr. Retrieved 6 January 2009.
- ↑ "The Production Index in Industry recorded a decline of 8.0% in March 2011 compared with March 2010." (PDF). statistics.gr. Retrieved 25 May 2011.
- ↑ "Building Activity Survey: January 2011" (PDF). statistics.gr. Retrieved 25 May 2011.
- ↑ "The Turnover Index in Retail Trade, excluding automotive fuel, recorded a fall of 9.0% in February 2011 compared with February 2010." (PDF). statistics.gr. Retrieved 25 May 2011.
- ↑ "LABOUR FORCE SURVEY: June 2013" (PDF). Piraeus: Hellenic Statistical Authority. 12 September 2013. Retrieved 12 September 2013.
- ↑ "LABOUR FORCE SURVEY: 2nd quarter 2009" (PDF). National Statistical Service of Greece. 17 September 2009. Retrieved 18 October 2011.
- ↑ "LABOUR FORCE SURVEY: 3rd quarter 2009" (PDF). National Statistical Service of Greece. 17 December 2009. Retrieved 18 October 2011.
- ↑ "LABOUR FORCE SURVEY: May 2013" (PDF). Piraeus: Hellenic Statistical Authority. 8 August 2013. Retrieved 11 August 2013.
- ↑ "Report by Eurostat on the revision of the Greek government deficit and debt figures" (PDF). Luxembourg: Eurostat. 22 November 2004. Retrieved 20 June 2015.
- ↑ Simitis, Costas; Stournaras, Yannis (27 April 2012). "Greece did not cause the euro crisis". The Guardian. Retrieved 16 November 2014.
- ↑ Story, Louise; Thomas Jr, Landon; Schwartz, Nelson D. (14 February 2010). "Wall St. Helped to Mask Debt Fueling Europe's Crisis". New York Times.
Steil, Benn (21 February 2002). "Enron and Italy: Parallels between Rome's efforts to qualify for euro entry and the financial chicanery in Texas". Council on Foreign Relations.
Piga, Gustavo (2001). "Derivatives and Public Debt Management" (PDF). International Securities Market Association (ISMA) in cooperation with the Council on Foreign Relations. - ↑ OECD Economic Surveys (Greece), Vol. 2005/12, September 2005, p.47. OECD Publishing. 2005-09-22. ISBN 9789264011748. Retrieved 25 September 2011.
- ↑ "Finmin says fiscal data saga has ended in wake of EU report". 8 December 2004.
- ↑ "Goldman bet against Entire European Nations". Washingtons Blog. 16 July 2011.
- ↑ Tim Harford (9 September 2011). "Look out for No. 1". Financial Times.
- ↑ Rauch, Bernhard; Max, Göttsche; Brähler, Gernot; Engel, Stefan (2011). "Fact and Fiction in EU-Governmental Economic Data". German Economic Review. 12 (3): 244–254. doi:10.1111/j.1468-0475.2011.00542.x.
- ↑ Lynn, Matthew (2011). Bust: Greece, the Euro and the Sovereign Debt Crisis. Hobeken, New Jersey: Bloomberg Press. ISBN 978-0-470-97611-1.
- ↑ "Greece's Sovereign-Debt Crunch: A Very European Crisis". The Economist. 4 February 2010. Retrieved 2 May 2010.
- ↑ "Rehn: No Other State Will Need a Bail-Out". EU Observer. Retrieved 6 May 2010.
- 1 2 3 "Greece Paid Goldman $300 Million To Help It Hide Its Ballooning Debts". Business Insider. Archived from the original on 2010-03-05. Retrieved 6 May 2010.
- ↑ LOUISE STORY; LANDON THOMAS Jr; NELSON D. SCHWARTZ (13 February 2010). "Global Business: Wall St. Helped to Mask Debt Fueling Europe's Crisis". The New York Times.
In dozens of deals across the Continent, banks provided cash upfront in return for government payments in the future, with those liabilities then left off the books. Greece, for example, traded away the rights to airport fees and lottery proceeds in years to come.
- ↑ Nicholas Dunbar; Elisa Martinuzzi (5 March 2012). "Goldman Secret Greece Loan Shows Two Sinners as Client Unravels". Bloomberg.
Greece actually executed the swap transactions to reduce its debt-to-gross-domestic-product ratio because all member states were required by the Maastricht Treaty to show an improvement in their public finances," Laffan said in an e- mail. "The swaps were one of several techniques that many European governments used to meet the terms of the treaty."
- ↑ Edmund Conway Economics (15 February 2010). "Did Goldman Sachs help Britain hide its debts too?". The Daily Telegraph. London.
One of the more intriguing lines from that latter piece says: "Instruments developed by Goldman Sachs, JPMorgan Chase and a wide range of other banks enabled politicians to mask additional borrowing in Greece, Italy and possibly elsewhere." So, the obvious question goes, what about the UK? Did Britain hide its debts? Was Goldman Sachs involved? Should we panic?
- ↑ Elena Moya (16 February 2010). "Banks that inflated Greek debt should be investigated, EU urges". The Guardian.
"These instruments were not invented by Greece, nor did investment banks discover them just for Greece," said Christophoros Sardelis, who was chief of Greece's debt management agency when the contracts were conducted with Goldman Sachs.Such contracts were also used by other European countries until Eurostat, the EU's statistic agency, stopped accepting them later in the decade. Eurostat has also asked Athens to clarify the contracts.
- 1 2 Beat Balzli (8 February 2010). "Greek Debt Crisis: How Goldman Sachs Helped Greece to Mask its True Debt". Der Spiegel. Retrieved 29 October 2013.
This credit disguised as a swap didn't show up in the Greek debt statistics. Eurostat's reporting rules don't comprehensively record transactions involving financial derivatives. "The Maastricht rules can be circumvented quite legally through swaps," says a German derivatives dealer. In previous years, Italy used a similar trick to mask its true debt with the help of a different US bank.
- ↑ Story, Louise; Thomas Jr, Landon; Schwartz, Nelson D. (14 February 2010). "Wall St. Helped To Mask Debt Fueling Europe's Crisis". The New York Times. Retrieved 6 May 2010.
- ↑ "Papandreou Faces Bond Rout as Budget Worsens, Workers Strike". Bloomberg. 22 April 2010. Retrieved 2 May 2010.
- ↑ Staff (19 February 2010). "Britain's Deficit Third Worst in the World, Table". The Daily Telegraph. London. Retrieved 5 August 2011.
- ↑ Melander, Ingrid; Papchristou, Harry (5 November 2009). "Greek Debt To Reach 120.8 Pct of GDP in '10 – Draft". Reuters. Retrieved 5 August 2011.
- ↑ "Greece Faces `Unprecedented' Cuts as $159B Rescue Nears". Bloomberg. 3 May 2010. Retrieved 6 March 2014.
- ↑ Kerin Hope (2 May 2010). "EU Puts Positive Spin on Greek Rescue". Financial Times. Retrieved 6 May 2010.
- ↑ Newman, Rick (3 November 2011). "Lessons for Congress From the Chaos in Greece". US News. Retrieved 3 November 2011.
- ↑ "Greece's Austerity Measures". BBC News. Retrieved 9 May 2010.
- ↑ "Greek Parliament Passes Austerity Measures". The New York Times. Retrieved 9 May 2010.
- ↑ Drew, Kevin (5 December 2011). "Times Topics European Union". New York Times. Retrieved 8 December 2011.
- ↑ Kavoussi, Bonnie (24 October 2011). "Greek Austerity: Budget Cuts Deepen Recession, Quicken Reckoning". Huffington Post. Retrieved 8 December 2011.
- ↑ "Greece: Country's Deficit Will Fall, No New Austerity Needed". Huffington Post. 24 October 2011. Retrieved 8 December 2011.
- ↑ Granitsas, Alkman; Paris, Costas (6 December 2011). "Greek Politician Expects Recession Will Linger". The Wall Street Journal. Retrieved 8 December 2011.
- ↑ "Greece to see out year in recession". Financial Times. 3 July 2011. Retrieved 8 December 2011.
- ↑ "Greek public sector workers hold 24-hour strike". BBC News.
- ↑ "Greek politics: Immigrants as scapegoats". The Economist. 6 October 2012. Retrieved 6 October 2012.
- ↑ "Greece First Developed Market Cut to Emerging at MSCI". Bloomberg. 12 June 2013. Retrieved 6 March 2014.
- ↑ "Market Classification". New York: MSCI. Retrieved 6 March 2014.
- ↑ "S&P Dow Jones Indices Announces Country Classification Consultation Results" (PDF). New York: S&P Dow Jones Indices. 30 October 2013. Retrieved 6 March 2014.
- ↑ "State workers in Greece hold strike to protest layoffs". Greek Herald. Retrieved 9 July 2014.
- ↑ "GDP up by 0.3% in the euro area and by 0.4% in the EU28" (PDF). Luxembourg: Eurostat. 6 March 2015. Retrieved 9 March 2015.
- ↑ "PM eyes stability, says opposition proposals could undermine debt effort". Kathimerini. 15 November 2014. Retrieved 16 November 2014.
- 1 2 3 "Crops products (excluding fruits and vegetables) (annual data)". Eurostat. Retrieved 19 October 2011.
- 1 2 3 4 5 "Fruits and vegetables (annual data)". Eurostat. Retrieved 19 October 2011.
- 1 2 3 "Sustainable development in the European Union" (PDF). Eurostat. 2009. Retrieved 24 October 2011.
- 1 2 3 4 "Fishery statistics; Data 1995–2008" (PDF). Eurostat. Retrieved 20 October 2011.
- ↑ "Industrial turnover – mining, quarrying and manufacturing". Eurostat. Retrieved 22 February 2011.
- 1 2 3 4 5 6 7 8 9 10 "Europe in Figures – Yearbook 2011" (PDF). Eurostat. Retrieved 22 February 2011.
- ↑ "Βιομηχανικά Προϊόντα (PRODCOM) (Παραγωγή και Πωλήσεις)". Hellenic Statistical Authority. Retrieved 22 February 2012.
- ↑ "Manufacturing products (PRODCOM) :Production and sales – 2010 – Provisional Data". Hellenic Statistical Authority. Retrieved 4 June 2013.
- 1 2 Polemis, Spyros M. "The History of Greek Shipping". greece.org. Retrieved 9 April 2007.
- 1 2 Ιστορία των Ελλήνων – Ο Ελληνισμός υπό Ξένη Κυριαρχία 1453–1821 [History of the Greeks – Hellenism under Foreign Rule 1453–1821]. Volume 8. Athens: Domi Publishings. pp. 652–653. ISBN 960-8177-93-6.
- ↑ "Greek Fleet". 1914. Retrieved 9 June 2012.
- 1 2 Engber, Daniel (17 August 2005). "So Many Greek Shipping Magnates ...". Slate. Washington Post/slate.msn.com. Archived from the original on 8 June 2007. Retrieved 9 April 2007.
- 1 2 3 4 5 6 7 "ECSA Annual report 2011–2012" (PDF). European Community Shipowners' Associations. ecsa.eu.
- 1 2 3 4 "ECSA Annual report 2010–2011" (PDF). European Community Shipowners' Association. ecsa.eu.
- 1 2 "Greek shipping is modernized to remain a global leader and expand its contribution to the Greek economy". National Bank of Greece. nbg.gr. 11 May 2006. Archived from the original on 31 August 2007. Retrieved 8 April 2007.
- ↑ "As Greece Struggles with Debt Crisis, Its Shipping Tycoons Still Cut a Profit". Time World. 16 May 2013. Retrieved 4 June 2013.
- 1 2 3 4 "ITC Trade Map: List of importers for Sea Transport, i.e. country ranking in value of imports (services; data code 206; yearly times series)". WTO-ITC. Retrieved 23 May 2013.
- 1 2 3 4 "ITC Trade Map: List of markets for Sea Transport, i.e. country ranking in value of trade balance (services; data code 206; yearly times series)". WTO-ITC. Retrieved 23 May 2013.
- ↑ "GDP and main components – Current prices". Luxembourg: Eurostat. 13 April 2015. Retrieved 10 May 2015.
- 1 2 3 "Company Profile". Athens: OTE. Retrieved 10 January 2014.
- 1 2 "Δύο φορές ο πληθυσμός μας σε συνδέσεις". Hellenic Tellecommunications Organization (OTE). enet.gr. Retrieved 20 October 2011.
- 1 2 3 "Internet access and use in 2011" (PDF). Luxembourg: Eurostat. 14 December 2011. Retrieved 19 December 2013.
- 1 2 3 "Internet access and use in 2013" (PDF). Luxembourg: Eurostat. 18 December 2013. Retrieved 19 December 2013.
- 1 2 Jafa Jafari. Encyclopedia of tourism. Retrieved 1 March 2012.
- 1 2 Miltiadis Lytras; Ernesto Damiani; Lily Diaz. Digital culture and e-tourism. Retrieved 1 March 2012.
- 1 2 3 4 Tourism in OECD Countries 2008: Trends and Policies. OECD. 2008. Retrieved 19 August 2011.
- ↑ "Nights spent in tourist accommodation establishments – regional – annual data". Eurostat. 2010. Retrieved 19 May 2011.
- ↑ "Tourism" (PDF). Eurostat. 2010. Retrieved 19 May 2011.
- ↑ "Spain, Italy and France: top destinations for holiday trips abroad of EU27 residents in 2011" (PDF). Luxembourg: Eurostat. 15 April 2013. Retrieved 23 April 2013.
- ↑ "Ultimate party cities". Lonely Planet. Retrieved 10 August 2011.
- 1 2 "World's Best Awards – Islands". Travel + Leisure. Archived from the original on 13 July 2011. Retrieved 10 August 2011.
- 1 2 "Macedonia-Turkey: The Ties That Bind". Balkan Insight. Retrieved 22 February 2012.
- 1 2 "Greek investments in Bulgaria soar since 2005". Sofia Echo. Retrieved 22 February 2012.
- ↑ "Greek investment in Serbia tops 2 billion euros". Kathimerini. Retrieved 22 February 2012.
- ↑ "Global Greece: Romania". Invest in Greece. Retrieved 22 February 2012.
- ↑ http://albanians.gr/greqia-e-para-investitore-ne-shqiperi-25-te-totalit-te-investimeve.html
- 1 2 "Imports / exports". Hellenic Statistical Authority. Retrieved 22 February 2012.
- ↑ "COMMERCIAL TRANSACTIONS OF GREECE : December 2011 ( Provisional Data )" (PDF). Piraeus: Hellenic Statistical Authority. 28 February 2012. Retrieved 10 April 2012.
- ↑ "The World Factbook – Cyprus". CIA. Retrieved 13 April 2013.
- ↑ "The World Factbook – Macedonia". CIA. Retrieved 13 April 2013.
- 1 2 "Χάρτης Αερολιμένων". Hellenic Civil Aviation Authority. Archived from the original on 5 October 2011. Retrieved 18 October 2011.
- 1 2 "Awards". Aegean Airlines. Retrieved 18 October 2011.
- ↑ Shepherd, Lesley (24 September 2010). "Awards for Binter Canarias, Olympic and Cimber". European Regions Airline Association. Retrieved 24 September 2010.
- ↑ "Olympic Air Take Tops In Condé Nast Traveller Awards". Olympic Air. 14 July 2011. Archived from the original on 18 July 2011. Retrieved 15 July 2011.
- 1 2 3 4 5 6 "Maritime transport – Goods (gross weight) – Annual data – All ports – by direction". Eurostat. Retrieved 19 October 2011.
- ↑ Bellos, Ilias (30 January 2014). Ο Πειραιάς ανακηρύχθηκε το ταχύτερα αναπτυσσόμενο λιμάνι του πλανήτη το 2013. Kathimerini (in Greek). Retrieved 12 May 2014.
- ↑ "Ενιαίος Πίνακας Στατιστικών Στοιχείων Ετών 2007, 2008, 2009, 2010". Piraeus Port Authority. Archived from the original on 15 March 2012. Retrieved 19 October 2011.
- ↑ "Statistical Data 2010" (PDF). Thessaloniki Port Authority. Retrieved 19 October 2011.
- 1 2 3 4 5 "Maritime transport – Passengers – Annual data – All ports – by direction". Eurostat. Retrieved 19 October 2011.
- 1 2 3 4 5 "Public Power Corporation S.A. Financial Report (January 1, 2010 – December 31, 2010)" (PDF). Public Power Corporation of Greece. 2010. Retrieved 24 October 2011.
- 1 2 3 "Energy". Invest in Greece Agency. Retrieved 26 October 2011.
- 1 2 3 "Share of renewable energy in gross final energy consumption %". Eurostat. 2008. Retrieved 24 October 2011.
- ↑ "Renewable energy >> Targets by 2020". Eurostat. Retrieved 24 October 2011.
- ↑ "Monthly Energy Balance". Athens: Independent Power Transmission Operator. Retrieved 23 August 2013.
- ↑ "Πορίσματα της Ομάδας Εργασίας της Επιτροπής Ενέργειας της Ακαδημίας Αθηνών επί του θέματος "Πυρηνική Ενέργεια και Ενεργειακές Ανάγκες της Ελλάδος"" (PDF). Academy of Athens. Retrieved 24 October 2011.
- 1 2 3 4 "Green Light for Hydrocarbon Exploration". Invest in Greece Agency. Retrieved 26 October 2011.
- ↑ "Μέσα στην άνοιξη οι σεισμικές έρευνες σε Ιόνιο και Ν. Κρήτη για υδρογονάνθρακες" [(Oil and gas) exploration in the Ionian Sea and Crete to start this spring]. Skai TV. Retrieved 6 March 2012.
- 1 2 3 "Ενδιαφέρον ξένων εταιρειών για υδρογονάνθρακες σε Ιόνιο – Κρήτη" [Interest from foreign companies for hydrocarbon exploration in the Ionian Sea and Crete]. Skai TV. Retrieved 6 March 2012.
- ↑ "Greek natural gas reserves could reach 427 bln euros according to Deutsche Bank report". Kathimerini. 5 December 2012. Retrieved 11 December 2012.
- 1 2 3 4 5 6 7 8 9 10 11 12 "Taxation trends in the European Union 2011 Edition" (PDF). Eurostat. 2011. Retrieved 30 October 2011.
- ↑ "Tax bill to hurt lower incomes". ekathimerini. 2011. Retrieved 5 March 2012.
- ↑ "Tax burden to get bigger in June". ekathimerini. 2012. Retrieved 5 March 2012.
- 1 2 3 4 5 6 7 Προϋπολογισμός 2012 (PDF) (in Greek). Ministry of Finance. 2011. Archived from the original (PDF) on 27 October 2011. Retrieved 12 October 2011.
- 1 2 Πτώση της φοροδιαφυγής στο 41,6% από 49% το τελευταίο εξάμηνο (in Greek). Ethnos. 2006. Retrieved 12 October 2011.
- ↑ Inman, Phillip (9 September 2012) Primary Greek tax evaders are the professional classes The Guardian. Retrieved 6 October 2012
- ↑ "20 δισ. ευρώ έχουν κρύψει οι Έλληνες στην Ελβετία". Skai TV. 2011. Retrieved 12 October 2011.
- ↑ Boyes, Roger. "Rich greeks pack up their troubles along with their euros". The Times.
- ↑ Υπερδύναμη στις οφ σορ η Ελλάδα (in Greek). Ta Nea. 2011. Retrieved 12 October 2011.
- 1 2 3 Μέχρι το τέλος του 2011 η συμφωνία για τη φορολόγηση των καταθέσεων στην Ελβετία [Deal to tax Swiss bank accounts to be reached by end of 2011] (in Greek). Skai TV. Retrieved 30 October 2011.
- 1 2 3 4 5 6 "2014 GDP per capita in 276 EU regions" (PDF). Luxembourg: Eurostat. 26 February 2016. Retrieved 26 February 2016.
- ↑ "The Global 2000". Forbes. May 2013. Retrieved 4 June 2013.
- 1 2 OECD Factbook 2014: Economic, environmental and social statistics, OECD (2014)
- ↑ "Deadline for the exchange of Drachma Banknotes". Bank of Greece. Retrieved 23 February 2012.
- 1 2 3 "Οι Έλληνες, το Ευρώ και η Δραχμή Νο. 2" [The Greeks, the Euro and the Drachma No. 2] (PDF). Public Issue (Kathimerini). Retrieved 2 November 2011.
- ↑ Greece:Staff report on request for stand-by arrangement IMF, Country report No. 10/110 (2010)
- 1 2 Greece Comes to a Standstill as Unions Turn Against Tsipras N. Chrysoloras, Bloomberg, News, 12 Nov 2015
- 1 2 3 Georgakopoulos, Thodoris. "Extreme Poverty in Greece". dianeosis. dianeosis. Retrieved 1 December 2016.
- ↑ "Greece in Figures" (PDF). statistics.gr. Hellenic Statistical Authority. Retrieved 2 December 2016.
- ↑ Georgiopoulos, George. "Greeks 40 percent poorer than in 2008". www.reuters.com. Retrieved 1 December 2016.
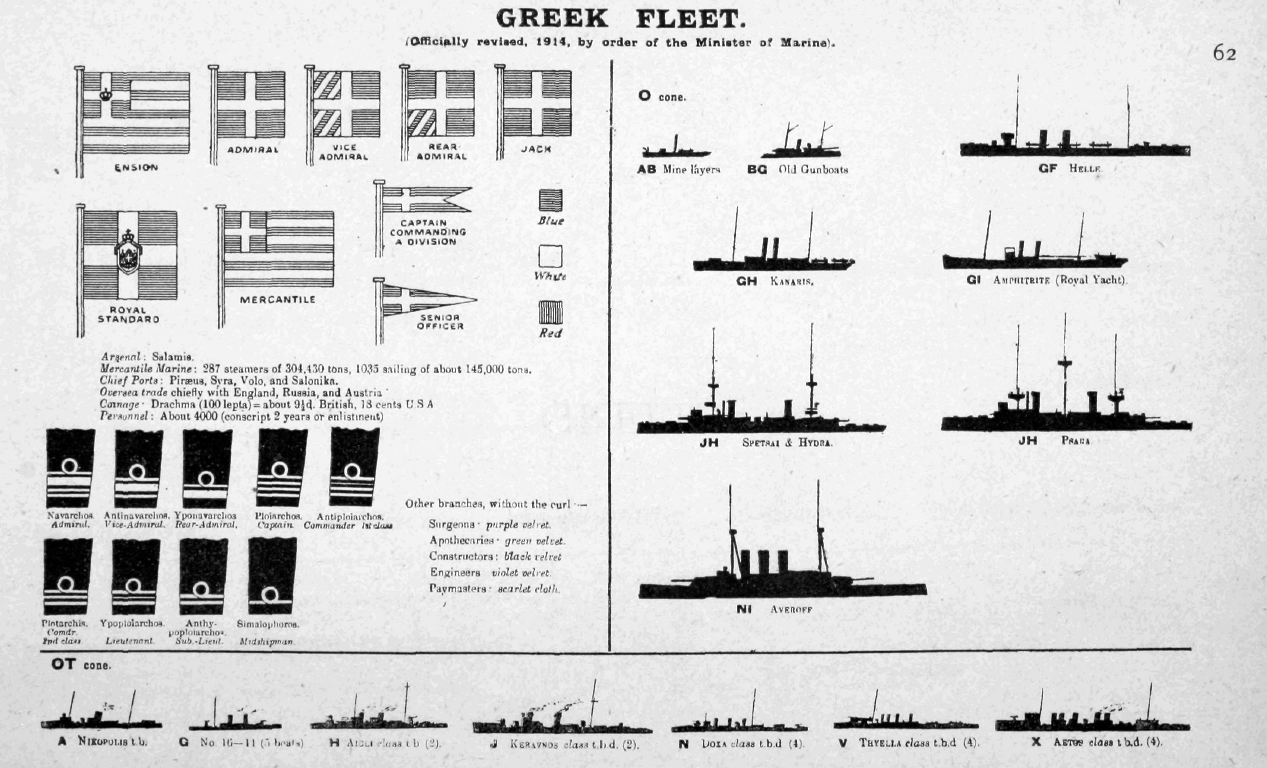
Further reading
- Pasiouras, Fotios. Greek Banking: From the Pre-Euro Reforms to the Financial Crisis and Beyond (Palgrave Macmillan; 2012) 217 pages; covers the mid-1990s to 2011.
- Manolopoulos, J. Greece's 'Odious' Debt: The Looting of the Hellenic Republic by the Euro, the Political Elite and the Investment Community. London, May 2011: Anthem Press.
External links
| Wikimedia Commons has media related to Economy of Greece. |
- Nick Malkoutzis Greece – A Year in Crisis – Friedrich-Ebert-Stiftung, June 2011
- The Greek Economy: Which Way Forward?, from the Center for Economic and Policy Research, January 2015
- The Greek Economy – a bi-monthly publication by the Hellenic Statistical Authority on the state of the economy
- The Greek Exports – Database of Greek Exporters
- Greek Banks Digest – (in English)
- World Bank Summary Trade Statistics Greece
- Tariffs applied by Greece as provided by ITC's Market Access Map, an online database of customs tariffs and market requirements
- New study on the "Economic, Social and Territorial Situation of Greece" – European Parliament, Committee on Regional Development's delegation to Greece, 13 – 15 July 2011
- OECD Data > Greece
Greece articles | ||||||||
|---|---|---|---|---|---|---|---|---|
| History |
| | ||||||
| Geography |
| |||||||
| Politics | ||||||||
| Economy | ||||||||
| Society | ||||||||
| ||||||||