Economy of Croatia
 Sectors of the Croatian economy | |
| Currency | Croatian kuna (HRK, kn) |
|---|---|
| Calendar year | |
Trade organisations | EU, WTO |
| Statistics | |
| GDP |
$58.330 billion (nominal, 2014) $91.096 billion (PPP, 2015) |
| GDP rank | 76th (nominal) / 83rd (PPP) |
GDP growth |
|
GDP per capita |
$13,493 (nominal, 2014)[2] $21,169 (PPP, 2015 est.)[3] |
GDP by sector | agriculture: 4.3%; industry: 26.7%; services: 69.1% (2015 est.) |
GDP by component | Private consumption: 60.6%; Public consumption: 20.0%; Investments: 19.3% (2013)[4] |
| -1.8% (May 2016)[1] | |
Population below poverty line | 19.4% (2014)[5] |
|
| |
|
| |
Labour force | 1.642,474 (2015) |
Labour force by occupation | agriculture: 1.9%; industry: 27.6%; services: 70.4% (2014) |
| Unemployment |
|
Average gross salary | 7,791 HRK / $1166, monthly (May 2016)[8] |
| 5,706 HRK / $854, monthly (May 2016)[8] | |
Main industries | chemicals and plastics, machine tools, fabricated metal, electronics, pig iron and rolled steel products, aluminium, paper, wood products, construction materials, textiles, shipbuilding, petroleum and petroleum refining, food and beverages, tourism |
| 40th (2015)[9] | |
| External | |
| Exports |
|
Export goods | transport equipment, machinery, textiles, chemicals, foodstuffs, fuels |
Main export partners |
|
| Imports |
|
Import goods | machinery, transport and electrical equipment; chemicals, fuels and lubricants; foodstuffs |
Main import partners |
|
FDI stock |
|
Gross external debt |
|
| Public finances | |
|
| |
| €1.4 billion, 3.2% of GDP (2015)[11] | |
| Revenues | $20.49 billion (2015)[12] |
| Expenses | $22.91 billion (2015)[12] |
| Economic aid | €179.5 million (0.12% of GNI) (2007) |
| S&P BB Outlook: Negative (2015)[13] | |
Foreign reserves |
|
Economy of Croatia is a service-based economy with the tertiary sector accounting for 70% of total gross domestic product (GDP). After the collapse of socialism, Croatia went through a process of transition to a market-based economy in the 1990s, but its economy suffered badly during the Croatian War of Independence. After the war the economy began to improve, before the financial crisis of 2007–08 the Croatian economy grew at 4-5% annually, incomes doubled, and economic and social opportunities dramatically improved.
Croatia joined the World Trade Organization in 2000, NATO in 2009 and became a member of the European Union on 1 July 2013. Croatian economy was badly affected by the financial crisis which, together with slow progress of economic reforms, resulted in six years of recession and a cumulative decline in GDP of 12,5%. Croatia formally emerged from the recession with 3 continuous quarters of GDP growth in Q4 2014 (0,3%), Q1 2015 (0,5%) and Q2 2015 (1,2%). Predictions are that real GDP growth will gradually rise to 2.1% in 2016.
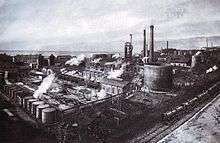
The industrial sector with exports of over €1 billion annually is dominated by shipbuilding which accounts for over 10% of exported goods. Food processing and chemical industry also account for significant portions of industrial output and exports. Industrial sector represents 27% of Croatia’s total economic output while agriculture represents 6%. Industrial sector is responsible for 25% of Croatia's GDP, with agriculture, forestry and fishing accounting for the remaining 5% of Croatian GDP.
Tourism is traditionally a notable source of income, particularly during the summer months, but also more recently during the winter months as well, due to an increase in popularity of snow sports such as skiing. With over 14 million tourists annually, tourism generates revenue in excess of €8 billion. Croatia is ranked among the top 20 most popular tourist destinations in the world, and was voted world's top tourism destination in 2005 by Lonely Planet.[15]
Trade plays a major role in Croatian economic output. In 2007 Croatia's exports were valued at USD 12.84 billion (24.7 billion including service exports). According to Healy Consultants, trade in Croatia is bolstered by its low trade-weighted average tariff of just 1.2%.[16] Croatia's currency is the Kuna, which was implemented in 1994 and has remained stable since.
History
Pre-1990

During the 19th century the Kingdom of Croatia had a high ratio of population working in agriculture. Many industrial branches developed in that time, like forestry and wood industry (stave fabrication, the production of potash, lumber mills, shipbuilding). The most profitable one was stave fabrication, the boom of which started in the 1820s with the clearing of the oak forests around Karlovac and Sisak and again in the 1850s with the marshy oak masses along the Sava and Drava rivers. Shipbuilding in Croatia played a huge role in the 1850s Austrian Empire, especially the longe-range sailing boats. Sisak and Vukovar were the centres of river-shipbuilding.[17] Slavonia was also mostly an agricultural land and it was known for its silk production. Agriculture and the breeding of cattle were the most profitable occupations of the inhabitants. It produced corn of all kinds, hemp, flax, tobacco, and great quantities of liquorice.[18][19]
The first steps towards industrialization began in the 1830s and in the following decades the construction of big industrial enterprises took place.[20] During the 2nd half of the 19th and early 20th century there was an upsurge of industry in Croatia, strengthened by the construction of railways and the electric-power production. However, the industrial production was still lower than agricultural production.[21] Regional differences were high. Industrialization was faster in inner Croatia than in other regions, while Dalmatia remained one of the poorest provinces of Austria-Hungary.[22] The slow rate of modernization and rural overpopulation caused extensive emigration, particularly from Dalmatia. According to estimates, roughly 400,000 Croats emigrated from Austria-Hungary between 1880 and 1914. In 1910 8,5% of the population of Croatia-Slavonia lived in urban settlements.[23]
In 1918 Croatia became part of the Kingdom of Yugoslavia, which was in the interwar period one of the least developed countries in Europe. Most of its industry was based in Slovenia and Croatia, but further industrial development was modest and centered on textile mills, sawmills, brick yards and food-processing plants. Economy was stil traditionally based on agriculture and raising of livestock, with peasants accounting for more than half of Croatia's population.[23][24]
In 1941 the Independent State of Croatia (NDH), a World War II puppet state of Germany and Italy, was established in parts of Axis-occupied Yugoslavia. The economic system of NDH was based on the concept of "Croatian socialism".[25] The main characteristic of the new system was the concept of a planned economy with high levels of state involvement in economic life. The fulfillment of basic economic interests was primarily ensured with measures of repression.[26] All large companies were placed under state control and the property of the regime's national enemies was nationalized. Its currency was the NDH kuna. The Croatian State Bank was the central bank, responsible for issuing currency. As the war progressed the government kept printing more money and its amount in circulation was rapidly increasing, resulting in high inflation rates.[27]
After the World War II, the new Communist Party of Yugoslavia resorted to a command economy on the Soviet model of rapid industrial development. By 1948 almost all domestic and foreign-owned capital had been nationalized. The industrialization plan relied on high taxation, fixed prices, war reparations, Soviet credits, and export of food and raw materials. Forced collectivization of agriculture was initiated in 1949. At that time 94% of agricultural land was privately owned, and by 1950 96% was under the control of the social sector. A rapid improvement of food production and the standard of living was expected, but due to bad results the program was abandoned three years later.[23]
Throughout the 1950s Croatia experienced rapid urbanization. Decentralization came in 1965 and spurred growth of several sectors including the prosperous tourist industry. SR Croatia was, after SR Slovenia, the second most developed republic in Yugoslavia with a 25% higher GDP per capita than the Yugoslav average. Croatia and Slovenia accounted for nearly half of the total Yugoslav GDP, and this was reflected in the overall standard of living. In the mid-1960s, Yugoslavia lifted emigration restrictions and the number of emigrants increased rapidly. In 1971 224,722 workers from Croatia were employed abroad, mostly in West Germany.[28][29] Foreign remittances contributed $2 billion annually to the economy by 1990.[30] Profits gained through Croatia's industry were used to develop poor regions in other parts of former Yugoslavia, leading to Croatia contributing much more to the federal Yugoslav economy than it gained in return. This, coupled with austerity programs and hyperinflation in the 1980s, led to discontent in both Croatia and Slovenia which eventually fuelled political movements calling for independence.[31]
Transition and war years


In the late 1980s and early 1990s, with the collapse of socialism and the beginning of economic transition, Croatia faced considerable economic problems stemming from:[32]
- the legacy of longtime communist mismanagement of the economy;
- damage during the internecine fighting to bridges, factories, power lines, buildings, and houses;
- the large refugee and displaced population, both Croatian and Bosnian;
- the disruption of economic ties; and
- mishandled privatization
At the time Croatia gained independence, its economy (and the whole Yugoslavian economy) was in the middle of recession. Privatization under the new government had barely begun when war broke out in 1991. As a result of the Croatian War of Independence, infrastructure sustained massive damage in the period 1991-92, especially the revenue-rich tourism industry. Privatization in Croatia and transformation from a planned economy to a market economy was thus slow and unsteady, largely as a result of public mistrust when many state-owned companies were sold to politically well-connected at below-market prices. With the end of the war, Croatia's economy recovered moderately, but corruption, cronyism, and a general lack of transparency stymied economic reforms and foreign investment.[31][33] The privatization of large government-owned companies was practically halted during the war and in the years immediately following the conclusion of peace. As of 2000, roughly 70% of Croatia's major companies were still state-owned, including water, electricity, oil, transportation, telecommunications, and tourism.[34]
Early 1990s were characterized with high inflation rates. In 1991 the Croatian dinar was introduced as a transitional currency, but inflation continued to accelerate. The anti-inflationary stabilization steps in 1993 decreased retail price inflation from a monthly rate of 38,7% to 1,4%, and by the end of the year Croatia experienced deflation. In 1994 Croatia introduced the kuna as its currency.[33]
As a result of the macro-stabilization programs, the negative growth of GDP during the early 1990s stopped and turned into a positive trend. Post-war reconstruction activity provided another impetus to growth. Consumer spending and private sector investments, both of which were postponed during the war, contributed to the growth in 1995-1997.[33] Croatia began its independence with a relatively low external debt because the debt of Yugoslavia was not shared among its former republics at the beginning. In March 1995 Croatia agreed with the Paris Club of creditor governments and took 28,5% of Yugoslavia's previously non-allocated debt over 14 years. In July 1996 an agreement was reached with the London Club of commercial creditors, when Croatia took 29,5% of Yugoslavia's debt to commercial banks. In 1997 around 60 percent of Croatia's external debt was inherited from former Yugoslavia.[35]
At the beginning of 1998 value-added tax was introduced. The central government budget was in surplus in that year, most of which was used to repay foreign debt.[36] Government debt to GDP had fallen from 27,30% to 26,20% at the end of 1998. However, the consumer boom was disrupted in mid 1998, as a result of the bank crisis when 14 banks went bankrupt.[33] Unemployment increased and GDP growth slowed down to 1,9%. The recession that began at the end of 1998 continued through most of 1999, and after a period of expansion GDP in 1999 had a negative growth of -0,9%.[37] In 1999 the government tightened its fiscal policy and revised the budget with a 7% cut in spending.[38]
In 1999 the private sector share in GDP reached 60%, which was significantly lower than in other former socialist countries. After several years of successful macroeconomic stabilization policies, low inflation and a stable currency, economists warned that the lack of fiscal changes and the expanding role of the state in economy caused the decline in the late 1990s and were preventing a sustainable economic growth.[35][38]
| Year | GDP Growth | Deficit/Surplus* | Debt to GDP | Privatization revenues* |
|---|---|---|---|---|
| 1994 | 5,9% | 1,8% | 22,20% | |
| 1995 | 6,8% | -0,7% | 19,30% | 0,9% |
| 1996 | 5,9% | -0,4% | 28,50% | 1,4% |
| 1997 | 6,6% | -1,2% | 27,30% | 2,0% |
| 1998 | 1,9% | 0,5% | 26,20% | 3,6% |
| 1999 | -0,9% | -2,2% | 28,50% | 8,2% |
| 2000 | 3,8% | -5,0% | 34,30% | 10,2% |
| 2001 | 3,4% | -3,2% | 35,20% | 13,5% |
| 2002 | 5,2% | -2,6% | 34,80% | 15,8% |
| *Including capital revenues *cumulative, in % of GDP | ||||
Economy since 2000
The new government led by the president of SDP, Ivica Račan, carried out a number of structural reforms after it won the parliamentary elections on 3 January 2000. The country emerged from the recession in the 4th quarter of 1999 and growth picked up in 2000.[39] Due to overall increase in stability, the economic rating of the country improved and interest rates dropped. Economic growth in the 2000s was stimulated by a credit boom led by newly privatized banks, capital investment, especially in road construction, a rebound in tourism and credit-driven consumer spending. Inflation remained tame and the currency, the kuna, stable.[31][40]
In 2000 Croatia generated 5,899 billion kunas in total income from the shipbuilding sector, which employed 13,592 people. Total exports in 2001 amounted to $4,659,286,000, of which 54,7% went to the countries of the EU. Croatia's total imports were $9,043,699,000, 56% of which originated from the EU.[41]
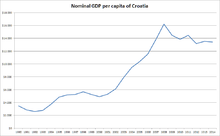
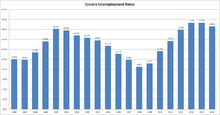
Unemployment reached its peak in late 2002, but has since been steadily declining. In 2003, the nation's economy would officially recover to the amount of GDP it had in 1990.[42] In late 2003 the new government led by HDZ took over the office. Unemployment continued falling, powered by growing industrial production and rising GDP, rather than only seasonal changes from tourism. Unemployment reached an all-time low in 2008 when the annual average rate was 8,6%,[43] GDP per capita peaked at $16,158,[37] while public debt as percentage of GDP decreased to 29%. Most economic indicators remained positive in this period except for the external debt as Croatian firms focused more on empowering the economy by taking loans from foreign resources.[42] Between 2003 and 2007, Croatia’s private-sector share of GDP increased from 60% to 70%.[44]
The Croatian National Bank had to take steps to curb further growth of indebtedness of local banks with foreign banks. The dollar debt figure is quite adversely affected by the EUR/USD ratio — over a third of the increase in debt since 2002 is due to currency value changes.
2009 – present
Economic growth has been hurt by the global financial crisis.[45] Immediately after the crisis it seemed that Croatia did not suffer serious consequences like some other countries. However, in 2009, the crisis gained momentum and the decline in GDP growth, at a slower pace, continued during 2010. In 2011 the GDP stagnated as the growth rate was zero.[46] Since the global crisis hit the country, the unemployment rate has been steadily increasing, resulting in the loss of more than 100,000 jobs.[47] While unemployment was 9.6% in late 2007,[48] in January 2014 it peaked at 22.4%.[1] In 2010 Gini coefficient was 0,32.[49] In September 2012, Fitch ratings agency unexpectedly improved Croatia's economic outlook from negative to stable, reafirming Croatia's current BBB rating.[50] The slow pace of privatization of state-owned businesses and an overreliance on tourism have also been a drag on the economy.[45]
Croatia joined the European Union on 1 July 2013 as the 28th member state. The Croatian economy is heavily interdependent on other principal economies of Europe, and any negative trends in these larger EU economies also have a negative impact on Croatia. Italy, Germany and Slovenia are Croatia's most important trade partners.[46] In spite of the rather slow post-recession recovery, in terms of income per capita it is still ahead of some European Union member states such as Bulgaria, and Romania.[51] In terms of average monthly wage, Croatia is ahead of 9 EU members (Czech Republic, Estonia, Slovakia, Latvia, Poland, Hungary, Lithuania, Romania, and Bulgaria).[52]
Annual average unemployment rate in 2014 was 17.3% and Croatia has the third highest unemployment rate in the European Union, after Greece (26.5%), and Spain (24.%).[43] Of particular concern is the heavily backlogged judiciary system, combined with inefficient public administration, especially regarding the issues of land ownership and corruption in the public sector. Unemployment is regionally uneven: it is very high in eastern and southern parts of the country, nearing 20% in some areas, while relatively low in the north-west and in larger cities, where it is between 3 and 7%. In 2015 external debt rose by 2.7 billion euros since the end of 2014 and is now around €49.3 billion.
Sectors
Tourism
 Cruise ship in Dubrovnik.
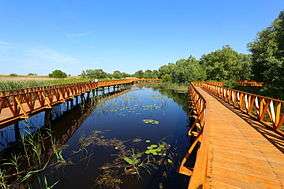 Kopački Rit Nature Reserve.
.jpg) St. Mark's Church in Zagreb.
St. Mark's Church in Zagreb. Varaždin Old Town.
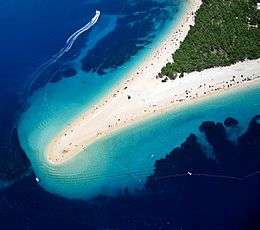 Zlatni Rat beach on the Brač island.
Tourism is a notable source of income during the summer and a major industry in Croatia. It dominates the Croatian service sector and accounts for up to 20% of Croatian GDP. Annual tourist industry income for 2011 was estimated at €6.61 billion. Its positive effects are felt throughout the economy of Croatia in terms of increased business volume observed in retail business, processing industry orders and summer seasonal employment. The industry is considered an export business, because it significantly reduces the country's external trade imbalance.[53] Since the conclusion of the Croatian War of Independence, the tourist industry has grown rapidly, recording a fourfold rise in tourist numbers, with more than 10 million tourists each year. The most numerous are tourists from Germany, Slovenia, Austria and the Czech Republic as well as Croatia itself. Length of a tourist stay in Croatia averages 4.9 days.[54]
The bulk of the tourist industry is concentrated along the Adriatic Sea coast. Opatija was the first holiday resort since the middle of the 19th century. By the 1890s, it became one of the most significant European health resorts.[55] Later a large number of resorts sprang up along the coast and numerous islands, offering services ranging from mass tourism to catering and various niche markets, the most significant being nautical tourism, as there are numerous marinas with more than 16 thousand berths, cultural tourism relying on appeal of medieval coastal cities and numerous cultural events taking place during the summer. Inland areas offer mountain resorts, agrotourism and spas. Zagreb is also a significant tourist destination, rivalling major coastal cities and resorts.[56]
Croatia has unpolluted marine areas reflected through numerous nature reserves and 116 Blue Flag beaches.[57] Croatia is ranked as the 18th most popular tourist destination in the world.[58] About 15% of these visitors (over one million per year) are involved with naturism, an industry for which Croatia is world-famous. It was also the first European country to develop commercial naturist resorts.[59]
Agriculture
Croatian agricultural sector subsists from exports of blue water fish, which in recent years experienced a tremendous surge in demand, mainly from Japan and South Korea. Croatia is a notable producer of organic foods and much of it is exported to the European Union. Croatian wines, olive oil and lavender are particularly sought after.
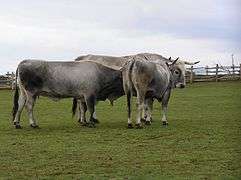 Boškarin cattle.
 Plantations in the fertile Neretva valley.
.jpg) Vineyards of Istria.
Vineyards of Istria. Bluefin tuna, an important export product.
Infrastructure
Transport
.JPG)
The highlight of Croatia's recent infrastructure developments is its rapidly developed motorway network, largely built in the late 1990s and especially in the 2000s. By September 2011, Croatia had completed more than 1,100 kilometres (680 miles) of motorways, connecting Zagreb to most other regions and following various European routes and four Pan-European corridors.[60][61][62] The busiest motorways are the A1, connecting Zagreb to Split and the A3, passing east–west through northwest Croatia and Slavonia.[63] A widespread network of state roads in Croatia acts as motorway feeder roads while connecting all major settlements in the country. The high quality and safety levels of the Croatian motorway network were tested and confirmed by several EuroTAP and EuroTest programs.[64][65]
Croatia has an extensive rail network spanning 2,722 kilometres (1,691 miles), including 985 kilometres (612 miles) of electrified railways and 254 kilometres (158 miles) of double track railways. The most significant railways in Croatia are found within the Pan-European transport corridors Vb and X connecting Rijeka to Budapest and Ljubljana to Belgrade, both via Zagreb.[60] All rail services are operated by Croatian Railways.[66]
There are international airports in Zagreb, Zadar, Split, Dubrovnik, Rijeka, Osijek and Pula.[67] As of January 2011, Croatia complies with International Civil Aviation Organization aviation safety standards and the Federal Aviation Administration upgraded it to Category 1 rating.[68]
The busiest cargo seaport in Croatia is the Port of Rijeka and the busiest passenger ports are Split and Zadar.[69][70] In addition to those, a large number of minor ports serve an extensive system of ferries connecting numerous islands and coastal cities in addition to ferry lines to several cities in Italy.[71] The largest river port is Vukovar, located on the Danube, representing the nation's outlet to the Pan-European transport corridor VII.[60][72]
Energy


There are 610 kilometres (380 miles) of crude oil pipelines in Croatia, connecting the Port of Rijeka oil terminal with refineries in Rijeka and Sisak, as well as several transhipment terminals. The system has a capacity of 20 million tonnes per year.[73] The natural gas transportation system comprises 2,113 kilometres (1,313 miles) of trunk and regional natural gas pipelines, and more than 300 associated structures, connecting production rigs, the Okoli natural gas storage facility, 27 end-users and 37 distribution systems.[74]
Croatian production of energy sources covers 85% of nationwide natural gas demand and 19% of oil demand. In 2008, 47.6% of Croatia's primary energy production structure comprised use of natural gas (47.7%), crude oil (18.0%), fuel wood (8.4%), hydro power (25.4%) and other renewable energy sources (0.5%). In 2009, net total electrical power production in Croatia reached 12,725 GWh and Croatia imported 28.5% of its electric power energy needs.[75] The bulk of Croatian imports are supplied by the Krško Nuclear Power Plant, 50% owned by Hrvatska elektroprivreda, providing 15% of Croatia's electricity.[76]
Electricity:
- production: 13.38 billion kWh (2014 est.)
- consumption: 16.97 billion kWh (2014 est.)
- exports: 2.866 billion kWh (2014 est.)
- imports: 6.592 billion kWh (2014 est.)
- installed generating capacity: 4.206 million kW (2013 est.)
Electricity – production by source:
- hydro: 48.5% (2013 est.)
- fossil fuels: 37.1% (2013 est.)
- nuclear: 7.7% (2013 est.)
- other: 6.6% (2013 est.)
Crude oil:
- production: 11,070 barrels per day (1,760 m3/d) (2014 est.)
- imports: 37,300 barrels per day (5,930 m3/d) (2014 est.)
- proved reserves: 71,000,000 barrels (11,300,000 m3) (2014 est.)
Natural gas:
- production: 1.805 billion m³ (2014 est.)
- consumption: 2.81 billion m³ (2014 est.)
- exports: 422 million m³ (2014 est.)
- imports: 1.079 billion m³ (2014 est.)
- proved reserves: 24.92 billion m³ (2014 est.)
Stock exchanges

Banking

Central bank:
Major commercial banks:
- Zagrebačka banka (owned by UniCredit from Italy)
- Privredna banka Zagreb (owned by Intesa Sanpaolo from Italy)
- Hrvatska poštanska banka
- Hypo-Alpe-Adria Bank d.d. (owned by Addiko Bank from Austria)
- Raiffeisen Bank Austria (owned by Raiffeisen from Austria)
- Erste & Steiermärkische Bank (former Riječka banka, owned by Erste Bank from Austria)
Central Budget
Overall Budget:[77]
revenues:
- $16.77 billion (114.9 billion Kuna) 2016
expenditures:
- $17.9 billion, (122.4 billion Kuna) 2016
Expenditure for 2016
- Foreign and European Affairs - 0.603 billion Kuna
- Social Politics and Youth - 4.7 billion Kuna
- Regional Development and EU funds - 0.917 billion Kuna
- Interior - 5.08 billion Kuna
- Finance - 37.5 billion Kuna
- Defence - 4.02 billion Kuna
- Health - 9.05 billion Kuna
- Justice - 2.3 billion Kuna
- Public Administration - 0.373 billion Kuna
- Economy - 1.8 billion Kuna
- Entrepreneurship and Crafts - 1.2 billion Kuna
- Labour and Pension System - 41.8 billion Kuna
- Maritime Affairs, Transport and Infrastructure - 6.1 billion Kuna
- Science, Education and Sport - 13.8 billion Kuna
- Agriculture - 6.8 billion Kuna
- Tourism - 0.172 billion Kuna
- Environmental and Nature Protection - 1.3 billion Kuna
- Construction and Physical Planning - 0.944 billion Kuna
- Veterans' Affairs - 0.938 billion Kuna
- Culture - 0.924 billion Kuna
Economic indicators
From the CIA World Factbook 2016.
GDP - purchasing power parity: $91.28 billion (2015 est.)
GDP - real growth rate: 1.6% (2015 est.)
GDP - per capita: purchasing power parity - $21,600 (2015 est.)
GDP - composition by sector: agriculture: 4.3% industry: 26.2% services: 69.5% (2015 est.)
Labor force: 1.677 million (2015 est.)
Labor force - by occupation: agriculture 1.9%, industry 27.6%, services 70.4% (2014)
Unemployment rate: 17.1% (2015 est.)
Population below poverty line: 19.5% (2014)
Household income or consumption by percentage share:
lowest 10%:
3.3%
highest 10%:
27.5%
(2008 est.)
Distribution of family income - Gini index: 29 (2001) 32 (2010)
Inflation rate (consumer prices): -0.5% (2015)
Investment (gross fixed): 19,1% of GDP (2014 est.)
Budget:
revenues:
$21.3 billion (2015 est.)
expenditures:
$22.86 billion, (2015 est.)
Public debt: 86.7% of GDP (2015 est.)
Agriculture - products: wheat, corn, sugar beets, sunflower seed, barley, alfalfa, clover, olives, citrus, grapes, soybeans, potatoes; livestock, dairy products
Industries: chemicals and plastics, machine tools, fabricated metal, electronics, pig iron and rolled steel products, aluminium, paper, wood products, construction materials, textiles, shipbuilding, petroleum and petroleum refining, food and beverages; tourism
Industrial production growth rate: 1.9% (2015 est.)
Current account balance: $2.551 billion (2015 est.)
Exports: $11.91 billion (2015 est.)
Exports - commodities: transport equipment, textiles, chemicals, foodstuffs, fuels
Exports - partners: Italy 13.4%, Slovenia 12.5%, Germany 11.4%, Bosnia and Herzegovina 9.9%, Austria 6.6%, (2015)
Imports: $19.28 billion (2015 est.)
Imports - commodities: machinery, transport and electrical equipment, chemicals, fuels and lubricants, foodstuffs
Imports - partners: Germany 15.5%, Italy 13.1%, Slovenia 10.7%, Austria 9.2%, Hungary 7.8%, (2015)
Reserves of foreign exchange and gold: $14.97 billion (31 December 2015 est.)
Debt - external: $50.88 billion (31 December 2015 est.)
Currency: kuna (HRK)
Exchange rates: kuna per US$1 – 6.8583 (2015), 5.7482 (2014), 5.7089 (2013), 5.3735 (2007), 5.8625 (2006), 5.9473 (2005), 6.0358 (2004), 6.7035 (2003), 7.8687 (2002), 8.34 (2001), 8.2766 (2000), 7.112 (1999), 6.362 (1998), 6.157 (1997), 5.434 (1996), 5.230 (1995)
Gross Domestic Product
| Counties of Croatia by GDP, in million Euro | ||||||||||||||
|---|---|---|---|---|---|---|---|---|---|---|---|---|---|---|
| County | 2000 | 2001 | 2002 | 2003 | 2004 | 2005 | 2006 | 2007 | 2008 | 2009 | 2010 | 2011 | 2012 | 2013 |
| 548 | 604 | 674 | 672 | 716 | 754 | 848 | 847 | 1,037 | 957 | 852 | 844 | 813 | 799 | |
| 575 | 643 | 699 | 717 | 782 | 786 | 869 | 931 | 1,074 | 968 | 934 | 931 | 920 | 913 | |
| 572 | 634 | 674 | 742 | 876 | 963 | 1,063 | 1,265 | 1,344 | 1,273 | 1,259 | 1,202 | 1,208 | 1,220 | |
| 1,401 | 1,597 | 1,783 | 1,935 | 2,137 | 2,240 | 2,410 | 2,654 | 2,826 | 2,754 | 2,773 | 2,704 | 2,633 | 2,641 | |
| 587 | 715 | 783 | 752 | 770 | 839 | 940 | 1,052 | 1,127 | 1,009 | 979 | 991 | 968 | 975 | |
| 684 | 733 | 793 | 793 | 810 | 872 | 1,017 | 1,103 | 1,169 | 1,121 | 1,058 | 984 | 1,052 | 1,002 | |
| 571 | 660 | 685 | 703 | 721 | 834 | 879 | 984 | 1,011 | 897 | 824 | 836 | 823 | 835 | |
| 242 | 259 | 316 | 384 | 521 | 398 | 418 | 411 | 492 | 435 | 424 | 410 | 388 | 386 | |
| 520 | 575 | 651 | 655 | 693 | 725 | 836 | 894 | 1,057 | 984 | 951 | 963 | 958 | 962 | |
| 1,370 | 1,499 | 1,699 | 1,710 | 1,884 | 1,999 | 2,193 | 2,538 | 2,844 | 2,590 | 2,527 | 2,520 | 2,452 | 2,443 | |
| 337 | 371 | 395 | 428 | 456 | 472 | 484 | 541 | 557 | 510 | 504 | 489 | 468 | 463 | |
| 2,040 | 2,067 | 2,185 | 2,440 | 2,586 | 2,952 | 3,222 | 3,406 | 3,864 | 3,744 | 3,716 | 3,768 | 3,873 | 3,810 | |
| 917 | 938 | 971 | 978 | 1,026 | 1,140 | 1,318 | 1,269 | 1,470 | 1,432 | 1,409 | 1,411 | 1,380 | 1,307 | |
| 1,883 | 2,077 | 2,267 | 2,446 | 2,813 | 3,006 | 3,324 | 3,847 | 4,058 | 3,837 | 3,796 | 3,672 | 3,583 | 3,571 | |
| 416 | 447 | 506 | 570 | 647 | 742 | 751 | 892 | 932 | 826 | 866 | 865 | 847 | 856 | |
| 898 | 1,001 | 1,141 | 1,161 | 1,150 | 1,221 | 1,372 | 1,490 | 1,700 | 1,592 | 1,470 | 1,457 | 1,454 | 1,468 | |
| 378 | 34 | 465 | 478 | 493 | 497 | 584 | 616 | 661 | 561 | 528 | 536 | 520 | 502 | |
| 651 | 723 | 795 | 836 | 889 | 964 | 1,098 | 1,144 | 1,318 | 1,180 | 1,109 | 1,113 | 1,065 | 1,059 | |
| 623 | 731 | 825 | 962 | 1,035 | 1,139 | 1,184 | 1,380 | 1,580 | 1,474 | 1,435 | 1,414 | 1,398 | 1,402 | |
| 1,301 | 1,293 | 1,599 | 1,658 | 1,825 | 2,043 | 2,085 | 2,392 | 2,627 | 2,560 | 2,458 | 2,474 | 2,481 | 2,480 | |
| 6,632 | 7,537 | 8,205 | 8,991 | 9,927 | 11,138 | 12,208 | 13,176 | 14,622 | 14,079 | 15,149 | 14,634 | 14,675 | 14,423 | |
| Source: Croatian Bureau of Statistics[78][79][80][81][82][83][84][85] | ||||||||||||||
| Counties of Croatia by GDP per capita, in Euro | ||||||||||||||
|---|---|---|---|---|---|---|---|---|---|---|---|---|---|---|
| County | 2000 | 2001 | 2002 | 2003 | 2004 | 2005 | 2006 | 2007 | 2008 | 2009 | 2010 | 2011 | 2012 | 2013 |
| 4,105 | 4,550 | 5,108 | 5,135 | 5,510 | 5,848 | 6,634 | 6,691 | 8,255 | 7,677 | 7,059 | 7,062 | 6,879 | 6,838 | |
| 3,260 | 3,633 | 3,955 | 4,065 | 4,452 | 4,487 | 4,972 | 5,345 | 6,183 | 5,606 | 5,852 | 5,882 | 5,853 | 5,858 | |
| 4,679 | 5,146 | 5,456 | 5,990 | 7,059 | 7,719 | 8,482 | 10,042 | 10,601 | 9,990 | 10,265 | 9,807 | 9,861 | 9,969 | |
| 6,828 | 7,728 | 8,597 | 9,275 | 10,192 | 10,628 | 11,377 | 12,463 | 13,195 | 12,810 | 13,298 | 12,991 | 12,677 | 12,711 | |
| 4,124 | 5,054 | 5,581 | 5,408 | 5,580 | 6,125 | 6,923 | 7,825 | 8,451 | 7,634 | 7,539 | 7,709 | 7,621 | 7,763 | |
| 5,487 | 5,894 | 5,406 | 6,441 | 6,620 | 7,157 | 8,386 | 9,142 | 9,730 | 9,371 | 9,108 | 8,524 | 9,156 | 8,768 | |
| 3,995 | 4,639 | 4,843 | 5,001 | 5,161 | 5,993 | 6,345 | 7,144 | 7,377 | 6,576 | 6,174 | 6,300 | 6,246 | 6,380 | |
| 4,478 | 4,822 | 5,941 | 7,249 | 9,892 | 7,603 | 8,074 | 8,039 | 9,725 | 8,707 | 8,243 | 8,081 | 7,764 | 7,841 | |
| 4,397 | 4,855 | 5,494 | 5,535 | 5,855 | 6,125 | 7,074 | 7,581 | 8,960 | 8,349 | 8,353 | 8,459 | 8,436 | 8,481 | |
| 4,147 | 4,537 | 5,149 | 5,199 | 5,750 | 6,127 | 6,757 | 7,875 | 8,871 | 8,112 | 8,246 | 8,271 | 8,093 | 8,121 | |
| 3,934 | 4,320 | 4,610 | 5,020 | 5,383 | 5,605 | 5,786 | 6,505 | 6,750 | 6,229 | 6,404 | 6,281 | 6,101 | 6,102 | |
| 6,682 | 6,765 | 7,155 | 7,997 | 8,474 | 9,674 | 10,560 | 11,177 | 12,680 | 12,305 | 12,515 | 12,724 | 13,110 | 12,930 | |
| 4,949 | 5,067 | 5,274 | 5,349 | 5,654 | 6,331 | 7,391 | 7,200 | 8,432 | 8,325 | 8,079 | 8,214 | 8,148 | 7,842 | |
| 4,097 | 4,468 | 4,840 | 5,192 | 5,935 | 6,298 | 6,932 | 8,003 | 8,422 | 7,952 | 8,340 | 8,072 | 7,875 | 7,849 | |
| 3,710 | 3,953 | 4,466 | 5,019 | 5,691 | 6,513 | 6,575 | 7,799 | 8,156 | 7,239 | 7,848 | 7,930 | 7,869 | 8,051 | |
| 4,852 | 5,422 | 6,198 | 6,338 | 6,305 | 6,711 | 7,552 | 8,223 | 9,404 | 8,834 | 8,338 | 8,285 | 8,300 | 8,415 | |
| 4,045 | 4,654 | 5,016 | 5,176 | 5,410 | 5,485 | 6,497 | 6,923 | 7,485 | 6,399 | 6,179 | 6,333 | 6,199 | 6,043 | |
| 3,184 | 3,528 | 3,903 | 4,127 | 4,414 | 4,807 | 5,501 | 5,756 | 6,647 | 5,974 | 6,123 | 6,217 | 5,996 | 6,025 | |
| 3,872 | 4,497 | 5,027 | 5,806 | 6,198 | 6,731 | 6,918 | 7,980 | 9,051 | 8,388 | 8,460 | 8,302 | 8,169 | 8,173 | |
| 4,236 | 4,166 | 5,111 | 5,249 | 5,731 | 6,368 | 6,458 | 7,360 | 8,036 | 7,803 | 7,755 | 7,786 | 7,791 | 7,781 | |
| 8,532 | 9,674 | 10,529 | 11,527 | 12,701 | 14,216 | 15,567 | 16,766 | 18,554 | 17,814 | 19,211 | 18,503 | 18,506 | 18,132 | |
| Source: Croatian Bureau of Statistics[78][79][80][81][82][83][84][85] | ||||||||||||||
See also
 | |
|---|---|
| Life in Croatia | |
|
• Architecture |
• Geography |
References
- 1 2 3 4 http://www.dzs.hr
- ↑ "Report for Selected Countries and Subjects". IMF.
- ↑ "GDP per capita, PPP (current international $) - Croatia".
- ↑ http://ec.europa.eu/economy_finance/eu/forecasts/2015_winter/hr_en.pdf
- ↑ "Poverty indicators, 2014". Croatian Bureau of Statistics.
- ↑ "Gini coefficient of equivalised disposable income (source: SILC)". Eurostat Data Explorer. Retrieved 13 August 2013.
- ↑ "Human Development Report 2015" (PDF). United Nations. 2015. Retrieved 14 December 2015.
- 1 2 Average Net Earnings from Croatian Bureau of Statistics
- ↑ "Doing Business in Croatia 2012". World Bank. Retrieved 2011-11-21.
- ↑ Eurostat: General government gross debt - quarterly data
- ↑ Eurostat: General government deficit (-) and surplus (+) - annual data
- 1 2 CIA - The World Factbook: Country Comparison to the World - Budget
- ↑ "Sovereigns rating list". Standard & Poor's. Retrieved 26 May 2011.
- ↑
- ↑ Top Destinations for 2005
- ↑ "Advantages of Croatia Company Registration". Healy Consultants. Retrieved 5 February 2015.
- ↑ Mariann Nagy - Croatia in the Economic Structure of the Habsburg Empire in the Light of the 1857 Census, p. 81-82
- ↑ Mariann Nagy - Croatia in the Economic Structure of the Habsburg Empire in the Light of the 1857 Census, p. 88
- ↑ Society for the Diffusion of Useful Knowledge: The Penny Cyclopaedia of the Society for the Diffusion of Useful Knowledge, vol 22, p. 100-101
- ↑ Mikulas Teich, Roy Porter: The Industrial Revolution in National Context: Europe and the USA, Cambridge University Press, 1996, p. 310
- ↑ Mikulas Teich, Roy Porter: The Industrial Revolution in National Context: Europe and the USA, Cambridge University Press, 1996, p. 311
- ↑ Tanner, Marcus (2001). Croatia: a nation forged in war (2nd ed.). New Haven; London: Yale University Press. p. 110. ISBN 0-300-09125-7.
- 1 2 3 Richard C. Frucht: Eastern Europe: An Introduction to the People, Land, and Culture, p. 462-463
- ↑ The First Yugoslavia: Search for a Viable Political System, Hoover Press, 1983, p. 72
- ↑ Rory Yeomans:Visions of Annihilation: The Ustasha Regime and the Cultural Politics of Fascism, 1941-1945, University of Pittsburgh Pre, 2013, p. 197
- ↑ Hrvoje Matković: Povijest nezavisne države Hrvatske, Drugo, dopunjeno izdanje Zagreb, 2002., p. 118
- ↑ Jozo Tomašević: Rat i revolucija u Jugoslaviji 1941-1945, 2010, p. 785
- ↑ The Library of Congress Country Studies; CIA World Factbook
- ↑ Ivo Nejašmić: Hrvatski građani na radu u inozemstvu: razmatranje popisnih podataka 1971, 1981. i 1991.
- ↑ Europa Publications Limited. Eastern Europe and the Commonwealth of Independent States 1999: 1999. Routledge, 1999. (pg. 279)
- 1 2 3 International Business Publications: Croatia Investment and Trade Laws and Regulations Handbook, p. 22
- ↑ CIA - The World Factbook 2000 - Croatia
- 1 2 3 4 Istvan Benczes: Deficit and Debt in Transition: The Political Economy of Public Finances in Central and Eastern Europe, Central European University Press, 2014, p. 203
- ↑ Eastern Europe: An Introduction to the People, Land, and Culture, p. 473
- 1 2 Istvan Benczes: Deficit and Debt in Transition: The Political Economy of Public Finances in Central and Eastern Europe, Central European University Press, 2014, p. 205-206
- ↑ OECD: Agricultural Policies in Emerging and Transition Economies 1999, p. 43
- 1 2 National Accounts Main Aggregates Database
- 1 2 Gale Research: Countries of the World and Their Leaders: Yearbook 2001, p. 456
- ↑ Istvan Benczes:Deficit and Debt in Transition: The Political Economy of Public Finances in Central and Eastern Europe, Central European University Press, 2014, p. 207
- ↑ CIA Factbook - Croatia
- ↑ Richard C. Frucht: Eastern Europe: An Introduction to the People, Land, and Culture, p. 468
- 1 2 http://euce.org/eusa/2011/papers/2f_adams.pdf
- 1 2 Eurostat: Unemployment rate by sex and age groups - annual average
- ↑ http://www.qfinance.com/country-profiles/croatia
- 1 2 2015 Index of Economic Freedom - Croatia
- 1 2 Martina Dalić (2013): “Croatia: A Prolonged Crisis without Recovery” in Novotny Vitt (ed.) “From Reform to Growth: Managing the Economic Crisis in Europe”, Centre for European Studies, Brussels, May/2013, p. 67-88
- ↑ http://www.balkaninsight.com/en/article/croatia-loses-battle-with-crisis
- ↑ Ekonomski Indikatori
- ↑ http://www.dzs.hr/Hrv_Eng/publication/2011/14-01-02_01_2011.htm
- ↑ http://www.balkaninsight.com/en/article/fitch-unexpectedly-improves-croatian-economic-outlook
- ↑ Per capita GDP
- ↑ List of countries in Europe by monthly average wage
- ↑ Tomislav Pili; Davor Verković (1 October 2011). "Iako čini gotovo petinu BDP-a, i dalje niskoprofitabilna grana domaće privrede" [Even though it comprises nearly a fifth of the GDP, it is still a low-profit branch of the national economy]. Vjesnik (in Croatian). Archived from the original on 14 June 2012. Retrieved 20 October 2011.
- ↑ "Turistički prihod porast će prvi put nakon 2008." [Tourist income to rise for the first time since 2008]. t-portal.hr (in Croatian). T-Hrvatski Telekom. 14 September 2011. Retrieved 21 October 2011.
- ↑ "History of Opatija". Opatija Tourist Board. Retrieved 21 October 2011.
- ↑ "Activities and attractions". Croatian National Tourist Board. Retrieved 21 October 2011.
- ↑ "Croatia". Foundation for Environmental Education. Retrieved 21 October 2011.
- ↑ "UNWTO World Tourism Barometer" (PDF). October 2007. Retrieved 23 April 2008.
- ↑ "Croatian highlights, Croatia". Euro-poi.com. Retrieved 26 March 2013.
- 1 2 3 Tanja Poletan Jugović (11 April 2006). "The integration of the Republic of Croatia into the Pan-European transport corridor network". Pomorstvo. University of Rijeka, Faculty of Maritime Studies. 20 (1): 49–65. Retrieved 14 October 2010.
- ↑ "Odluka o razvrstavanju javnih cesta u autoceste" [Decision on classification of public roads as motorways]. Narodne Novine (in Croatian). 25 July 2007. Retrieved 18 October 2010.
- ↑ "Odluka o izmjenama i dopunama odluke o razvrstavanju javnih cesta u autoceste" [Decision on amendments and additions to the Decision on classification of public roads as motorways]. Narodne Novine (in Croatian). 30 January 2009. Retrieved 18 October 2010.
- ↑ "Traffic counting on the roadways of Croatia in 2009 – digest" (PDF). Hrvatske ceste. Retrieved 1 May 2010.
- ↑ "EuroTest". Eurotestmobility.com. Retrieved 3 January 2009.
- ↑ "Brinje Tunnel Best European Tunnel". Javno.com. Retrieved 3 January 2009.
- ↑ Tomislav Pili (10 May 2011). "Skuplje korištenje pruga uništava HŽ" [More Expensive Railway Fees Ruin Croatian Railways]. Vjesnik (in Croatian). Archived from the original on 14 June 2012. Retrieved 26 October 2011.
- ↑ "Air transport". Ministry of the Sea, Transport and Infrastructure (Croatia). Retrieved 10 October 2011.
- ↑ "FAA Raises Safety Rating for Croatia". Federal Aviation Administration. 26 January 2011. Retrieved 27 January 2011.
- ↑ "Riječka luka –jadranski "prolaz" prema Europi" [The Port of Rijeka – Adriatic "gateway" to Europe] (in Croatian). World Bank. 3 March 2006. Retrieved 13 October 2011.
- ↑ "Luke" [Ports] (in Croatian). Ministry of the Sea, Transport and Infrastructure (Croatia). Retrieved 24 August 2011.
- ↑ "Plovidbeni red za 2011. godinu" [Sailing Schedule for Year 2011] (in Croatian). Agencija za obalni linijski pomorski promet. Retrieved 27 August 2011.
- ↑ "The JANAF system". Jadranski naftovod. Retrieved 8 October 2011.
- ↑ "Transportni sustav" [Transport system] (in Croatian). Plinacro. Retrieved 8 October 2011.
- ↑ "2010 – Statistical Yearbook of the Republic of Croatia" (PDF). Croatian Bureau of Statistics. December 2010. Retrieved 7 October 2011.
- ↑ "Croatia, Slovenia's nuclear plant safe: Croatian president". EU Business. 28 March 2011. Retrieved 8 October 2011.
- ↑ Najveći gubitnici i dobitnici proračuna: Za znanost i obrazovanje 158 milijuna kn manje
- 1 2 "Gross domestic product for Republic of Croatia, statistical regions at level 2 and counties, 2009". Priopćenje DZS. Zagreb: Croatian Bureau of Statistics. 49 (12.1.2). 14 March 2012. ISSN 1330-0350.
- 1 2 "Bruto domaći proizvod za Republiku Hrvatsku, prostorne jedinice za statistiku 2. razine i županije od 2000. do 2006." [Gross domestic product of the Republic of Croatia, 2nd tier spatial units and counties, from 2000 to 2006]. Priopćenja 2002–2007 (in Croatian). Zagreb: Croatian Bureau of Statistics. 46 (12.1.5). 3 July 2009. ISSN 1334-0565. Retrieved 8 July 2012.
- 1 2 "Gross domestic product for Republic of Croatia, statistical regions at level 2 and counties, 2007". Priopćenje DZS. Zagreb: Croatian Bureau of Statistics. 47 (12.1.2). 1 March 2010. ISSN 1330-0350.
- 1 2 "Gross domestic product for Republic of Croatia, statistical regions at level 2 and counties, 2008". Priopćenje DZS. Zagreb: Croatian Bureau of Statistics. 48 (12.1.2). 11 February 2011. ISSN 1330-0350.
- 1 2 "GROSS DOMESTIC PRODUCT FOR REPUBLIC OF CROATIA, PER CAPITA, NUTS 2 LEVEL AND COUNTIES". GROSS DOMESTIC PRODUCT – REVIEW BY COUNTIES. Zagreb: Croatian Bureau of Statistics. December 2015. Retrieved 30 October 2016.
- 1 2 "Gross domestic product for Republic of Croatia, statistical regions at level 2 and counties, 2011". Priopćenje DZS 2011. Zagreb: Croatian Bureau of Statistics. 51 (12.1.2). 14 February 2014. ISSN 1330-0350. Retrieved 14 July 2015.
- 1 2 "Gross domestic product for Republic of Croatia, statistical regions at level 2 and counties, 2012". Priopćenje DZS. Zagreb: Croatian Bureau of Statistics (12.1.6). 13 March 2015. ISSN 1330-0350.
- 1 2 "Gross domestic product for Republic of Croatia, statistical regions at level 2 and counties, 2013". Priopćenje DZS. Zagreb: Croatian Bureau of Statistics (12.1.3). 15 February 2016. ISSN 1330-0350.
External links
| Wikimedia Commons has media related to Economy of Croatia. |
- Croatian National Bank
- Croatian Chamber of Economy
- GDP per inhabitant varied by one to six across the EU27 Member States
- Tariffs applied by Croatia as provided by ITC's Market Access Map, an online database of customs tariffs and market requirements.