East Hampshire District Council elections
East Hampshire District Council in Hampshire England is elected every four years. Since the last boundary changes in 2003, 44 councillors have been elected from 38 wards.
Political control
Since the first election to the council in 1973 political control of the council has been held by the following parties:[1]
| Party in control | Years |
|---|---|
| No overall control | 1973 - 1976 |
| Conservative | 1976 - 1991 |
| No overall control | 1991 - 1995 |
| Liberal Democrats | 1995 - 1999 |
| Conservative | 1999–present |
Council elections
- Petersfield District Council election, 1973
- East Hampshire District Council election, 1976
- East Hampshire District Council election, 1979 (New ward boundaries)[2]
- East Hampshire District Council election, 1983
- East Hampshire District Council election, 1987 (District boundary changes took place but the number of seats remained the same)[3][4]
- East Hampshire District Council election, 1991
- East Hampshire District Council election, 1995 (District boundary changes took place but the number of seats remained the same)[5][6]
- East Hampshire District Council election, 1999
- East Hampshire District Council election, 2003 (New ward boundaries increased the number of seats by 2)[7][8]
- East Hampshire District Council election, 2007
- East Hampshire District Council election, 2011
- East Hampshire District Council election, 2015
District result maps
-
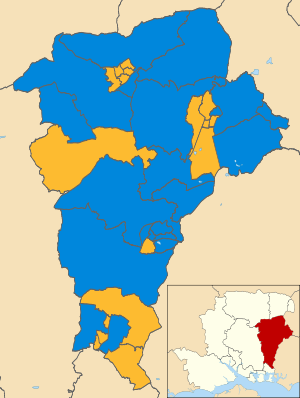
2003 results map
-

2007 results map
-

2011 results map
By-election results
1995-1999
| Party | Candidate | Votes | % | ± | |
|---|---|---|---|---|---|
| Conservative | 277 | 59.1 | |||
| Liberal Democrat | 192 | 40.9 | |||
| Majority | 85 | 18.2 | |||
| Turnout | 469 | 44.8 | |||
| Conservative gain from Independent | Swing | ||||
| Party | Candidate | Votes | % | ± | |
|---|---|---|---|---|---|
| Liberal Democrat | 452 | 54.0 | |||
| Labour | 276 | 33.0 | |||
| Conservative | 108 | 13.0 | |||
| Majority | 176 | 21.0 | |||
| Turnout | 836 | 26.5 | |||
| Liberal Democrat hold | Swing | ||||
| Party | Candidate | Votes | % | ± | |
|---|---|---|---|---|---|
| Conservative | 415 | 60.5 | +8.6 | ||
| Liberal Democrat | 271 | 39.5 | -8.6 | ||
| Majority | 144 | 21.0 | |||
| Turnout | 686 | 45.8 | |||
| Conservative hold | Swing | ||||
| Party | Candidate | Votes | % | ± | |
|---|---|---|---|---|---|
| Liberal Democrat | 824 | 51.1 | +23.7 | ||
| Conservative | 644 | 40.0 | +14.5 | ||
| Labour | 142 | 8.8 | +0.8 | ||
| Majority | 180 | 11.1 | |||
| Turnout | 1,610 | 36.4 | |||
| Liberal Democrat gain from Independent | Swing | ||||
| Party | Candidate | Votes | % | ± | |
|---|---|---|---|---|---|
| Liberal Democrat | 415 | 56.5 | +14.9 | ||
| Conservative | 399 | 39.2 | -16.7 | ||
| Labour | 31 | 4.2 | +4.2 | ||
| Majority | 138 | 17.3 | |||
| Turnout | 734 | 46.6 | |||
| Liberal Democrat hold | Swing | ||||
1999-2003
| Party | Candidate | Votes | % | ± | |
|---|---|---|---|---|---|
| Conservative | 327 | 57.0 | +57.0 | ||
| Liberal Democrat | 247 | 43.0 | +8.5 | ||
| Majority | 80 | 14.0 | |||
| Turnout | 574 | 14.0 | |||
| Conservative gain from Independent | Swing | ||||
| Party | Candidate | Votes | % | ± | |
|---|---|---|---|---|---|
| Liberal Democrat | Anne Claxton | 535 | 53.1 | +11.3 | |
| Conservative | Paul Molloy | 403 | 40.0 | -2.5 | |
| Labour | William Organ | 69 | 6.9 | -8.8 | |
| Majority | 132 | 13.1 | |||
| Turnout | 1,007 | 24.1 | |||
| Liberal Democrat hold | Swing | ||||
2003-2007
| Party | Candidate | Votes | % | ± | |
|---|---|---|---|---|---|
| Liberal Democrat | Marjorie Harvey | 597 | 58.3 | -5.1 | |
| Conservative | Stephen Braden | 427 | 41.7 | +5.1 | |
| Majority | 170 | 16.6 | |||
| Turnout | 1,024 | 49.5 | |||
| Liberal Democrat hold | Swing | ||||
| Party | Candidate | Votes | % | ± | |
|---|---|---|---|---|---|
| Liberal Democrat | John Smith | 1,002 | 77.9 | ||
| Labour | Barbara Burfoot | 285 | 22.1 | ||
| Majority | 717 | 55.8 | |||
| Turnout | 1,287 | ||||
| Liberal Democrat hold | Swing | ||||
| Party | Candidate | Votes | % | ± | |
|---|---|---|---|---|---|
| Liberal Democrat | Philip Drury | 292 | 68.5 | -4.4 | |
| Conservative | Barry Hope | 134 | 31.5 | +4.4 | |
| Majority | 158 | 37.0 | |||
| Turnout | 426 | 24.2 | |||
| Liberal Democrat hold | Swing | ||||
| Party | Candidate | Votes | % | ± | |
|---|---|---|---|---|---|
| Conservative | Gina Logan | 672 | 53.6 | -1.0 | |
| Liberal Democrat | Roger Mullenger | 472 | 37.6 | +6.1 | |
| Labour | Howard Linsley | 110 | 8.8 | -5.1 | |
| Majority | 200 | 16.0 | |||
| Turnout | 1,254 | 32.4 | |||
| Conservative hold | Swing | ||||
| Party | Candidate | Votes | % | ± | |
|---|---|---|---|---|---|
| Liberal Democrat | Samantha Payne | 733 | 57.1 | +3.5 | |
| Conservative | Kenneth Moon | 550 | 42.9 | -3.5 | |
| Majority | 183 | 14.3 | |||
| Turnout | 1,283 | 33.8 | |||
| Liberal Democrat hold | Swing | ||||
| Party | Candidate | Votes | % | ± | |
|---|---|---|---|---|---|
| Liberal Democrat | Tony Muldoon | 214 | 64.7 | +3.7 | |
| Conservative | Colin Leach | 93 | 28.1 | -10.9 | |
| Labour | Catriona Mackenzie | 24 | 7.3 | +7.3 | |
| Majority | 121 | 36.6 | +14.6 | ||
| Turnout | 331 | 16.4 | |||
| Liberal Democrat hold | Swing | ||||
2007-2011
| Party | Candidate | Votes | % | ± | |
|---|---|---|---|---|---|
| Conservative | Glynis Watts | 424 | 54.6 | -13.6 | |
| Liberal Democrat | Dean Phillips | 352 | 45.4 | +21.6 | |
| Majority | 72 | 9.2 | |||
| Turnout | 776 | 35.6 | |||
| Conservative hold | Swing | ||||
2011-2015
| Party | Candidate | Votes | % | ± | |
|---|---|---|---|---|---|
| Conservative | Charles Mouland | 796 | |||
| Conservative | Lynn Ashton | 743 | |||
| Liberal Democrat | Michael Croucher | 404 | |||
| Liberal Democrat | Evelyn Hope | 371 | |||
| Labour | John Tough | 183 | |||
| Green | Neville Taylor | 126 | |||
| Labour | Frank Jones | 117 | |||
| Turnout | 2,740 | 21.3 | |||
| Conservative hold | Swing | ||||
| Conservative hold | Swing | ||||
References
- ↑ "England council elections". BBC News Online. Retrieved 29 August 2011.
- ↑ The District of East Hampshire (Electoral Arrangements) Order 1976
- ↑ The East Hampshire and Havant (Areas) Order 1983
- ↑ The Hampshire (Areas) Order 1985
- ↑ legislation.gov.uk - The Dorset, Hampshire, West Sussex and Wiltshire (County Boundaries) Order 1991. Retrieved on 5 November 2015.
- ↑ legislation.gov.uk - The Hampshire and Surrey (County Boundaries) Order 1991. Retrieved on 5 November 2015.
- ↑ "East Hampshire". BBC News Online. Retrieved 2009-09-01.
- ↑ legislation.gov.uk - The District of East Hampshire (Electoral Changes) Order 2001. Retrieved on 4 October 2015.
- ↑ "Labour and lucky Tories make council gains". guardian.co.uk. 2005-09-16. Retrieved 2009-09-01.
- ↑ "Byelection boost for Labour". guardian.co.uk. 2006-04-28. Retrieved 2009-09-01.
- ↑ "Labour loses Scottish council seat". guardian.co.uk. 2006-09-29. Retrieved 2009-09-01.
- ↑ "Holybourne and Froyle district council by-election". East Hampshire District Council. Retrieved 2009-09-01.
- ↑ "Conservatives triumph in by-elections". easthampshire.org. 16 September 2011. Retrieved 16 September 2011.
External links
This article is issued from Wikipedia - version of the 5/22/2016. The text is available under the Creative Commons Attribution/Share Alike but additional terms may apply for the media files.