East Ham North (UK Parliament constituency)
| East Ham North | |
|---|---|
|
Former Borough constituency for the House of Commons | |
 East Ham North within Essex from 1918 to 1950 | |
| County |
1918–1965: Essex 1965–1974: Greater London |
| 1918–1974 | |
| Number of members | One |
| Replaced by | Newham North East |
| Created from | Romford |
East Ham North was a parliamentary constituency centred on the East Ham district of London, which was in Essex until 1965. It returned one Member of Parliament (MP) to the House of Commons of the Parliament of the United Kingdom, elected by the first past the post voting system.
History
The constituency was created by the Representation of the People Act 1918 for the 1918 general election. It was abolished for the February 1974 general election.
Boundaries
1918-1950: The County Borough of East Ham wards of Manor Park, Plashet East, and Plashet West.
1950-1974: The County Borough of East Ham wards of Kensington, Little Ilford, Manor Park, Plashet, and Woodgrange.
Members of Parliament
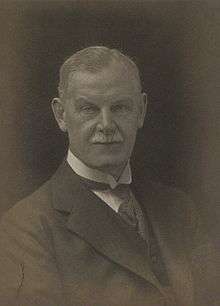
Sir John Bethell
| Election | Member | Party | |
|---|---|---|---|
| 1918 | Sir John Henry Bethell, later Baron Bethell | Liberal | |
| 1922 | Charles Williamson Crook | Conservative | |
| 1923 | Arabella Susan Lawrence | Labour | |
| 1924 | Charles Williamson Crook | Conservative | |
| 1926 by-election | Arabella Susan Lawrence | Labour | |
| 1929 | |||
| 1931 | John Mayhew | Conservative | |
| 1935 | |||
| 1945 | Percy Daines | Labour Co-operative | |
| 1950 | |||
| 1951 | |||
| 1955 | |||
| 1957 by-election | Reg Prentice | Labour | |
| 1959 | |||
| 1964 | |||
| 1966 | |||
| 1970 | |||
| Feb 1974 | constituency abolished | ||
Election results
| Election | Political result | Candidate | Party | Votes | % | ±% | ||
|---|---|---|---|---|---|---|---|---|
| 1918 General Election Electorate: 34,219 Turnout: 16,184 (47.3%) | Coalition Liberal win Majority: 2,688 (16.6%) | Sir John Henry Bethell, Bt. | Coalition Liberal | 9,436 | 58.3 | |||
| William Mann | National Party | 6,748 | 41.7 | |||||
| 1922 General Election Electorate: 34,759 Turnout: 24,262 (69.8%) +22.5 | Conservative gain from Coalition Liberal Majority: 468 (1.9%) | Charles Williamson Crook | Conservative | 7,215 | 29.7 | |||
| Arabella Susan Lawrence | Labour | 6,747 | 27.8 | |||||
| Ernest Edwards | National Liberal | 4,775 | 19.7 | –38.6 | ||||
| Harry Osborn | Independent | 4,021 | 16.6 | |||||
| Joseph Nathaniel Emery | Liberal | 1,504 | 6.2 | |||||
| 1923 General Election Electorate: 35,410 Turnout: 24,431 (69.0%) –0.8 | Labour gain from Conservative Majority: 416 (1.7%) | Arabella Susan Lawrence | Labour | 8,727 | 35.7 | +7.9 | ||
| Ernest Edwards | Liberal | 8,311 | 34.0 | +27.8 | ||||
| Charles Williamson Crook | Conservative | 7,393 | 30.3 | +0.6 | ||||
| 1924 General Election Electorate: 36,496 Turnout: 28,301 (77.5%) +8.5 | Conservative gain from Labour Majority: 1,057 (3.8%) | Charles Williamson Crook | Conservative | 11,194 | 39.6 | +9.3 | ||
| Arabella Susan Lawrence | Labour | 10,137 | 35.8 | +0.1 | ||||
| Ernest Edwards | Liberal | 6,970 | 24.6 | –9.4 | ||||
| 29 April 1926 by-election Charles Williamson Crook died on 29 March 1926 Electorate: 37,057 Turnout: 26,572 (71.7%) –5.8 | Labour gain from Conservative Majority: 1,627 (6.2%) | Arabella Susan Lawrence | Labour | 10,798 | 40.7 | +4.9 | ||
| George William Symonds Jarrett | Conservative | 9,171 | 34.5 | –5.1 | ||||
| Edward Leslie Burgin | Liberal | 6,603 | 24.8 | +0.2 | ||||
| 1929 General Election Electorate: 46,165 Turnout: 33,233 (72.0%) –4.5 | Labour hold Majority: 2,164 (6.6%) | Arabella Susan Lawrence | Labour | 13,969 | 42.1 | +6.3 | ||
| John Lees-Jones | Conservative | 11,805 | 35.5 | –4.1 | ||||
| Thomas Arnold Evans | Liberal | 7,459 | 22.4 | –2.2 | ||||
| 1931 General Election Electorate: 47,002 Turnout: 34,499 (73.4%) +1.4 | Conservative gain from Labour Majority: 10,961 (31.8%) | Lt.-Col. John Dixon Mayhew, TD | Conservative | 22,730 | 65.9 | +30.4 | ||
| Arabella Susan Lawrence | Labour | 11,769 | 34.1 | –8.0 | ||||
| 1935 General Election Electorate: 46,252 Turnout: 30,057 (65.0%) –8.4 | Conservative hold Majority: 533 (1.8%) | Lt.-Col. John Dixon Mayhew, TD | Conservative | 15,295 | 50.9 | –15.0 | ||
| Thomas William Burden | Labour | 14,762 | 49.1 | +15.0 | ||||
| 1945 General Election Electorate: 36,794 Turnout: 26,187 (71.2%) +6.2 | Labour Co-op gain from Conservative Majority: 10,559 (40.4%) | Percy Daines | Labour Co-op | 18,373 | 70.2 | +21.1 | ||
| Lt.-Col. Sir John Dixon Mayhew, TD, JP, DL | Conservative | 7,814 | 29.8 | –21.1 | ||||
| 1950 General Election Electorate: 42,624 Turnout: 35,874 (84.2%) +13.0 | Labour Co-op hold Majority: 8,641 (24.2%) | Percy Daines | Labour Co-op | 20,497 | 57.2 | –13.0 | ||
| Lt.-Col. Sir John Dixon Mayhew, TD, JP | Conservative | 11,856 | 33.0 | +3.2 | ||||
| John Joseph Carroll | Liberal | 3,521 | 9.8 | |||||
| 1951 General Election Electorate: 42,662 Turnout: 35,529 (83.3%) –0.9 | Labour Co-op hold Majority: 7,359 (20.8%) | Percy Daines | Labour Co-op | 21,444 | 60.4 | +3.2 | ||
| James Dundas Hamilton | Conservative | 14,085 | 39.6 | +6.6 | ||||
| 1955 General Election Electorate: 40,548 Turnout: 30,377 (74.9%) –8.4 | Labour Co-op hold Majority: 5,545 (18.2%) | Percy Daines | Labour Co-op | 17,961 | 59.1 | –1.3 | ||
| Arnold Silverstone | Conservative | 12,416 | 40.9 | +1.3 | ||||
| 30 May 1957 by-election[1] Percy Daines died on 3 March 1957 Electorate: 38,920 Turnout: 22,301 (57.3%) –17.6 | Labour hold Majority: 5,979 (26.9%) | Reginald Ernest Prentice | Labour | 12,546 | 56.3 | –2.8 | ||
| John Henry Samuel Bangay | Conservative | 6,567 | 29.4 | –11.5 | ||||
| Edward Drewett Martell | People's League | 2,730 | 12.2 | |||||
| William Henry Christopher | Ind. Labour Party | 458 | 2.1 | |||||
| 1959 General Election Electorate: 38,014 Turnout: 28,176 (74.1%) –0.8 | Labour hold Majority: 3,826 (13.6%) | Reginald Ernest Prentice | Labour | 16,001 | 56.8 | –2.3 | ||
| John Henry Samuel Bangay | Conservative | 12,175 | 43.2 | +2.3 | ||||
| 1964 General Election Electorate: 35,656 Turnout: 24,025 (67.4%) –6.7 | Labour hold Majority: 4,977 (20.8%) | Reginald Ernest Prentice | Labour | 14,501 | 60.4 | +3.6 | ||
| John Henry Samuel Bangay | Conservative | 9,524 | 39.6 | –3.6 | ||||
| 1966 General Election Electorate: 35,016 Turnout: 22,640 (64.7%) –2.7 | Labour hold Majority: 7,182 (31.8%) | Reginald Ernest Prentice | Labour | 14,911 | 65.9 | +5.5 | ||
| Laurence Giovene | Conservative | 7,729 | 34.1 | –5.5 | ||||
| 1970 General Election Electorate: 36,695 Turnout: 19,292 (52.6%) –12.1 | Labour hold Majority: 3,822 (19.8%) | Rt Hon Reginald Ernest Prentice | Labour | 11,557 | 59.9 | –6.0 | ||
| David Neil Macfarlane | Conservative | 7,735 | 40.1 | +6.0 | ||||
References
- Craig, F. W. S. (1983) [1969]. British parliamentary election results 1918-1949 (3rd ed.). Chichester: Parliamentary Research Services. ISBN 0-900178-06-X.
- Leigh Rayment's Historical List of MPs – Constituencies beginning with "E" (part 1)
Notes
This article is issued from Wikipedia - version of the 9/27/2015. The text is available under the Creative Commons Attribution/Share Alike but additional terms may apply for the media files.