Dover (UK Parliament constituency)
| Dover | |
|---|---|
|
County constituency for the House of Commons | |
|
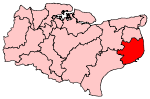
Boundary of Dover in Kent. | |
|
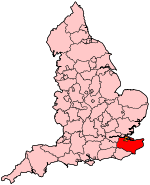
Location of Kent within England. | |
| County | Kent |
| Electorate | 71,993 (December 2010)[1] |
| Major settlements | Dover and Deal |
| Current constituency | |
| Created | 1369 |
| Member of parliament | Charlie Elphicke (Conservative) |
| Number of members |
1660 - 1885: Two 1885 - present: One |
| Overlaps | |
| European Parliament constituency | South East England |
Dover is a constituency represented in the House of Commons of the Parliament of the United Kingdom. It elects one Member of Parliament (MP) by the first past the post system of election.
Boundaries
1918-1950: The Municipal Boroughs of Deal and Dover, the Urban District of Walmer, and the Rural Districts of Dover and Eastry.
1950-1983: The Municipal Boroughs of Deal, Dover, and Sandwich, the Rural District of Dover, and part of the Rural District of Eastry.
1983-2010: The District of Dover wards of Aylesham, Barton, Buckland, Capel-le-Ferne, Castle, Cornilo, Eastry, Eythorne, Lower Walmer, Lydden and Temple Ewell, Maxton and Elms Vale, Middle Deal, Mill Hill, Mongeham, Noninstone, North Deal, Pineham, Priory, Ringwould, River, St Margaret's-at-Cliffe, St Radigund's, Shepherdswell with Coldred, Tower Hamlets, Town and Pier, and Upper Walmer.
2010-present: The District of Dover wards of Aylesham, Buckland, Capel-le-Ferne, Castle, Eastry, Eythorne and Shepherdswell, Lydden and Temple Ewell, Maxton, Elms Vale and Priory, Middle Deal and Sholden, Mill Hill, North Deal, Ringwould, River, St Margaret's-at-Cliffe, St Radigund's, Tower Hamlets, Town and Pier, Walmer, and Whitfield.
Dover constituency consists of the greater part of Dover District comprising the towns of Deal, Dover and Walmer together with surrounding villages. It excludes the northern area around the ancient Cinque Port of Sandwich, which together with surrounding villages is part of the South Thanet constituency but was in this constituency between the redistributions for the 1950 and 1983 general elections. It has been a traditional Tory-Labour marginal, with Conservative-voting rural areas competing against mainly Labour-voting Dover itself, plus some former mining villages in the former Kent coalfield, such as Aylesham. Labour held on very solidly here in 2005, with virtually no swing from the previous general election, but the seat went Conservative in the 2010 election on a swing of 10.4% compared to a 4.9% swing nationally.
Members of Parliament
Cinque Port/Parliamentary Borough 1368–1918
MPs 1368–1660
No parliament called between 1629 and 1640
| Parliament | First member | Second member |
|---|---|---|
| 1640 (Apr) | Sir Edward Boys | Sir Peter Heyman |
| 1640 (Nov) | Sir Edward Boys | Benjamin Weston |
| 1645 | John Dixwell | Benjamin Weston |
| 1648 | John Dixwell | Benjamin Weston |
| 1653 | Dover not represented in Barebones Parliament | |
| 1654 | William Cullen | one seat only |
| 1656 | Thomas Kelsey | one seat only |
| 1658 | John Dixwell | Thomas Kelsey |
| 1659 | John Dixwell | Benjamin Weston |
MPs 1660–1885
MPs 1885–1918
| Year | Member[6] | Party | |
|---|---|---|---|
| 1885 | Alexander George Dickson | Conservative | |
| 1889 | George Wyndham | Conservative | |
| 1913 | Viscount Duncannon | Conservative | |
| 1918 | Constituency abolished – name transferred to county constituency | ||
County constituency 1918–present
| Year | Member[6] | Party | |
|---|---|---|---|
| Dover division of Kent | |||
| 1918 | Viscount Duncannon | Coalition Conservative | |
| 1921 | Sir Thomas Polson | Independent Parliamentary Group | |
| 1922 | John Jacob Astor | Conservative | |
| 1945 | John Thomas | Labour | |
| 1950 | John Arbuthnot | Conservative | |
| 1964 | David Ennals | Labour | |
| 1970 | Peter Rees | Conservative | |
| Dover and Deal County Constituency | |||
| 1974 | Peter Rees | Conservative | |
| Dover County Constituency | |||
| 1983 | Peter Rees | Conservative | |
| 1987 | David Shaw | Conservative | |
| 1997 | Gwyn Prosser | Labour | |
| 2010 | Charlie Elphicke | Conservative | |
Elections
Elections in the 2010s
| Party | Candidate | Votes | % | ± | |
|---|---|---|---|---|---|
| Conservative | Charlie Elphicke | 21,737 | 43.3 | -0.7 | |
| Labour | Clair Hawkins | 15,443 | 30.7 | -2.8 | |
| UKIP | David Little | 10,177 | 20.3 | +16.8 | |
| Liberal Democrat | Sarah Smith | 1,572 | 3.1 | -12.7 | |
| Green | Jolyon Trimingham[12] | 1,295 | 2.6 | N/A | |
| Majority | 6,294 | 12.5 | +2.0 | ||
| Turnout | 50,224 | 68.9 | -1.2 | ||
| Conservative hold | Swing | +1.8 | |||
| Party | Candidate | Votes | % | ± | |
|---|---|---|---|---|---|
| Conservative | Charlie Elphicke | 22,174 | 44.0 | +9.1 | |
| Labour | Gwyn Prosser | 16,900 | 33.5 | -11.8 | |
| Liberal Democrat | John Brigden | 7,962 | 15.8 | +0.0 | |
| UKIP | Victor Matcham | 1,747 | 3.5 | +0.8 | |
| BNP | Dennis Whiting | 1,104 | 2.2 | N/A | |
| English Democrat | Mike Walters | 216 | 0.4 | N/A | |
| Christian Peoples | David Clark | 200 | 0.4 | N/A | |
| Independent | George Lee-Delisle | 82 | 0.2 | N/A | |
| Majority | 5,274 | 10.5 | |||
| Turnout | 50,385 | 70.1 | +2.8 | ||
| Conservative gain from Labour | Swing | +10.4 | |||
Elections in the 2000s
| Party | Candidate | Votes | % | ± | |
|---|---|---|---|---|---|
| Labour | Gwyn Prosser | 21,680 | 45.3 | -3.5 | |
| Conservative | Paul Watkins | 16,739 | 35.0 | -2.2 | |
| Liberal Democrat | Antony Hook | 7,607 | 15.9 | +4.5 | |
| UKIP | Mike Wiltshire | 1,252 | 2.6 | +0.1 | |
| Independent | Victor Matcham | 606 | 1.3 | +1.3 | |
| Majority | 4,941 | 10.3 | |||
| Turnout | 47,884 | 67.6 | 2.5 | ||
| Labour hold | Swing | -0.6 | |||
| Party | Candidate | Votes | % | ± | |
|---|---|---|---|---|---|
| Labour | Gwyn Prosser | 21,943 | 48.8 | -5.7 | |
| Conservative | Paul Watkins | 16,744 | 37.2 | +4.4 | |
| Liberal Democrat | Antony Hook | 5,131 | 11.4 | +3.5 | |
| UKIP | Lee Speakman | 1,142 | 2.5 | +1.7 | |
| Majority | 5,199 | 11.6 | |||
| Turnout | 44,960 | 65.1 | -13.7 | ||
| Labour hold | Swing | ||||
Elections in the 1990s
| Party | Candidate | Votes | % | ± | |
|---|---|---|---|---|---|
| Labour | Gwyn Prosser | 29,535 | 54.5 | ||
| Conservative | David Shaw | 17,796 | 32.8 | ||
| Liberal Democrat | Mark B. Corney | 4,302 | 7.9 | ||
| Referendum | Mrs. Susan L. Anderson | 2,124 | 3.9 | ||
| UKIP | C Hyde | 443 | 0.8 | ||
| Majority | 11,739 | 21.7 | |||
| Turnout | 54,200 | 78.9 | |||
| Labour gain from Conservative | Swing | ||||
| Party | Candidate | Votes | % | ± | |
|---|---|---|---|---|---|
| Conservative | David Shaw | 25,395 | 44.1 | −1.9 | |
| Labour | Gwyn Prosser | 24,562 | 42.6 | +8.5 | |
| Liberal Democrat | MJ Sole | 6,212 | 10.8 | −9.1 | |
| Green | ACW Sullivan | 637 | 1.1 | N/A | |
| Independent Conservative | PW Sherred | 407 | 0.7 | N/A | |
| Independent Conservative | BJ Philp | 250 | 0.4 | N/A | |
| Natural Law | CF Percy | 127 | 0.2 | N/A | |
| Majority | 833 | 1.4 | −10.4 | ||
| Turnout | 57,590 | 83.5 | +3.7 | ||
| Conservative hold | Swing | −5.2 | |||
Elections in the 1980s
| Party | Candidate | Votes | % | ± | |
|---|---|---|---|---|---|
| Conservative | David Shaw | 25,343 | 46.01 | ||
| Labour | Stephen S.E.W. Love | 18,802 | 34.13 | ||
| Social Democratic | Geoffrey Nice | 10,942 | 19.86 | ||
| Majority | 6,541 | 11.87 | |||
| Turnout | 79.84 | ||||
| Conservative hold | Swing | ||||
| Party | Candidate | Votes | % | ± | |
|---|---|---|---|---|---|
| Conservative | Peter Wynford Innes Rees | 25,454 | 48.31 | ||
| Labour | Stephen S.E.W. Love | 16,234 | 30.81 | ||
| Social Democratic | Geoffrey Nice | 10,601 | 20.12 | ||
| Ecology | M Potter | 404 | 0.77 | ||
| Majority | 9,220 | 17.50 | |||
| Turnout | 77.58 | ||||
| Conservative hold | Swing | ||||
Elections in the 1970s
| Party | Candidate | Votes | % | ± | |
|---|---|---|---|---|---|
| Conservative | Peter Wynford Innes Rees | 30,606 | 50.01 | ||
| Labour | Mrs. JL Chapman | 22,664 | 37.04 | ||
| Liberal | J Cohen | 6,906 | 11.29 | ||
| Silly Party | J Fox | 642 | 1.05 | ||
| National Front | P Johnson | 378 | 0.62 | ||
| Majority | 7,942 | 12.98 | |||
| Turnout | 80.65 | ||||
| Conservative hold | Swing | ||||
| Party | Candidate | Votes | % | ± | |
|---|---|---|---|---|---|
| Conservative | Peter Wynford Innes Rees | 25,647 | 43.63 | ||
| Labour | LJA Bishop | 23,353 | 39.74 | ||
| Liberal | RS Young | 9,767 | 16.63 | ||
| Majority | 2,294 | 3.90 | |||
| Turnout | 78.67 | ||||
| Conservative hold | Swing | ||||
| Party | Candidate | Votes | % | ± | |
|---|---|---|---|---|---|
| Conservative | Peter Wynford Innes Rees | 27,033 | 43.11 | ||
| Labour | LJA Bishop | 22,183 | 35.37 | ||
| Liberal | RS Young | 12,832 | 20.46 | ||
| Independent Social Democrat | W Stone | 661 | 1.05 | ||
| Majority | 4,850 | 7.73 | |||
| Turnout | 84.69 | ||||
| Conservative hold | Swing | ||||
| Party | Candidate | Votes | % | ± | |
|---|---|---|---|---|---|
| Conservative | Peter Wynford Innes Rees | 30,103 | 51.41 | ||
| Labour | David Hedley Ennals | 28,454 | 48.59 | ||
| Majority | 1,649 | 2.82 | |||
| Turnout | 80.58 | ||||
| Conservative gain from Labour | Swing | ||||
Elections in the 1960s
| Party | Candidate | Votes | % | ± | |
|---|---|---|---|---|---|
| Labour | David Hedley Ennals | 27,256 | 49.31 | ||
| Conservative | Thomas C G Stacey | 24,040 | 43.49 | ||
| Liberal | Bernard Wilfred Budd | 3,981 | 7.20 | ||
| Majority | 3,216 | 5.82 | |||
| Turnout | 84.18 | ||||
| Labour hold | Swing | ||||
| Party | Candidate | Votes | % | ± | |
|---|---|---|---|---|---|
| Labour | David Hedley Ennals | 24,115 | 44.94 | ||
| Conservative | Sir John Sinclair Wemyss Arbuthnot | 23,697 | 44.17 | ||
| Liberal | Bernard Wilfred Budd | 5,843 | 10.89 | ||
| Majority | 418 | 0.78 | |||
| Turnout | 82.70 | ||||
| Labour gain from Conservative | Swing | ||||
Elections in the 1950s
| Party | Candidate | Votes | % | ± | |
|---|---|---|---|---|---|
| Conservative | John Sinclair Wemyss Arbuthnot | 27,939 | 53.08 | ||
| Labour | Horace W. Lee | 24,698 | 46.92 | ||
| Majority | 3,241 | 6.16 | |||
| Turnout | 82.88 | ||||
| Conservative hold | Swing | ||||
| Party | Candidate | Votes | % | ± | |
|---|---|---|---|---|---|
| Conservative | John Sinclair Wemyss Arbuthnot | 27,316 | 52.92 | ||
| Labour | Horace W. Lee | 24,298 | 47.08 | ||
| Majority | 3,018 | 5.85 | |||
| Turnout | 81.84 | ||||
| Conservative hold | Swing | ||||
| Party | Candidate | Votes | % | ± | |
|---|---|---|---|---|---|
| Conservative | John Sinclair Wemyss Arbuthnot | 28,511 | 53.29 | ||
| Labour | William James Owen | 24,995 | 46.71 | ||
| Majority | 3,516 | 6.57 | |||
| Turnout | 85.74 | ||||
| Conservative hold | Swing | ||||
| Party | Candidate | Votes | % | ± | |
|---|---|---|---|---|---|
| Conservative | John Sinclair Wemyss Arbuthnot | 25,640 | 49.01 | ||
| Labour | William James Owen | 23,331 | 44.59 | ||
| Liberal | Basil E Goldstone | 2,873 | 5.49 | ||
| Communist | R Morrison | 474 | 0.91 | ||
| Majority | 2,309 | 4.41 | |||
| Turnout | 85.77 | ||||
| Conservative gain from Labour | Swing | ||||
Election in the 1940s
| Party | Candidate | Votes | % | ± | |
|---|---|---|---|---|---|
| Labour | John Richard Thomas | 17,373 | 52.54 | ||
| Conservative | John Sinclair Wemyss Arbuthnot | 15,691 | 47.46 | ||
| Majority | 1,682 | 5.09 | |||
| Turnout | 73.29 | ||||
| Labour gain from Conservative | Swing | ||||
Elections in the 1930s
| Party | Candidate | Votes | % | ± | |
|---|---|---|---|---|---|
| Conservative | John Jacob Astor | 25,884 | 63.96 | ||
| Labour | WH Bennett | 14,588 | 36.04 | ||
| Majority | 11,296 | 27.91 | |||
| Turnout | 69.56 | ||||
| Conservative hold | Swing | ||||
| Party | Candidate | Votes | % | ± | |
|---|---|---|---|---|---|
| Conservative | John Jacob Astor | 29,743 | 75.25 | ||
| Labour | W Moore | 9,781 | 24.75 | ||
| Liberal | Herbert James Baxter | withdrew | n/a | n/a | |
| Majority | 19,962 | 50.51 | |||
| Turnout | 73.05 | ||||
| Conservative hold | Swing | ||||
- withdrew on 16th October
Elections in the 1920s
| Party | Candidate | Votes | % | ± | |
|---|---|---|---|---|---|
| Unionist | Hon. John Jacob Astor | 17,745 | 54.7 | ||
| Labour | Ernest Lionel McKeag | 7,646 | 23.6 | ||
| Liberal | Herbert James Baxter | 7,056 | 21.7 | n/a | |
| Majority | 10,099 | 31.1 | |||
| Turnout | |||||
| Unionist hold | Swing | ||||
| Party | Candidate | Votes | % | ± | |
|---|---|---|---|---|---|
| Unionist | Hon. John Jacob Astor | unopposed | n/a | n/a | |
| Unionist hold | Swing | n/a | |||
See also
Notes and references
- ↑ "Electorate Figures - Boundary Commission for England". 2011 Electorate Figures. Boundary Commission for England. 4 March 2011. Retrieved 13 March 2011.
- 1 2 3 4 5 6 7 8 9 10 11 12 13 14 15 16 17 18 19 20 21 22 23 "History of Parliament". History of Parliament Trust. Retrieved 2011-11-28.
- 1 2 3 4 5 6 7 8 9 10 11 12 13 14 15 16 "History of Parliament". History of Parliament Trust. Retrieved 2011-11-28.
- 1 2 3 4 5 6 7 8 9 10 "History of Parliament". History of Parliament Trust. Retrieved 2011-11-28.
- ↑ Dictionary of National Biography, later editions, and Oxford Dictionary of National Biography.
- 1 2 3 4 Leigh Rayment's Historical List of MPs – Constituencies beginning with "D" (part 3)
- ↑ On petition Spragge's election was declared void
- ↑ Created Baron Aylmer (in the Peerage of Ireland), 1718
- ↑ Knighted 1761
- ↑ Thomson was re-elected in 1832 but had also been elected for Manchester, which he chose to represent, and did not sit again for Dover
- ↑ "Election Data 2015". Electoral Calculus. Archived from the original on 17 October 2015. Retrieved 17 October 2015.
- ↑ "Jolyon Trimingham for Dover and Deal". Kent Green Party. Retrieved 21 January 2015.
- ↑ "Election Data 2010". Electoral Calculus. Archived from the original on 17 October 2015. Retrieved 17 October 2015.
- ↑ "Election Data 2005". Electoral Calculus. Archived from the original on 15 October 2011. Retrieved 18 October 2015.
- ↑ "Election Data 2001". Electoral Calculus. Archived from the original on 15 October 2011. Retrieved 18 October 2015.
- ↑ "Election Data 1997". Electoral Calculus. Archived from the original on 15 October 2011. Retrieved 18 October 2015.
- ↑ "Election Data 1992". Electoral Calculus. Archived from the original on 15 October 2011. Retrieved 18 October 2015.
- ↑ "Politics Resources". Election 1992. Politics Resources. 9 April 1992. Retrieved 2010-12-06.
- ↑ "Election Data 1987". Electoral Calculus. Archived from the original on 15 October 2011. Retrieved 18 October 2015.
- ↑ "Election Data 1983". Electoral Calculus. Archived from the original on 15 October 2011. Retrieved 18 October 2015.
- ↑ British Parliamentary Election Results 1918-1949, FWS Craig
- ↑ British Parliamentary Election Results 1918-1949, FWS Craig
Sources
- Robert Beatson, A Chronological Register of Both Houses of Parliament (London: Longman, Hurst, Res & Orme, 1807)
- The Constitutional Year Book for 1913 (London: National Union of Conservative and Unionist Associations, 1913)
- F W S Craig, British Parliamentary Election Results 1832–1885 (2nd edition, Aldershot: Parliamentary Research Services, 1989)
- F W S Craig, British Parliamentary Election Results 1918–1949 (Glasgow: Political Reference Publications, 1969)