Demographics of Ethiopia
| Demographics of Ethiopia | |
|---|---|
| Population | 86,613,986 (2013 est.)(14th) |
| Growth rate | 2.9% (2013 est.) (12th) |
| Birth rate | 33.5 births/1,000 population (2012 est.) |
| Death rate | 7.8 deaths/1,000 population (2012 est.) |
| Life expectancy | 60 years (2013 est.) |
| • male | 57.73 years (2013 est.) |
| • female | 62.35 years (2013 est.) |
| Fertility rate | 4.6 children born/woman (2012 est.) |
| Infant mortality rate | 68 deaths/1,000 live births (2012 est.) |
| Sex ratio | |
| At birth | 1.03 male(s)/female (2013 est.) |
| Under 15 | 1.00 male(s)/female (2009 est.) |
| 15–64 years | 0.99 male(s)/female (2009 est.) |
| 65 and over | 0.95 male(s)/female (2009 est.) |
| Nationality | |
| Major ethnic | See Ethnic Groups of Ethiopia |
| Language | |
| Official | See Languages of Ethiopia |
The demographics of Ethiopia encompass the demographic features of Ethiopia's inhabitants, including ethnicity, languages, population density, education level, health, economic status, religious affiliations and other aspects of the population.
Ethnic groups
The country's population is highly diverse, containing over 80 different ethnic groups. Most people in Ethiopia speak Afroasiatic languages, mainly of the Semitic or Cushitic branches. Among these are the Oromo, Amhara, Somali and Tigray, who together constitute around three-quarters of the population.
Nilo-Saharan-speaking Nilotic ethnic minorities also inhabit the southern regions of the country, particularly in areas bordering South Sudan. Among these are the Mursi and Anuak.
Languages
According to Ethnologue, there are 90 individual languages spoken in Ethiopia.[2] The 1994 Ethiopian census indicates that some 77 tongues were spoken locally. Most of these languages belong to the Afro-Asiatic family (Cushitic and Semitic). Omotic languages are also spoken, though their classification is uncertain. Additionally, Nilo-Saharan languages are spoken by the nation's Nilotic ethnic minorities.
According to the 2007 Ethiopian census, the most widely spoken first languages are: Oromo (33.8%), Amharic (29.33%), Somali (6.25%), and Tigrinya (5.86%).[3]
Amharic 25.7% (as a first language), Oromo 31.6%, Somali 6.5%, Tigrinya 6.1%, Gurage 3.5%, Sidamo 3.5%, other local languages; Arabic, English (major foreign language taught in schools),[4]
Amharic is the only official national language of Ethiopia. It was also the language of primary school instruction, but has been replaced in many areas by local languages such as Oromo and Tigrinya. English is the most widely spoken foreign language, and is taught in all secondary schools.
Religions
Various religions are adhered to in Ethiopia. Most Christians live in the highlands, whereas Muslims mainly inhabit the lowlands. Adherents of traditional faiths are primarily concentrated in the southern regions.
According to the Ethiopian Central Statistical Agency (2007 census), the national religious composition is Ethiopian Orthodox 43.5%, Muslim 33.9%, Protestant 18.6%, traditional 2.6%, Catholic 0.7%, all others 0.6%.[5]
Population
| Historical population | ||
|---|---|---|
| Year | Pop. | ±% p.a. |
| 2011 | 82,101,998 | — |
| 2012 | 84,320,987 | +2.70% |
| 2013 | 86,613,986 | +2.72% |
Source: Central Statistical Agency (CSA)[6]
UN estimates
According to the 2010 revision of the UN's World Population Prospects, the total population was 82,950,000 in 2010, compared to 18,434,000 in 1950. The proportion of children below the age of 15 in 2010 was 41.5%, 55.8% was between 15 and 65 years of age, while 3.3% was 65 years or older.The average age is 25.1. [7]
| Total population (x 1000) | Population aged 0–14 (%) | Population aged 15–64 (%) | Population aged 65+ (%) | |
|---|---|---|---|---|
| 1950 | 18 434 | 44.1 | 52.9 | 3 |
| 1955 | 20 298 | 43.9 | 53.3 | 2.8 |
| 1960 | 22 553 | 43.5 | 53.8 | 2.6 |
| 1965 | 25 480 | 43.5 | 53.9 | 2.6 |
| 1970 | 28 959 | 44.1 | 53.3 | 2.7 |
| 1975 | 32 959 | 44.5 | 52.7 | 2.8 |
| 1980 | 35 426 | 44.5 | 52.6 | 2.9 |
| 1985 | 41 078 | 44.6 | 52.6 | 2.9 |
| 1990 | 48 333 | 45.4 | 52.1 | 2.9 |
| 1995 | 57 042 | 45.9 | 51.2 | 2.9 |
| 2000 | 65 578 | 45.9 | 51.1 | 3.0 |
| 2005 | 74 264 | 44.5 | 52.4 | 3.1 |
| 2010 | 82 950 | 41.5 | 55.2 | 3.3 |
UN projections
Below are the UN's medium variant projections; numbers are in thousands:[7]
- 2015 91,999
- 2020 101,046
- 2025 109,969
- 2030 118,514
- 2035 126,392
- 2040 133,466
- 2045 139,729
- 2050 145,187
Vital statistics
Registration of vital events in Ethiopia is incomplete. The Population Department of the United Nations prepared the following estimates: [7]
| Period | Live births per year | Deaths per year | Natural change per year | CBR | CDR | NC | TFR | IMR |
|---|---|---|---|---|---|---|---|---|
| 1950-1955 | 956 000 | 580 000 | 377 000 | 49.4 | 29.9 | 19.5 | 7.17 | 199 |
| 1955-1960 | 1 027 000 | 572 000 | 455 000 | 47.9 | 26.7 | 21.2 | 6.90 | 181 |
| 1960-1965 | 1 155 000 | 565 000 | 589 000 | 48.1 | 23.5 | 24.5 | 6.90 | 160 |
| 1965-1970 | 1 298 000 | 594 000 | 704 000 | 47.7 | 21.8 | 25.9 | 6.87 | 148 |
| 1970-1975 | 1 450 000 | 638 000 | 812 000 | 46.8 | 20.6 | 26.2 | 6.81 | 140 |
| 1975-1980 | 1 579 000 | 676 000 | 902 000 | 46.2 | 19.8 | 26.4 | 6.76 | 135 |
| 1980-1985 | 1 804 000 | 794 000 | 1 011 000 | 47.2 | 20.8 | 26.4 | 6.94 | 140 |
| 1985-1990 | 2 145 000 | 850 000 | 1 295 000 | 48.0 | 19.0 | 29.0 | 7.06 | 127 |
| 1990-1995 | 2 501 000 | 913 000 | 1 588 000 | 47.5 | 17.3 | 30.1 | 7.00 | 115 |
| 1995-2000 | 2 694 000 | 932 000 | 1 763 000 | 43.9 | 15.2 | 28.7 | 6.48 | 101 |
| 2000-2005 | 2 713 000 | 908 000 | 1 805 000 | 38.8 | 13.0 | 25.8 | 5.60 | 87 |
| 2005-2010 | 2 619 000 | 822 000 | 1 797 000 | 33.3 | 10.5 | 22.9 | 4.60 | 72 |
| 2010-2015 | 3 108 000 | 730 000 | 2 378 000 | 4.59 |
CBR = crude birth rate (per 1,000); CDR = crude death rate (per 1,000); NC = natural change (per 1,000); IMR = infant mortality rate per 1,000 births; TFR = total fertility rate (number of children per woman)
Births and deaths [8]
| Year | Population | Live births | Deaths | Natural increase | Crude birth rate | Crude death rate | Rate of natural increase | TFR |
|---|---|---|---|---|---|---|---|---|
| 2007* | 73 750 932 | 2 218 457 | 839 038 | 1 379 419 | 28,8 | 10,9 | 17,9 | 4,16 |
- Data refer to the 12 months preceding the census in May.
Total Fertility rate in Ethiopia (Census 2007)
As per 2007 Population and Housing Census of Ethiopia [9]
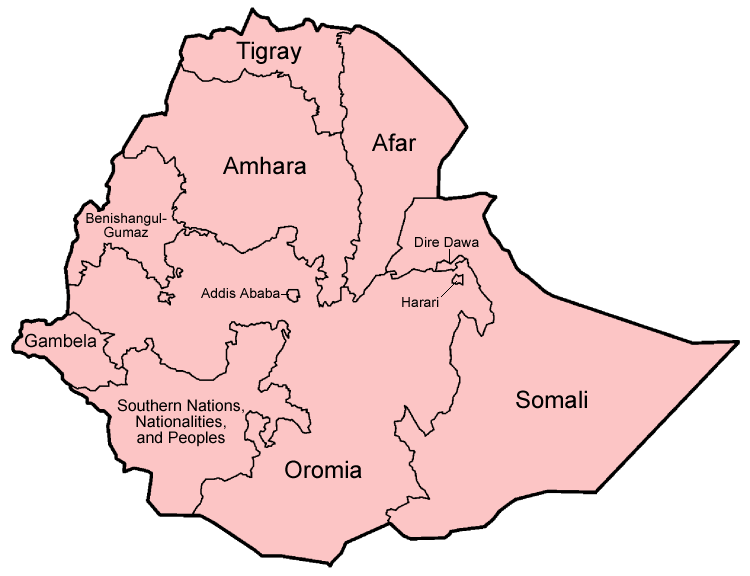
| Region | Urban TFR | Rural TFR | Total TFR (U+R) |
|---|---|---|---|
| Ethiopia (Country Total) | 2,220 | 4,650 | 5.35 |
| Tigray Region | 2.91 | 4.90 | 4.44 |
| Afar Region | 2.44 | 2.00 | 2.07 |
| Amhara Region | 2.13 | 4.54 | 4,17 |
| Oromia Region | 2,635 | 5,235 | 4.84 |
| Somali Region | 2,175 | 1,985 | 2.010 |
| Benishangul - Gumuz Region | 3.00 | 4.80 | 4.52 |
| S.N.N.P Region | 2.75 | 4.715 | 4.49 |
| Gambella Region | 2.725 | 2,930 | 2,885 |
| Harari Region | 1,725 | 4,725 | 2,885 |
| Addis Ababa City Administration | 1.485 | - | 1.485 |
| Dira Dawa City Administration | 2,155 | 5,455 | 2,985 |
| Region 17 | 3,210 | 2,585 | 2,845 |
Fertility and Births (Demographic and Health Surveys)
Total Fertility Rate (TFR) (Wanted Fertility Rate) and Crude Birth Rate (CBR):[10]
| Year | CBR (Total) | TFR (Total) | CBR (Urban) | TFR (Urban) | CBR (Rural) | TFR (Rural) |
|---|---|---|---|---|---|---|
| 2000 | 41.3 | 5.9 (4.9) | 30.7 | 3.3 (2.7) | 42.9 | 6.4 (5.4) |
| 2005 | 35.7 | 5.4 (4.0) | 23.4 | 2.4 (1.8) | 37.3 | 6.0 (4.5) |
| 2011 | 34.5 | 4.8 (3.0) | 26.4 | 2.6 (1.8) | 36.2 | 5.5 (3.4) |
| 2016 | 31.8 | 4.6 | 23.9 | 2.3 | 33.2 | 5.2 |
According to 2011 official survey, total fertility rate was 4.8 with 2.6 in Urban and 5.5 in rural regions.[11] Total wanted fertility rate (TWFR) in Ethiopia is 3.0 children per woman, this suggests that the TFR is 60 percent higher than it would be if unwanted births were avoided.[11]
CIA World Factbook demographic statistics
The following demographic statistics are from the CIA World Factbook, unless otherwise indicated.
Population
- 99,465,819
Age structure
- 0-14 years: 43.94% (male 21,900,571/female 21,809,643)
- 15-24 years: 19.98% (male 9,865,976/female 10,009,596)
- 25-54 years: 29.31% (male 14,487,280/female 14,667,179)
- 55-64 years: 3.88% (male 1,882,315/female 1,981,762)
- 65 years and over: 2.88% (male 1,289,336/female 1,572,161) (2015 est.)
Median age
- total: 17.7 years
- male: 17.5 years
- female: 17.8 years (2015 est.)
Population growth rate
- 2.89% (2015 est.)
Birth rate
- 37.27 births/1,000 population (2015 est.)
Death rate
- 8.19 deaths/1,000 population (2015 est.)
Net migration rate
- -0.22 migrant(s)/1,000 population
Urbanization
- urban population: 19.5% of total population (2015)
- rate of urbanization: 4.89% annual rate of change (2010-15 est.)
Sex ratio
- at birth: 1.03 male(s)/female
- 0-14 years: 1 male(s)/female
- 15-24 years: 0.99 male(s)/female
- 25-54 years: 0.99 male(s)/female
- 55-64 years: 0.95 male(s)/female
- 65 years and over: 0.82 male(s)/female
- total population: 0.99 male(s)/female (2015 est.)
Life expectancy at birth
- total population: 61.48 years
- male: 59.11 years
- female: 63.93 years (2015 est.)
Total fertility rate
- 5.15 children born/woman (2015 est.)
HIV/AIDS
- adult prevalence rate: 1.15%
- people living with HIV/AIDS: 730,300
- deaths: 23,400 (2014 est.)
Literacy
- definition: age 15 and over can read and write
- total population: 49.1%
- male: 57.2%
- female: 41.1% (2015 est.)
See also
| Wikimedia Commons has media related to Demographics of Ethiopia. |
References
- ↑ "Africa - Ethiopia". CIA The World Factbook.
- ↑ Ethnologue page on Ethiopian languages
- ↑ "Statistical Tables for the 2007 Population and Housing Census of Ethiopia: Country Level". Central Statistical Agency. 2007. pp. 91–92. Retrieved 2016-02-29.
- ↑ (?The is nothing stated on the reference if 32.7% speakers of Amharic Language speak it as a first language-Additional reference please or correction please)The World Factbook, "Ethiopia." 2006. (The preliminary draft of the 2007 national census does not provide figures on language speakers.)
- ↑ 2007 Ethiopian census, first draft, Ethiopian Central Statistical Agency (accessed 6 May 2009) Archived February 14, 2012, at the Wayback Machine.
- ↑ Central Statistical Agency
- 1 2 3 Population Division of the Department of Economic and Social Affairs of the United Nations Secretariat, World Population Prospects: The 2010 Revision
- ↑ http://unstats.un.org/unsd/demographic/products/vitstats/serATab3.pdf
- ↑ "Country Level". 2007 Population and Housing Census of Ethiopia. CSA. 13 July 2010. Archived from the original on 13 November 2012. Retrieved 18 January 2013.
- ↑ MEASURE DHS: Demographic and Health Surveys
- 1 2 http://measuredhs.com/pubs/pdf/FR255/FR255.pdf
![]() This article incorporates public domain material from the CIA World Factbook document "2006 edition".
This article incorporates public domain material from the CIA World Factbook document "2006 edition".
Ethiopia articles | |||||||||
|---|---|---|---|---|---|---|---|---|---|
| History |
| ||||||||
| Geography |
| ||||||||
| Politics |
| ||||||||
| Economy | |||||||||
| Society |
| ||||||||
| |||||||||