Demographics of Australia
| Demographics of | ||
|---|---|---|
| Indicator | Rank | Measure |
| Population | ||
| Population | 52nd | 24,293,100[1] |
| Economy | ||
| GDP (PPP) per capita | 19th | $43,929 |
| GDP | 12th | $1.56 trillion |
| Unemployment rate | ↓ 57th | 5.80%[2] |
| CO2 emissions | 11th | 18.3 t† |
| Electricity consumption | 17th | 213.5 TWh |
| Economic freedom | 3rd | 82.5 |
| Politics | ||
| Human Development Index | 2nd | 0.937 |
| Political freedom | 1st (equal)* | 1 |
| Corruption (A higher score means less (perceived) corruption.) | 11th | 80 |
| Press freedom | 18th | 5.38 |
| Society | ||
| Literacy Rate | 21st | 99% |
| Broadband uptake | 17th | 13.8% |
| Beer consumption | 20th[3] | 4.49 L† |
| Health | ||
| Life Expectancy | 4th | 81.2 |
| Birth rate | 148th | 13.8‡ |
| Fertility rate | 137th | 1.969†† |
| Infant mortality | 202nd | 4.57‡‡ |
| Death rate | 122nd | 7.56‡ |
| Suicide Rate | 50th | ♂ 14.9†‡ ♀ 4.4†‡ |
| HIV/AIDS rate | 108th | 0.10% |
| Notes | ||
| ↓ indicates rank is in reverse order (e.g. 1st is lowest) † per capita ‡ per 1000 people †† per woman ‡‡ per 1000 live births †‡ per 100,000 people per year ♂ indicates males, ♀ indicates females | ||
The demographics of Australia covers basic statistics, most populous cities, ethnicity and religion. The population of Australia is estimated to be 24,293,100 as of 5 December 2016.[1] Australia is the 52nd most populous country in the world and the most populous Oceanian country. Its population is concentrated mainly in urban areas and is expected to exceed 28 million by 2030.[4]
Australia's population has grown from an estimated population of between 300,000 and 1,000,000 at the time of British settlement in 1788 due to numerous waves of immigration during the period since. Also due to immigration, the European component of the population is declining as a percentage.
Australia has fewer than three persons per square kilometre of total land area. With 89.01% of its population living in urban areas, Australia is one of the world's most urbanised countries.[5] The life expectancy of Australia in 1999–2001 was 79.7 years, among the highest in the world.
Indigenous population
The earliest accepted timeline for the first arrivals of indigenous Australians to the continent of Australia places this human migration to at least 40,000 years ago most probably from the islands of Indonesia and New Guinea.[6]
These first inhabitants of Australia were originally hunter-gatherers, who over the course of many succeeding generations diversified widely throughout the continent and its nearby islands. Although their technical culture remained static—depending on wood, bone, and stone tools and weapons—their spiritual and social life was highly complex. Most spoke several languages, and confederacies sometimes linked widely scattered tribal groups. Aboriginal population density ranged from approximately one person per 3 km2 (1 sq mi) along the coasts to one person per 90 km2 (35 sq mi) in the arid interior. Food procurement was usually a matter for the nuclear family, requiring an estimated 3 days of work per week. There was little large game, and outside of some communities in the more fertile south-east, they had no agriculture.
Dutch navigators landed on the coasts of modern Western Australia and Queensland several times during the 17th century. Captain James Cook claimed the east coast for Great Britain in 1770, the west coast was later settled by Britain also. At that time, the indigenous population was estimated to have been between 315,000 and 750,000,[7] divided into as many as 500 tribes speaking many different languages. In the 2011 census, 495,757 respondents declared they were Aboriginal, 31,407 declared they were Torres Strait Islander, and a further 21,206 declared they were both Aboriginal and Torres Strait Islanders.[8]
Since the end of World War II, efforts have been made both by the government and by the public to be more responsive to Aboriginal rights and needs.
Today, most of Australia's Indigenous population live on the east coast of Australia, where almost 60% of Indigenous Australians live in New South Wales (208,476) and Queensland (188,954) which roughly represents 2–5% of those state's populations. The Northern Territory has an Indigenous population of almost 70,000 and represents about 30% of the total Northern Territory population.
Cities
Australia contains five cities that consist of over one million people. Most of Australia's population live close to coastlines.[9]
| | |||||||||
|---|---|---|---|---|---|---|---|---|---|
| Rank | Name | State | Pop. | Rank | Name | State | Pop. | ||
 Sydney  Melbourne |
1 | Sydney | NSW | 4,840,628 | 11 | Hobart | TAS | 219,243 |  Brisbane 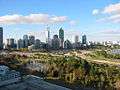 Perth |
| 2 | Melbourne | VIC | 4,440,328 | 12 | Geelong | VIC | 184,182 | ||
| 3 | Brisbane | QLD | 2,274,560 | 13 | Townsville | QLD | 178,649 | ||
| 4 | Perth | WA | 2,021,203 | 14 | Cairns | QLD | 146,778 | ||
| 5 | Adelaide | SA | 1,304,631 | 15 | Darwin | NT | 140,386 | ||
| 6 | Gold Coast–Tweed Heads | QLD/NSW | 614,379 | 16 | Toowoomba | QLD | 113,625 | ||
| 7 | Newcastle–Maitland | NSW | 430,755 | 17 | Ballarat | VIC | 98,543 | ||
| 8 | Canberra–Queanbeyan | ACT/NSW | 422,510 | 18 | Bendigo | VIC | 91,692 | ||
| 9 | Sunshine Coast | QLD | 297,380 | 19 | Albury–Wodonga | NSW/VIC | 87,890 | ||
| 10 | Wollongong | NSW | 289,236 | 20 | Launceston | TAS | 86,393 | ||
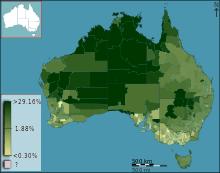
Population density
The population density in Australia was last reported as 2.91/km2 (7.5/sq mi). The density was 2.8/km2 (7.3/sq mi) in 2008 and 2.86/km2 (7.4/sq mi) in 2009. That made Australia the 3rd least densely populated country in the world, after Namibia and Mongolia.
General demographic statistics
Much of the data that follows has been derived from the CIA World Factbook and the Australian Bureau of Statistics, through censuses.
Population

The following figures are ABS estimates for the resident population of Australia, based on the 2001 and 2006 Censuses and other data.
- 24,293,100 (as of 5 December 2016)[1]
- 21,262,641 (July 2009 – CIA World Factbook)
- 21,180,600 (end December 2007[11])
- 20,848,760 (end December 2006 – preliminary)
- 20,544,064 (end December 2005)
- 20,252,132 (end December 2004)
- 20,011,882 (end December 2003)
- 19,770,964 (end December 2002)
States and territories
| State/territory | Land area (km2) |
Population (2011 census) |
Population density (/km2) |
% of population in capital |
|---|---|---|---|---|
| |
2,358 | 357,222[12] | 151.49 | 99.6% |
| |
800,642 | 6,917,658[13] | 8.64 | 63% |
| |
227,416 | 5,354,042[14] | 23.54 | 71% |
| |
1,730,648 | 4,332,739[15] | 2.50 | 46% |
| |
983,482 | 1,596,572[16] | 1.62 | 73.5% |
| |
2,529,875 | 2,239,170[17] | 0.89 | 73.4% |
| |
68,401 | 495,354[18] | 7.24 | 41% |
| |
1,349,129 | 211,945[19] | 0.16 | 54% |
Age structure


- 0–14 years – 18%
- 15–24 years – 13.3%
- 25–54 years – 41.8%
- 55–64 years – 11.8%
- 65 years and over – 15.1% (2014 estimate)[21]
Median age
- Total: 36.9 years[22]
- Male: 36.6 years
- Female: 38.1 years (2009 est.)
Population growth rate
As of the end of June 2015, the population growth rate was 1.4%.[23] This rate was based on estimates of:[24]
- one birth every 1 minute and 44 seconds,
- one death every 3 minutes and 32 seconds,
- a net gain of one international migrant every 2 minutes and 19 seconds leading to
- an overall total population increase of one person every 1 minute and 23 seconds.
In 2009, the estimated rates were:
- Birth rate – 12.47 births/1,000 population (Rank 164)
- Mortality rate – 6.68 deaths/1,000 population (Rank 146)
- Net migration rate – 6.23 migrant(s)/1,000 population. (Rank 15)
At the time of Australian Federation in 1901, the rate of natural increase was 14.9 persons per 1,000 population. The rate increased to a peak of 17.4 per thousand population in the years 1912, 1913 and 1914. During the Great Depression, the rate declined to a low of 7.1 per thousand population in 1934 and 1935. Immediately after World War II, the rate increased sharply as a result of the start of the post–World War II baby boom and the immigration of many young people who then had children in Australia. A rate plateau of over 13.0 persons per 1,000 population occurred for every year from 1946 to 1962.
There has been a fall in the rate of natural increase since 1962 due to falling fertility. In 1971, the rate of natural increase was 12.7 persons per 1,000 population; a decade later it had fallen to 8.5. In 1996 the rate of natural increase fell below seven for the first time, with the downward trend continuing in the late 1990s. Population projections by the Australian Bureau of Statistics indicate that continued low fertility, combined with the increase in deaths from an ageing population, will result in natural increase falling below zero sometime in the mid-2030s. However, in 2006 the fertility rate rose to 1.81, one of the highest rates in the OECD.
Since 1901, the crude death rate has fallen from about 12.2 deaths per 1,000 population, to 6.4 deaths per 1,000 population in 2006.[25]
Vital statistics since 1900
Source:[26]
| Average population (x 1,000) | Live births | Deaths | Natural change | Crude birth rate (per 1,000) | Crude death rate (per 1,000) | Natural change (per 1,000) | Fertility rates | Net overseas migration[27] | |
|---|---|---|---|---|---|---|---|---|---|
| 1900 | 3,715 | 102,221 | 44,060 | 58,161 | 27.3 | 11.8 | 15.5 | ||
| 1901 | 3,765 | 102,945 | 46,330 | 56,615 | 27.1 | 12.2 | 14.9 | ||
| 1902 | 3,824 | 102,776 | 48,078 | 54,698 | 26.7 | 12.5 | 14.2 | ||
| 1903 | 3,875 | 98,443 | 47,293 | 51,150 | 25.3 | 12.1 | 13.2 | ||
| 1904 | 3,916 | 104,113 | 43,572 | 60,541 | 26.4 | 11.0 | 15.4 | ||
| 1905 | 3,974 | 104,941 | 43,514 | 61,427 | 26.2 | 10.9 | 15.3 | ||
| 1906 | 4,032 | 107,890 | 44,333 | 63,557 | 26.6 | 10.9 | 15.7 | ||
| 1907 | 4,091 | 110,347 | 45,305 | 55,042 | 26.7 | 11.0 | 15.7 | ||
| 1908 | 4,161 | 111,545 | 46,426 | 55,119 | 26.6 | 11.1 | 15.5 | ||
| 1909 | 4,232 | 114,071 | 44,172 | 59,899 | 26.7 | 10.3 | 16.4 | ||
| 1910 | 4,323 | 116,801 | 45,590 | 61,211 | 26.7 | 10.4 | 16.3 | ||
| 1911 | 4,425 | 122,193 | 47,869 | 74,324 | 27.2 | 10.6 | 16.6 | ||
| 1912 | 4,573 | 133,088 | 52,177 | 80,911 | 28.6 | 11.2 | 17.4 | ||
| 1913 | 4,746 | 135,714 | 51,789 | 83,925 | 28.2 | 10.7 | 17.5 | ||
| 1914 | 4,893 | 137,983 | 51,720 | 86,263 | 28.0 | 10.5 | 17.5 | ||
| 1915 | 4,971 | 134,871 | 52,782 | 82,089 | 27.1 | 10.6 | 16.5 | ||
| 1916 | 4,969 | 131,426 | 54,197 | 77,219 | 26.6 | 11.0 | 15.6 | ||
| 1917 | 4,917 | 129,965 | 48,029 | 81,936 | 26.3 | 9.7 | 16.6 | ||
| 1918 | 4,982 | 125,739 | 50,249 | 75,490 | 25.0 | 10.0 | 15.0 | ||
| 1919 | 5,080 | 122,290 | 65,930 | 56,360 | 23.6 | 12.7 | 10.9 | ||
| 1920 | 5,303 | 136,406 | 56,289 | 80,117 | 25.5 | 10.5 | 15.5 | ||
| 1921 | 5,411 | 136,198 | 54,076 | 82,122 | 24.9 | 9.9 | 15.0 | 3.12 | |
| 1922 | 5,510 | 137,496 | 51,311 | 86,185 | 24.7 | 9.2 | 15.5 | 3.11 | |
| 1923 | 5,637 | 135,222 | 56,236 | 78,986 | 23.7 | 9.9 | 13.8 | 3.02 | |
| 1924 | 5,755 | 134,927 | 54,980 | 79,953 | 23.2 | 9.4 | 13.8 | 2.97 | |
| 1925 | 5,882 | 135,792 | 54,658 | 81,134 | 22.9 | 9.2 | 13.7 | 2.95 | |
| 1926 | 6,000 | 133,162 | 56,952 | 76,210 | 22.0 | 9.4 | 12.6 | 2.85 | |
| 1927 | 6,124 | 133,698 | 58,282 | 75,716 | 21.6 | 9.4 | 12.2 | 2.80 | |
| 1928 | 6,251 | 134,078 | 59,378 | 74,700 | 21.3 | 9.4 | 11.9 | 2.77 | |
| 1929 | 6,355 | 129,480 | 60,857 | 68,623 | 20.2 | 9.5 | 10.7 | 2.64 | |
| 1930 | 6,436 | 128,399 | 55,331 | 73,068 | 19.8 | 8.6 | 11.2 | 2.58 | |
| 1931 | 6,500 | 118,509 | 56,560 | 61,949 | 18.2 | 8.7 | 9.5 | 2.36 | |
| 1932 | 6,552 | 110,933 | 56,757 | 54,176 | 16.9 | 8.6 | 8.3 | 2.19 | |
| 1933 | 6,603 | 111,269 | 59,117 | 52,152 | 16.8 | 8.9 | 7.9 | 2.17 | |
| 1934 | 6,656 | 109,475 | 62,229 | 47,246 | 16.4 | 9.3 | 7.1 | 2.11 | |
| 1935 | 6,707 | 111,325 | 63,599 | 47,726 | 16.5 | 9.4 | 7.1 | 2.12 | |
| 1936 | 6,755 | 116,073 | 63,932 | 52,141 | 17.1 | 9.4 | 7.7 | 2.18 | |
| 1937 | 6,810 | 119,131 | 64,496 | 54,635 | 17.4 | 9.4 | 8.0 | 2.21 | |
| 1938 | 6,871 | 120,415 | 66,451 | 53,964 | 17.4 | 9.6 | 7.8 | 2.21 | |
| 1939 | 6,935 | 122,891 | 69,147 | 53,744 | 17.6 | 9.9 | 7.7 | 2.22 | |
| 1940 | 7,004 | 126,347 | 68,384 | 57,963 | 17.9 | 9.7 | 8.2 | 2.26 | |
| 1941 | 7,077 | 134,525 | 71,176 | 63,349 | 18.9 | 10.0 | 8.9 | 2.36 | |
| 1942 | 7,143 | 136,708 | 75,191 | 61,517 | 19.1 | 10.5 | 8.6 | 2.38 | |
| 1943 | 7,201 | 149,295 | 74,486 | 74,809 | 20.6 | 10.3 | 10.3 | 2.57 | |
| 1944 | 7,269 | 153,344 | 69,596 | 83,748 | 21.0 | 9.5 | 11.5 | 2.63 | |
| 1945 | 7,347 | 160,560 | 70,231 | 90,229 | 21.7 | 9.5 | 12.2 | 2.74 | |
| 1946 | 7,430 | 176,379 | 74,661 | 101,718 | 23.6 | 10.0 | 13.6 | 2.99 | |
| 1947 | 7,517 | 182,384 | 73,468 | 108,916 | 24.1 | 9.7 | 14.4 | 3.08 | |
| 1948 | 7,637 | 177,976 | 76,839 | 101,137 | 23.1 | 10.0 | 13.1 | 2.99 | |
| 1949 | 7,792 | 181,261 | 75,260 | 106,001 | 22.9 | 9.5 | 13.4 | 3.03 | |
| 1950 | 8,045 | 190,591 | 78,187 | 112,404 | 23.3 | 9.6 | 13.7 | 3.07 | |
| 1951 | 8,307 | 193,298 | 81,788 | 111,510 | 23.0 | 9.7 | 13.3 | 3.06 | |
| 1952 | 8,527 | 201,650 | 81,597 | 120,053 | 23.4 | 9.5 | 13.9 | 3.18 | |
| 1953 | 8,739 | 202,235 | 80,188 | 122,047 | 22.9 | 9.1 | 13.8 | 3.19 | |
| 1954 | 8,902 | 202,256 | 81,805 | 120,451 | 22.5 | 9.1 | 13.4 | 3.20 | |
| 1955 | 9,089 | 207,677 | 82,036 | 125,641 | 22.6 | 8.9 | 13.7 | 3.28 | |
| 1956 | 9,311 | 212,633 | 86,088 | 126,545 | 22.5 | 9.1 | 13.4 | 3.33 | |
| 1957 | 9,530 | 220,358 | 84,953 | 135,405 | 22.9 | 8.8 | 14.1 | 3.42 | |
| 1958 | 9,744 | 222,504 | 83,723 | 138,481 | 22.6 | 8.5 | 14.1 | 3.42 | |
| 1959 | 9,947 | 226,976 | 89,212 | 137,765 | 22.6 | 8.9 | 13.7 | 3.44 | |
| 1960 | 10,160 | 230,326 | 88,464 | 141,862 | 22.4 | 8.6 | 13.8 | 3.45 | |
| 1961 | 10,391 | 239,986 | 88,961 | 151,025 | 22.8 | 8.5 | 14.3 | 3.55 | |
| 1962 | 10,642 | 237,081 | 93,163 | 143,918 | 22.1 | 8.7 | 13.4 | 3.43 | |
| 1963 | 10,846 | 235,689 | 94,894 | 140,795 | 21.5 | 8.7 | 12.8 | 3.34 | |
| 1964 | 11,055 | 229,149 | 100,594 | 128,555 | 20.5 | 8.7 | 11.8 | 3.15 | |
| 1965 | 11,280 | 222,854 | 99,715 | 123,139 | 19.6 | 8.8 | 10.8 | 2.97 | |
| 1966 | 11,505 | 223,731 | 103,929 | 119,802 | 19.3 | 9.0 | 10.3 | 2.89 | |
| 1967 | 11,704 | 229,796 | 102,703 | 127,093 | 19.4 | 8.7 | 10.7 | 2.85 | |
| 1968 | 11,912 | 240,906 | 109,547 | 131,359 | 20.0 | 9.1 | 10.9 | 2.89 | |
| 1969 | 12,145 | 250,175 | 106,496 | 143,681 | 20.4 | 8.7 | 11.7 | 2.93 | |
| 1970 | 12,407 | 257,516 | 113,048 | 144,468 | 20.5 | 9.0 | 10.5 | 2.94 | |
| 1971 | 12,663 | 276,361 | 110,650 | 165,711 | 21.5 | 8.6 | 12.9 | 2.98 | |
| 1972 | 13,067 | 271,960 | 110,191 | 161,769 | 20.6 | 8.4 | 12.2 | 2.74 | |
| 1973 | 13,303 | 255,848 | 111,336 | 144,512 | 19.1 | 8.3 | 10.8 | 2.49 | |
| 1974 | 13,504 | 243,658 | 110,179 | 133,479 | 17.9 | 8.1 | 9.8 | 2.32 | |
| 1975 | 13,722 | 239,794 | 114,501 | 125,293 | 17.4 | 8.3 | 9.1 | 2.15 | |
| 1976 | 13,892 | 231,135 | 110,610 | 120,525 | 16.6 | 7.9 | 8.7 | 2.06 | |
| 1977 | 14,033 | 226,954 | 111,490 | 115,464 | 16.1 | 7.9 | 8.2 | 2.01 | |
| 1978 | 14,192 | 226,359 | 108,059 | 118,300 | 15.9 | 7.6 | 8.3 | 1.95 | |
| 1979 | 14,359 | 223,370 | 108,315 | 115,055 | 15.5 | 7.5 | 8.0 | 1.91 | |
| 1980 | 14,515 | 223,664 | 106,654 | 117,010 | 15.3 | 7.3 | 8.0 | 1.89 | |
| 1981 | 14,695 | 230,920 | 109,429 | 121,491 | 15.6 | 7.4 | 8.2 | 1.94 | |
| 1982 | 14,923 | 237,076 | 110,990 | 116,086 | 15.7 | 7.4 | 8.3 | 1.93 | 128,100 |
| 1983 | 15,184 | 241,764 | 112,918 | 128,846 | 15.8 | 7.4 | 8.4 | 1.92 | 73,300 |
| 1984 | 15,393 | 240,544 | 110,887 | 129,657 | 15.5 | 7.2 | 8.3 | 1.84 | 49,100 |
| 1985 | 15,579 | 241,814 | 114,197 | 127,617 | 15.4 | 7.3 | 8.1 | 1.92 | 73,800 |
| 1986 | 15,788 | 239,115 | 116,069 | 123,046 | 15.0 | 7.3 | 7.7 | 1.87 | 100,500 |
| 1987 | 16,018 | 242,977 | 116,139 | 126,838 | 15.0 | 7.2 | 7.8 | 1.85 | 125,800 |
| 1988 | 16,263 | 246,200 | 120,463 | 125,737 | 15.0 | 7.3 | 7.7 | 1.83 | 149,400 |
| 1989 | 16,532 | 250,155 | 118,767 | 131,388 | 15.1 | 7.1 | 8.0 | 1.84 | 157,500 |
| 1990 | 16,814 | 257,521 | 125,112 | 132,409 | 15.3 | 7.4 | 7.9 | 1.90 | 124,700 |
| 1991 | 17,065 | 261,158 | 119,572 | 141,586 | 15.2 | 7.0 | 8.2 | 1.85 | 86,500 |
| 1992 | 17,284 | 259,186 | 120,836 | 138,350 | 14.9 | 6.9 | 8.0 | 1.89 | 68,600 |
| 1993 | 17,494 | 259,959 | 121,338 | 138,621 | 14.8 | 6.9 | 7.9 | 1.86 | 30,100 |
| 1994 | 17,667 | 258,314 | 123,496 | 134,818 | 14.5 | 7.0 | 7.5 | 1.84 | 46,600 |
| 1995 | 17,854 | 258,210 | 126,232 | 131,978 | 14.4 | 7.0 | 7.4 | 1.82 | 80,200 |
| 1996 | 18,071 | 250,438 | 126,400 | 124,038 | 13.8 | 6.9 | 6.9 | 1.80 | 104,000 |
| 1997 | 18,310 | 253,660 | 127,298 | 126,362 | 13.7 | 6.9 | 6.8 | 1.78 | 87,200 |
| 1998 | 18,517 | 249,105 | 129,255 | 119,850 | 13.4 | 6.9 | 6.5 | 1.75 | 79,100 |
| 1999 | 18,711 | 249,965 | 128,278 | 121,487 | 13.3 | 6.8 | 6.5 | 1.75 | 96,500 |
| 2000 | 18,925 | 249,310 | 128,392 | 120,918 | 13.1 | 6.7 | 6.4 | 1.75 | 107,200 |
| 2001 | 19,153 | 247,500 | 128,913 | 118,587 | 12.8 | 6.7 | 6.1 | 1.73 | 135,700 |
| 2002 | 19,413 | 250,988 | 133,707 | 117,281 | 12.9 | 6.9 | 6.0 | 1,771 | 110,600 |
| 2003 | 19,651 | 246,663 | 132,239 | 114,424 | 12.5 | 6.7 | 5.8 | 1.75 | 116,500 |
| 2004 | 19,895 | 249,082 | 133,231 | 115,851 | 12.4 | 6.7 | 5.7 | 1.76 | 100,000 |
| 2005 | 20,127 | 255,934 | 131,354 | 124,580 | 12.6 | 6.5 | 6.1 | 1.79 | 123,800 |
| 2006 | 20,394 | 263,540 | 134,041 | 129,499 | 12.8 | 6.5 | 6.3 | 1.82 | 146,700 |
| 2007 | 20,697 | 274,330 | 134,785 | 139,545 | 13.2 | 6.4 | 6.8 | 1.87 | 232,700 |
| 2008 | 21,015 | 302,272 | 143,946 | 158,326 | 14.4 | 6.8 | 7.6 | 2.02 | 277,400 |
| 2009 | 21,262 | 295,700 | 140,760 | 154,940 | 13.9 | 6.6 | 7.3 | 1.90 | 299,800 |
| 2010 | 22,183 | 297,900 | 143,473 | 154,427 | 13.4 | 6.4 | 7.0 | 1.89 | 172,038 |
| 2011 | 22,340 | 301,617 | 146,932 | 156,050 | 13.5 | 6.6 | 6.9 | 1.92 | 205,679 |
| 2012 | 22,723 | 309,582 | 147,098 | 161,782 | 13.6 | 6.5 | 7.1 | 1.91 | 241,151 |
| 2013 | 23,162 | 308,065 | 147,708 | 160,357 | 13.3 | 6.4 | 6.9 | 1,883 | 235,797 |
| 2014 | 23,413 | 299,697 | 153,400 | 146,300 | 12.8 | 6.5 | 6.3 | 1,800 | |
| 2015 | 23,858 | 305,377 | 159,052 | 146,325 | 12.8 | 6.7 | 6.1 | 1,807 |
In 2012, the total fertility rate of Australian born women was 1.94, while for overseas born women, it was 1.81,[28] while in 2013, it was 1.91 and 1.79 respectively.[29]
Urbanisation
- Urbanisation population: 89% of total population (2008)
- Rate of urbanisation: 1.2% annual rate of change (2005–2010)
Sex ratio
- At birth: 1.06 male(s)/female
- Under 15 years: 1.05 male(s)/female
- 15–64 years: 1.03 male(s)/female
- 65 years and over: 0.84 male(s)/female
- Total population: 1 male(s)/female (2009)
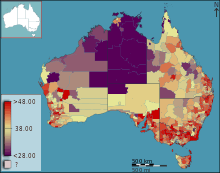
Life expectancy at birth
- Total: 80.62 years
- World: 70
- Male: 79.99 years
- Female: 84.15 years
Total fertility rate
- 1.969 children born/woman (2008)[30]
For more detailed regionwise TFR details see Birth rate and fertility rate in Australia.
- country comparison to the world: 159
HIV/AIDS
- Adult prevalence rate: 0.2% (2007 est.)
- People living with HIV/AIDS: 18,000 (2007 est.)
- Deaths: fewer than 200 (2003 est.)[31]
Country of birth

According to the Australian Bureau of Statistics, on 30 June 2015 there were 6.7 million residents who were born outside Australia, representing 28% of the total population.[33] The Australian resident population consists of people who were born in these countries:
- Notes
For more information about immigration see Immigration to Australia.
Ancestry of Australian population
The earliest accepted timeline for the first arrivals of indigenous Australians to the continent of Australia places this human migration to at least 40,000 years ago, most probably from the islands of Indonesia and New Guinea.[6]
Captain James Cook claimed the east coast for Great Britain in 1770, the west coast was later settled by Britain also. At that time, the indigenous population was estimated to have been between 315,000 and 750,000,[7] divided into as many as 500 tribes speaking many different languages.
For generations, the vast majority of both colonial-era settlers and post-Federation immigrants came from the United Kingdom and Ireland, although the gold rushes also drew migrants from other countries. Since the end of World War II, Australia's population more than doubled, spurred by large-scale European immigration during the immediate post-war decades. At this time, the White Australia Policy discouraged non-European immigration.
Abolition of the White Australia Policy in the mid-1970s led to a significant increase in non-European immigration, mostly from Asia and the Middle East. About 90% of Australia's population is of European descent. Over 8% of the population is of Asian descent (predominantly Chinese, Vietnamese, Filipino and Indian).[34][35] The total indigenous population is estimated to be about 520,000 individuals, including people of mixed descent.[7] The population of Queensland also includes descendants of South Sea Islanders brought over for indentured servitude in the 19th century.
In the 2011 census, 60.2% of Australia's population declared European ancestry. In addition, many of those who chose Australian ethnicity were not of indigenous ethnicity. The total indigenous population is estimated to be about 520,000 individuals, including people of mixed descent.[7] In the 2011 census, Australians reported around 300 different ancestries.[36]
At the 2011 census residents were asked to describe their ancestry, in which up to two could be nominated. Proportionate to the Australian resident population, the most commonly nominated ancestries were:[37][38]
At the 2011 census, 53.7% of people had both parents born in Australia and 34.3% of people had both parents born overseas.[39]
Religion
Australia is a religiously diverse country and it has no official religion.
Christianity is the predominant faith of Australia, though this is diminishing. In the 2011 census, 61.1% of the population classified themselves as being affiliated with a Christian faith, down from 67.3% ten years earlier at the 2001 census.[40] The largest religious denomination was Roman Catholicism, with 25.3% of the population. The next largest Christian denomination was Anglican at 17.1%, and all other Christian denominations accounted for a further 18.7% of the population.[41]
The second-largest group, and the one which had grown the fastest, was the 22.3% who state that they have no religion. Over the ten years since the 2001 census, this group grew from 15.3% to 22.3% of the population; an increase of seven percentage points, which was the largest change of any religious classification in that period.[40][41]
Minority religions practised in Australia include Buddhism (2.5% of the population), Islam (2.2%), Hinduism (1.3%) and Judaism (0.5%). The Census question about religion in 2011 was optional, and 8.6% of people did not respond in the 2011 census.[41]
The Australian Bureau of Statistics 2001 Census Dictionary statement on religious affiliation states the purpose for gathering such information:
Data on religious affiliation are used for such purposes as planning educational facilities, aged persons' care and other social services provided by religion-based organisations; the location of church buildings; the assigning of chaplains to hospitals, prisons, armed services and universities; the allocation of time on public radio and other media; and sociological research.
As in many Western countries, the level of active participation in religious services is lower than would be indicated by the proportion of the population identifying themselves as affiliated with a religion; weekly attendance at Christian church services is about 1.5 million, or about 7.5% of the population.[42] Christian charitable organisations, hospitals and schools play a prominent role in welfare and education services. The Catholic education system is the second biggest sector after government schools, with more than 650,000 students (and around 21 per cent of all secondary school enrolments).
Languages
English is the national language of Australia and is spoken by the vast majority of the population.[43]
The most commonly spoken languages other than English are Italian, Greek, German, Spainish, Vietnamese, Filipino, Chinese varieties, Indian languages, Arabic and Macedonian, as well as numerous Australian Aboriginal languages.[44] Australia's hard-of-hearing community uses Australian Deaf Sign Language. As of February 2012, more than 15 per cent of Australians speak non-English languages at home and more than 200 languages are practised.[43]
| Language | Speakers |
|---|---|
| Only English | 15,581,333 |
| Italian | 316,895 |
| Greek | 252,226 |
| Cantonese | 244,553 |
| Arabic | 243,662 |
| Mandarin | 220,600 |
| Vietnamese | 194,863 |
| Spanish | 98,001 |
| Filipino | 92,331 |
| German | 75,634 |
| Hindi | 70,011 |
| Macedonian | 67,835 |
| Croatian | 63,612 |
| Australian Aboriginal Languages | 55,705 |
| Korean | 54,623 |
| Turkish | 53,857 |
| Polish | 53,389 |
| Serbian | 52,534 |
| French | 43,216 |
| Indonesian | 42,036 |
| Maltese | 36,514 |
| Russian | 36,502 |
| Dutch | 36,183 |
| Japanese | 35,111 |
| Tamil | 32,700 |
| Sinhalese | 29,055 |
| Samoan | 28,525 |
| Portuguese | 25,779 |
| Khmer | 24,715 |
| Assyrian (Aramaic) | 23,526 |
| Punjabi | 23,164 |
| Persian | 22,841 |
| Hungarian | 21,565 |
| Bengali | 20,223 |
| Urdu | 19,288 |
| Afrikaans | 16,806 |
| Bosnian | 15,743 |
Literacy
- Definition: aged 15 years and over can read and write
- Total population: 99%
- Male: 99%
- Female: 99% (2003 est.)
Education expenditure
- 4.9% of GDP (2013)
- country comparison to the world: 55
Nationality
Australian nationality law determines who is and who is not an Australian citizen. The status of Australian nationality or Australian citizenship was created by the Nationality and Citizenship Act 1948 (in 1973 renamed the Australian Citizenship Act 1948) which came into force on 26 January 1949. The 1948 Act was amended many times, notably in 1973, 1984, 1986 and 2002. The Australian Citizenship Act 2007 replaced the 1948 Act, commencing on 1 July 2007. Australian citizenship law is administered by the Department of Immigration and Border Protection which can issue certificates of citizenship on naturalisation or on request provide other proof or evidence of Australian citizenship. Australian passports are issued to Australian citizens by the Department of Foreign Affairs and Trade.
In Australia, the terms "nationality" and "citizenship" can be used interchangeably, but the term "citizenship" (or citizen) is more commonly used, while "nationality" is more commonly used on official documents and forms. A person may acquire citizenship automatically, "by operation of law", or by application after a period of residence in Australia. The process of acquiring citizenship by application is referred to as "naturalisation".
Historical population
Note that population estimates in the table below do not include the Aboriginal population before 1961. Estimates of Aboriginal population prior to European settlement range from 300,000 to one million, with archaeological finds indicating a sustainable population of around 750,000.[45] Where available, actual population figures from census years are included.
| Historic population (estimated) | |||||||||||||||||||||||||||||||||||||||||||||||||||||||||||||||||||||||||||||||||||||||||||||||||||||||||||||||||||||||||||||||||||||||||
|---|---|---|---|---|---|---|---|---|---|---|---|---|---|---|---|---|---|---|---|---|---|---|---|---|---|---|---|---|---|---|---|---|---|---|---|---|---|---|---|---|---|---|---|---|---|---|---|---|---|---|---|---|---|---|---|---|---|---|---|---|---|---|---|---|---|---|---|---|---|---|---|---|---|---|---|---|---|---|---|---|---|---|---|---|---|---|---|---|---|---|---|---|---|---|---|---|---|---|---|---|---|---|---|---|---|---|---|---|---|---|---|---|---|---|---|---|---|---|---|---|---|---|---|---|---|---|---|---|---|---|---|---|---|---|---|---|---|
|
|
| |||||||||||||||||||||||||||||||||||||||||||||||||||||||||||||||||||||||||||||||||||||||||||||||||||||||||||||||||||||||||||||||||||||||
See also
General |
Cities |
References
- 1 2 3 "Population clock". Australian Bureau of Statistics website. Commonwealth of Australia. Retrieved 9 August 2016. The population estimate shown is automatically calculated daily at 00:00 UTC and is based on data obtained from the population clock on the date shown in the citation.
- ↑ Statistics, c=AU; o=Commonwealth of Australia; ou=Australian Bureau of. "Main Features – Main Features". www.abs.gov.au. Retrieved 28 December 2015.
- ↑ Heath, Michael. "Aussie Beer Drinking Market Goes Flat, Slumping to 65-Year Low". Bloomberg. Retrieved 11 September 2013.
- ↑ Xinhua (14 December 2010). "Australia's population to hit 28 million by 2031: report". People's Daily Online. Archived from the original on 3 June 2012. Retrieved 24 April 2013.
- ↑ "Data – Australia". The World Bank. The World Bank Group. 2013. Retrieved 24 April 2013.
- 1 2 "When did Australia's earliest inhabitants arrive?". University of Wollongong. 17 September 2004. Retrieved 3 January 2009.
- 1 2 3 4 "Aboriginal and Torres Strait Islander Population". 1301.0 – Year Book Australia, 2008. Australian Bureau of Statistics. 7 February 2008. Retrieved 3 January 2009.
- ↑ Australian Bureau of Statistics (31 October 2012). "2011 Community Profiles: Aboriginal and Torres Strait Islander Peoples (Indigenous) Profile". 2011 Census of Population and Housing. Retrieved 9 October 2013.
- ↑ "The Beach". Australian Government: Culture Portal. Department of the Environment, Water, Heritage and the Arts, Commonwealth of Australia. 17 March 2008. Archived from the original on 26 February 2010.
- ↑ "3218.0 – Regional Population Growth, Australia, 2013-14". Australian Bureau of Statistics. 30 June 2014. Retrieved 1 February 2016.
- ↑ "3101.0 Australian Demographic Statistics (Dec 2007)" (PDF). Retrieved 4 February 2009.
- ↑ Australian Bureau of Statistics (31 October 2012). "Australian Capital Territory". 2011 Census QuickStats. Retrieved 12 February 2013.
- ↑ Australian Bureau of Statistics (31 October 2012). "New South Wales". 2011 Census QuickStats. Retrieved 12 February 2013.
- ↑ Australian Bureau of Statistics (31 October 2012). "Victoria". 2011 Census QuickStats. Retrieved 12 February 2013.
- ↑ Australian Bureau of Statistics (31 October 2012). "Queensland". 2011 Census QuickStats. Retrieved 12 February 2013.
- ↑ Australian Bureau of Statistics (31 October 2012). "South Australia". 2011 Census QuickStats. Retrieved 12 February 2013.
- ↑ Australian Bureau of Statistics (31 October 2012). "Western Australia". 2011 Census QuickStats. Retrieved 12 February 2013.
- ↑ Australian Bureau of Statistics (31 October 2012). "Tasmania". 2011 Census QuickStats. Retrieved 12 February 2013.
- ↑ Australian Bureau of Statistics (31 October 2012). "Northern Territory". 2011 Census QuickStats. Retrieved 12 February 2013.
- ↑ "Animated Population Pyramids". Australian Bureau of Statistics. ABS. 17 December 2012. Retrieved 24 April 2013.
- ↑ "Australia Age structure". Indexmundi. Retrieved 16 May 2015.
- ↑ "3201.0 – Population by Age and Sex, Australian States and Territories, Jun 2010". Australian Bureau of Statistics. 21 December 2010. Retrieved 5 June 2016.
- ↑ "3101.0 – Australian Demographic Statistics, Jun 2015". Australian Bureau of Statistics. 17 December 2015. Retrieved 15 February 2016.
- ↑ "Population clock". Australian Bureau of Statistics. Retrieved 18 April 2013.
- ↑ "Population Size and Growth". 1301.0 – Year Book Australia, 2008. Australian Bureau of Statistics. 7 February 2008. Retrieved 3 January 2009.
- ↑ "Developed countries database". ined.fr. Retrieved 10 July 2012.
- ↑ "Historical Migration Statistics". 25 July 2014. Archived from the original on 9 August 2014. Retrieved 27 July 2014.
- ↑ "3301.0 Births, Australia, 2012" (XL file). Australian Bureau of Statistics. 11 July 2014. Retrieved 19 December 2014.
- ↑ "3301.0 Births, Australia, 2013" (XL file). Australian Bureau of Statistics. 23 October 2014. Retrieved 19 December 2014.
- ↑ "3301.0 – Births, Australia, 2008". Abs.gov.au. 10 November 2009. Retrieved 7 September 2010.
- ↑ "AUSTRALIA-OCEANIA :: AUSTRALIA". CIA – The World Factbook. Central Intelligence Agency. April 2013. Retrieved 24 April 2013.
- ↑ "Australian Bureau of Statisitcs". Retrieved 2016-01-30.
- 1 2 "Estimated Resident Population by Country of Birth – 1992 to 2015". Australian Bureau of Statistics. Retrieved 2 April 2016.
- ↑ "20680-Ancestry by Country of Birth of Parents – Time Series Statistics (2001, 2006 Census Years) – Australia". Australian Bureau of Statistics. 27 June 2007. Retrieved 30 December 2008.
- ↑ "A Picture of the Nation: Cultural diversity overview 2006" (PDF). Australian Bureau of Statistics. 29 January 2009. Retrieved 6 June 2016.
- ↑ "2011 Census data shows more than 300 ancestries". Australian Bureau of Statistics. 21 June 2012. Retrieved 25 January 2016.
- ↑ "Reflecting a Nation: Stories from the 2011 Census, 2012–2013". Australian Bureau of Statistics. 21 June 2012. Retrieved 25 June 2012.
- ↑ "What's your ancestry? New topic on profile.id".
- ↑ Australian Bureau of Statistics (31 October 2012). "2011 Community Profiles: Australia". 2011 Census of Population and Housing. Retrieved 2 November 2014.
- 1 2 Australian Bureau of Statistics (31 October 2012). "2011 Community Profiles: Time Series Profile". 2011 Census of Population and Housing. Retrieved 26 April 2014.
- 1 2 3 Australian Bureau of Statistics (31 October 2012). "Australia". 2011 Census QuickStats. Retrieved 26 April 2014.
- ↑ "NCLS releases latest estimates of church attendance" (Media release). NCLS Research. NCLS Research. 28 February 2012. Retrieved 24 April 2013.
- 1 2 "People, culture and lifestyle". Department of Foreign Affairs and Trade. The Australian Government. February 2012. Archived from the original on 12 May 2012. Retrieved 24 April 2013.
- ↑ "Ethnologue report for Australia". Ethnologue.com. Retrieved 7 September 2010.
- ↑ "Aboriginal and Torres Strait Islander population". 1301.0 – Year Book Australia, 2002. Australian Bureau of Statistics. 20 August 2007. Retrieved 21 October 2009.
- ↑ Briscoe, Gordon; Smith, Len (2002). The Aboriginal Population Revisited: 70,000 years to the present. Canberra, Australia: Aboriginal History Inc. p. 12. ISBN 978-0-9585637-6-5.
- ↑ "TABLE 1.1. Population by sex, states and territories, 31 December 1788 onwards". 23 May 2014. Retrieved 24 January 2016.
- ↑ Australian Bureau of Statistics (9 March 2006). "Australia". 2001 Census QuickStats. Retrieved 24 January 2016.
- ↑ Australian Bureau of Statistics (25 October 2007). "Australia". 2006 Census QuickStats. Retrieved 24 January 2016.
- ↑ Australian Bureau of Statistics (31 October 2012). "Australia". 2011 Census QuickStats. Retrieved 24 January 2016.
- ↑ "TABLE 1.2. Population by sex, states and territories, 30 June 1901 onwards". Australian Bureau of Statistics. 23 May 2014. Retrieved 24 January 2016.
- General references
 This article incorporates public domain material from the CIA World Factbook document "2006 edition".
Further reading
- Jupp, James. The Australian People: An Encyclopedia of the Nation, its People and their Origins (2002)
- O'Farrell, Patrick. The Irish in Australia: 1798 to the Present Day (3rd ed. Cork University Press, 2001)
- Wells, Andrew, and Theresa Martinez, eds. Australia's Diverse Peoples: A Reference Sourcebook (ABC-CLIO, 2004)
External links
| Wikimedia Commons has media related to Demographics of Australia. |
- Australian Bureau of Statistics (ABS) Year Book Australia, 2009–10
- Australian population: ethnic origins
- Build Australian population graph 1960 – 2013 (World Bank data)
- Build Australian population projection graph till 2100 (United Nation data)
- Build Australian life expectancy at birth graph 1950 – 2013 (United Nation data)