Delaware's at-large congressional district
| Delaware's At-large congressional district | ||
|---|---|---|
 | ||
| Current Representative | John Carney (D–Wilmington) | |
| Area | 2,489 mi2 | |
| Distribution | 80.0% urban, 20.0% rural | |
| Population (2010) | 897,934 | |
| Median income | $57,357 | |
| Ethnicity | 68.9% White, 21.4% Black, 8.2% Hispanic, 1.5% other | |
| Cook PVI | D+7 | |
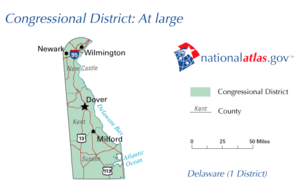
Delaware's at-large congressional district is a congressional district that includes the entire U.S. state of Delaware.
It is currently represented by Democrat John Carney, the former Lieutenant Governor of Delaware.
Voting
| Election results from presidential races | ||
|---|---|---|
| Year | Office | Results |
| 1992 | President | Clinton 44 - 35% |
| 1996 | President | Clinton 52 - 37% |
| 2000 | President | Gore 55 - 42% |
| 2004 | President | Kerry 53 - 45% |
| 2008 | President | Obama 61 - 36% |
| 2012 | President | Obama 59 - 40% |
History
Delaware has always had only one U.S. Representative, except for 10 years between 1813 and 1823, when there was a second Representative. This person was elected statewide, at-large, on the same ballot as the first Representative. The two candidates with the highest number of votes were elected.
Former U.S. Representative Michael N. Castle, a Republican and former Governor of Delaware, had held this seat easily from January 1993 until his retirement in January 2011 after his unsuccessful bid for the Republican nomination to run for the U.S. Senate.
List of Representatives
| # | Representative | Years | Party | Congress(es) | Electoral history |
|---|---|---|---|---|---|
| 1 | 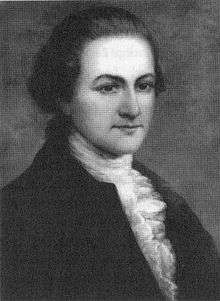 John M. Vining John M. Vining |
March 4, 1789 – March 4, 1793 |
Pro- Administration |
1 2 |
Elected in 1789 [Data unknown/missing. You can help!] |
| 2 |  John Patten John Patten |
March 4, 1793 – February 14, 1794 |
Anti- Administration |
3 | Elected in 1792 [Data unknown/missing. You can help!] |
| 3 |  Henry Latimer Henry Latimer |
February 14, 1794 – February 7, 1795 |
Pro- Administration |
3 | Elected in 1794 [Data unknown/missing. You can help!] |
| 4 | John Patten |
March 4, 1795 – March 4, 1797 |
Democratic- Republican |
4 | Elected in 1794 [Data unknown/missing. You can help!] |
| 5 |  James A. Bayard, Sr. James A. Bayard, Sr. |
March 4, 1797 – March 4, 1803 |
Federalist | 5 6 7 |
Elected in 1796 [Data unknown/missing. You can help!] |
| 6 |  Caesar A. Rodney Caesar A. Rodney |
March 4, 1803 – March 4, 1805 |
Democratic- Republican |
8 17 |
Elected in 1802 [Data unknown/missing. You can help!] |
| 7 |  James M. Broom James M. Broom |
March 4, 1805 – October 6, 1807 |
Federalist | 9 10 |
Elected in 1804 [Data unknown/missing. You can help!] |
| 8 |  Nicholas Van Dyke Nicholas Van Dyke |
October 6, 1807 – March 4, 1811 |
Federalist | 10 11 |
Elected in 1807 [Data unknown/missing. You can help!] |
| 9 |  Henry M. Ridgely Henry M. Ridgely |
March 4, 1811 – March 4, 1815 |
Federalist | 12 13 |
Elected in 1810 [Data unknown/missing. You can help!] |
| 10 |  Thomas Clayton Thomas Clayton |
March 4, 1815 – March 4, 1817 |
Federalist | 14 | Elected in 1814 [Data unknown/missing. You can help!] |
| 11 | 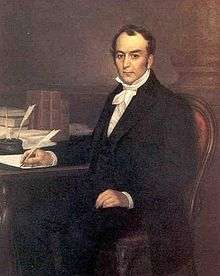 Louis McLane Louis McLane |
March 4, 1817 – March 4, 1827 |
Federalist | 15 16 17 |
Elected in 1816 [Data unknown/missing. You can help!] |
| Crawford Federalist | 18 | ||||
| Jacksonian | 19 | ||||
| 12 |  Kensey Johns, Jr. Kensey Johns, Jr. |
October 2, 1827 – March 4, 1831 |
Adams | 20 | Elected in 1827 [Data unknown/missing. You can help!] |
| Anti- Jacksonian |
21 | ||||
| 13 |  John J. Milligan John J. Milligan |
March 4, 1831 – March 4, 1839 |
Anti- Jacksonian |
22 23 24 |
Elected in 1830 [Data unknown/missing. You can help!] |
| Whig | 25 | ||||
| 14 | Thomas Robinson, Jr. |
March 4, 1839 – March 4, 1841 |
Democratic | 26 | Elected in 1838 [Data unknown/missing. You can help!] |
| 15 | George B. Rodney |
March 4, 1841 – March 4, 1845 |
Whig | 27 28 |
Elected in 1840 [Data unknown/missing. You can help!] |
| 16 | John W. Houston |
March 4, 1845 – March 4, 1851 |
Whig | 29 30 31 |
Elected in 1844 [Data unknown/missing. You can help!] |
| 17 |  George R. Riddle George R. Riddle |
March 4, 1851 – March 4, 1855 |
Democratic | 32 33 |
Elected in 1850 [Data unknown/missing. You can help!] |
| 18 | Elisha D. Cullen |
March 4, 1855 – March 4, 1857 |
Know Nothing |
34 | Elected in 1854 [Data unknown/missing. You can help!] |
| 19 |  William G. Whiteley William G. Whiteley |
March 4, 1857 – March 4, 1861 |
Democratic | 35 36 |
Elected in 1856 [Data unknown/missing. You can help!] |
| 20 |  George P. Fisher George P. Fisher |
March 4, 1861 – March 4, 1863 |
Republican | 37 | Elected in 1860 [Data unknown/missing. You can help!] |
| 21 |  William Temple William Temple |
March 4, 1863 – May 28, 1863 |
Democratic | 38 | Elected in 1862 [Data unknown/missing. You can help!] |
| 22 | Nathaniel B. Smithers |
December 7, 1863 – March 4, 1865 |
Republican | 38 | Elected in 1863 [Data unknown/missing. You can help!] |
| 23 |  John A. Nicholson John A. Nicholson |
March 4, 1865 – March 4, 1869 |
Democratic | 39 40 |
Elected in 1864 [Data unknown/missing. You can help!] |
| 24 |  Benjamin T. Biggs Benjamin T. Biggs |
March 4, 1869 – March 4, 1873 |
Democratic | 41 42 |
Elected in 1868 [Data unknown/missing. You can help!] |
| 25 | James R. Lofland |
March 4, 1873 – March 4, 1875 |
Republican | 43 | Elected in 1872 [Data unknown/missing. You can help!] |
| 26 |  James Williams James Williams |
March 4, 1875 – March 4, 1879 |
Democratic | 44 45 |
Elected in 1874 [Data unknown/missing. You can help!] |
| 27 | Edward L. Martin |
March 4, 1879 – March 4, 1883 |
Democratic | 46 47 |
Elected in 1878 [Data unknown/missing. You can help!] |
| 28 | Charles B. Lore |
March 4, 1883 – March 4, 1887 |
Democratic | 48 49 |
Elected in 1882 [Data unknown/missing. You can help!] |
| 29 | John B. Penington |
March 4, 1887 – March 4, 1891 |
Democratic | 50 51 |
Elected in 1886 [Data unknown/missing. You can help!] |
| 30 |  John W. Causey John W. Causey |
March 4, 1891 – March 4, 1895 |
Democratic | 52 53 |
Elected in 1890 [Data unknown/missing. You can help!] |
| 31 |  Jonathan S. Willis Jonathan S. Willis |
March 4, 1895 – March 4, 1897 |
Republican | 54 | Elected in 1894 [Data unknown/missing. You can help!] |
| 32 | L. Irving Handy |
March 4, 1897 – March 4, 1899 |
Democratic | 55 | Elected in 1896 [Data unknown/missing. You can help!] |
| 33 |  John H. Hoffecker John H. Hoffecker |
March 4, 1899 – June 16, 1900 |
Republican | 56 | Elected in 1898 [Data unknown/missing. You can help!] |
| 34 | Walter O. Hoffecker |
November 6, 1900 – March 4, 1901 |
Republican | 56 | Elected in 1900 [Data unknown/missing. You can help!] |
| 35 |  L. Heisler Ball L. Heisler Ball |
March 4, 1901 – March 4, 1903 |
Republican | 57 | Elected in 1900 [Data unknown/missing. You can help!] |
| 36 | Henry A. Houston |
March 4, 1903 – March 4, 1905 |
Democratic | 58 | Elected in 1902 [Data unknown/missing. You can help!] |
| 37 |  Hiram R. Burton Hiram R. Burton |
March 4, 1905 – March 4, 1909 |
Republican | 59 60 |
Elected in 1904 [Data unknown/missing. You can help!] |
| 38 | William H. Heald |
March 4, 1909 – March 4, 1913 |
Republican | 61 62 |
Elected in 1908 [Data unknown/missing. You can help!] |
| 39 |  Franklin Brockson Franklin Brockson |
March 4, 1913 – March 4, 1915 |
Democratic | 63 | Elected in 1912 [Data unknown/missing. You can help!] |
| 40 |  Thomas W. Miller Thomas W. Miller |
March 4, 1915 – March 4, 1917 |
Republican | 64 | Elected in 1914 [Data unknown/missing. You can help!] |
| 41 |  Albert F. Polk Albert F. Polk |
March 4, 1917 – March 4, 1919 |
Democratic | 65 | Elected in 1916 [Data unknown/missing. You can help!] |
| 42 |  Caleb R. Layton Caleb R. Layton |
March 4, 1919 – March 4, 1923 |
Republican | 66 67 |
Elected in 1918 [Data unknown/missing. You can help!] |
| 43 |  William H. Boyce William H. Boyce |
March 4, 1923 – March 4, 1925 |
Democratic | 68 | Elected in 1922 [Data unknown/missing. You can help!] |
| 44 |  Robert G. Houston Robert G. Houston |
March 4, 1925 – March 4, 1933 |
Republican | 69 70 71 72 |
Elected in 1924 [Data unknown/missing. You can help!] |
| 45 | Wilbur L. Adams |
March 4, 1933 – January 3, 1935 |
Democratic | 73 | Elected in 1932 [Data unknown/missing. You can help!] |
| 46 |  J. George Stewart J. George Stewart |
January 3, 1935 – January 3, 1937 |
Republican | 74 | Elected in 1934 [Data unknown/missing. You can help!] |
| 47 | William F. Allen |
January 3, 1937 – January 3, 1939 |
Democratic | 75 | Elected in 1936 [Data unknown/missing. You can help!] |
| 48 | George S. Williams |
January 3, 1939 – January 3, 1941 |
Republican | 76 | Elected in 1938 [Data unknown/missing. You can help!] |
| 49 | Philip A. Traynor |
January 3, 1941 – January 3, 1943 |
Democratic | 77 | Elected in 1940 [Data unknown/missing. You can help!] |
| 50 | Earle D. Willey |
January 3, 1943 – January 3, 1945 |
Republican | 78 | Elected in 1942 [Data unknown/missing. You can help!] |
| 51 | Philip A. Traynor |
January 3, 1945 – January 3, 1947 |
Democratic | 79 | Elected in 1944 [Data unknown/missing. You can help!] |
| 52 |  J. Caleb Boggs J. Caleb Boggs |
January 3, 1947 – January 3, 1953 |
Republican | 80 81 82 |
Elected in 1946 [Data unknown/missing. You can help!] |
| 53 | .jpg) Herbert B. Warburton Herbert B. Warburton |
January 3, 1953 – January 3, 1955 |
Republican | 83 | Elected in 1952 [Data unknown/missing. You can help!] |
| 54 |  Harris B. McDowell, Jr. Harris B. McDowell, Jr. |
January 3, 1955 – January 3, 1957 |
Democratic | 84 | Elected in 1954 [Data unknown/missing. You can help!] |
| 55 | .jpg) Harry G. Haskell, Jr. Harry G. Haskell, Jr. |
January 3, 1957 – January 3, 1959 |
Republican | 85 | Elected in 1956 [Data unknown/missing. You can help!] |
| 56 | Harris B. McDowell, Jr. |
January 3, 1959 – January 3, 1967 |
Democratic | 86 87 88 89 |
Elected in 1958 [Data unknown/missing. You can help!] |
| 57 | .jpg) Bill Roth Bill Roth |
January 3, 1967 – December 31, 1970 |
Republican | 90 91 |
Elected in 1966 [Data unknown/missing. You can help!] |
| 58 |  Pierre S. du Pont IV Pierre S. du Pont IV |
January 3, 1971 – January 3, 1977 |
Republican | 92 93 94 |
Elected in 1970 [Data unknown/missing. You can help!] |
| 59 |  Thomas B. Evans, Jr. Thomas B. Evans, Jr. |
January 3, 1977 – January 3, 1983 |
Republican | 95 96 97 |
Elected in 1976 [Data unknown/missing. You can help!] |
| 60 |  Tom Carper Tom Carper |
January 3, 1983 – January 3, 1993 |
Democratic | 98 99 100 101 102 |
Elected in 1982 Retired to run for Governor of Delaware |
| 61 |  Michael Castle Michael Castle |
January 3, 1993 – January 3, 2011 |
Republican | 103 104 105 106 107 108 109 110 111 |
Elected in 1992 Retired to run for U.S. Senate |
| 62 | 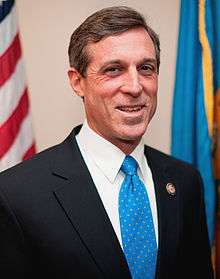 John Carney John Carney |
January 3, 2011 – January 3, 2017 |
Democratic | 112 113 114 |
Elected in 2010 Re-elected in 2012 Re-elected in 2014 Retiring after being elected Governor of Delaware |
| 63 | Lisa Blunt Rochester |
January 3, 2017 – |
Democratic | 115 | Elected in 2016 |
Second at-large seat: 1813–1823
From 1813 to 1823, Delaware elected two members of the United States House of Representatives. Both were elected statewide at-large. This is a list of the four men who held that second seat during that decade.
| # | Representative | Years | Party | Congress | Electoral history |
|---|---|---|---|---|---|
| 1 | Thomas Cooper |
March 4, 1813 – March 3, 1817 |
Federalist | 13 14 |
Elected in 1812 Re-elected in 1814 [Data unknown/missing. You can help!] |
| 2 |  Willard Hall Willard Hall |
March 4, 1817 – January 22, 1821 |
Democratic- Republican |
15 | Elected in 1816 Re-elected in 1818 Lost re-election and resigned early |
| 16 | |||||
| Vacant | January 22, 1821 – March 4, 1821 |
||||
| 3 | Caesar A. Rodney |
March 4, 1821 – January 24, 1822 |
Democratic- Republican |
17 | Elected in 1820 Resigned when elected to the U.S. Senate |
| Vacant | January 24, 1822 – October 1, 1822 |
||||
| 4 |  Daniel Rodney Daniel Rodney |
October 1, 1822 – March 3, 1823 |
Federalist | Elected in 1822 to finish his cousin's term [Data unknown/missing. You can help!] | |
Recent election results
|
1920 • 1922 • 1924 • 1926 • 1928 • 1930 • 1932 • 1934 • 1936 • 1938 • 1940 • 1942 • 1944 • 1946 • 1948 • 1950 • 1952 • 1954 • 1956 • 1958 • 1960 • 1962 • 1964 • 1966 • 1968 • 1970 • 1972 • 1974 • 1976 • 1978 • 1980 • 1982 • 1984 • 1986 • 1988 • 1990 • 1992 • 1994 • 1996 • 1998 • 2000 • 2002 • 2004 • 2006 • 2008 • 2010 • 2012 • 2014 |
1920
| Party | Candidate | Votes | % | |
|---|---|---|---|---|
| Republican | Caleb R. Layton (incumbent) | 52,145 | 56% | |
| Democratic | James R. Clements | 40,206 | 43% | |
| Socialist | Robert A. Walker | 1,063 | .01% | |
| Independent | Howard T. Ennis | 196 | 0.02% | |
| Total votes | 93,609 | 100% | ||
| Voter turnout | % | |||
| Republican hold | ||||
1922
| Party | Candidate | Votes | % | |||
|---|---|---|---|---|---|---|
| Democratic | William H. Boyce | 39,126 | 54% | |||
| Republican | Caleb R. Layton (incumbent) | 32,577 | 45% | |||
| Independent | Frank A. Houck | 908 | .01% | |||
| Total votes | 72,611 | 100% | ||||
| Voter turnout | % | |||||
| Democratic gain from Republican | ||||||
1924
| Party | Candidate | Votes | % | |||
|---|---|---|---|---|---|---|
| Republican | Robert G. Houston | 51,536 | 59% | |||
| Democratic | William H. Boyce (incumbent) | 35,943 | 41% | |||
| Independent | Florence Garvin | 519 | 0.05 | |||
| Total votes | 87,998 | 100% | ||||
| Voter turnout | % | |||||
| Republican gain from Democratic | ||||||
1926
| Party | Candidate | Votes | % | |
|---|---|---|---|---|
| Republican | Robert G. Houston (incumbent) | 38,919 | 52% | |
| Democratic | Merrill H. Tilghman | 35,943 | 48% | |
| Total votes | 74,862 | 100% | ||
| Voter turnout | % | |||
| Republican hold | ||||
1928
| Party | Candidate | Votes | % | |
|---|---|---|---|---|
| Republican | Robert G. Houston (incumbent) | 66,361 | 64% | |
| Democratic | John M. Richardson | 38,045 | 36% | |
| Total votes | 104,406 | 100% | ||
| Voter turnout | % | |||
| Republican hold | ||||
1930
| Party | Candidate | Votes | % | |
|---|---|---|---|---|
| Republican | Robert G. Houston (incumbent) | 48,493 | 56% | |
| Democratic | John P. Le Fevre | 38,391 | 44% | |
| Independent | Arnold Williams | 127 | 0.01% | |
| Total votes | 87,011 | 100% | ||
| Voter turnout | % | |||
| Republican hold | ||||
1932
| Party | Candidate | Votes | % | |||
|---|---|---|---|---|---|---|
| Democratic | Wilbur L. Adams | 51,698 | 46% | |||
| Republican | Reuben Satterthwaite, Jr. | 48,841 | 44% | |||
| Prohibition | Francis B. Short | 10,560 | 9% | |||
| Socialist | Edgar G. Shaeffer | 887 | 0.08% | |||
| Communist | Frank Rhoades | 110 | 0.01% | |||
| Total votes | 112,096 | 100% | ||||
| Voter turnout | % | |||||
| Democratic gain from Republican | ||||||
1934
| Party | Candidate | Votes | % | |||
|---|---|---|---|---|---|---|
| Republican | J. George Stewart | 52,829 | 53% | |||
| Democratic | John C. Hazzard | 45,771 | 46% | |||
| Socialist | William A. Mayor | 404 | 0.4% | |||
| Communist | Joseph P. Daniels | 58 | .006% | |||
| Total votes | 99,062 | 100% | ||||
| Voter turnout | % | |||||
| Republican gain from Democratic | ||||||
1936
| Party | Candidate | Votes | % | |||
|---|---|---|---|---|---|---|
| Democratic | William F. Allen | 65,485 | 52% | |||
| Republican | J. George Stewart (incumbent) | 55,664 | 44% | |||
| Republican | James A. Ellison | 5,338 | 4% | |||
| Socialist | William A. Mayor | 176 | 0.01% | |||
| Total votes | 126,663 | 100% | ||||
| Voter turnout | % | |||||
| Democratic gain from Republican | ||||||
1938
| Party | Candidate | Votes | % | |||
|---|---|---|---|---|---|---|
| Republican | George S. Williams | 60,661 | 56% | |||
| Democratic | William F. Allen (incumbent) | 46,989 | 43% | |||
| Republican | William J. Highfield | 816 | 0.07% | |||
| Progressive | Ralph L. Brown | 105 | 0.01% | |||
| Total votes | 108,571 | 100% | ||||
| Voter turnout | % | |||||
| Republican gain from Democratic | ||||||
1940
| Party | Candidate | Votes | % | |||
|---|---|---|---|---|---|---|
| Democratic | Philip A. Traynor | 68,205 | 51% | |||
| Republican | George S. Williams (incumbent) | 64,384 | 48% | |||
| Independent | Royden C. Caulk | 816 | 0.06% | |||
| Total votes | 133,405 | 100% | ||||
| Voter turnout | % | |||||
| Democratic gain from Republican | ||||||
1980
| Party | Candidate | Votes | % | |
|---|---|---|---|---|
| Republican | Thomas B. Evans, Jr. (incumbent) | 133,842 | 62% | |
| Democratic | Robert Maxwell | 81,227 | 37% | |
| Libertarian | Lawrence Sullivan | 1,506 | 1% | |
| Total votes | 216,575 | 100% | ||
| Republican hold | ||||
1982
| Party | Candidate | Votes | % | |||
|---|---|---|---|---|---|---|
| Democratic | Thomas R. Carper | 98,533 | 52% | |||
| Republican | Thomas B. Evans, Jr. (incumbent) | 87,153 | 46% | |||
| American | Mary Gies | 1,109 | 1% | |||
| Libertarian | Richard Cohen | 711 | 0.38% | |||
| N/A | David Nuttall | 558 | 0.30% | |||
| Total votes | 188,064 | 100% | ||||
| Democratic gain from Republican | ||||||
1984
| Party | Candidate | Votes | % | |
|---|---|---|---|---|
| Democratic | Thomas R. Carper (incumbent) | 142,070 | 58% | |
| Republican | Elise du Pont | 100,650 | 41% | |
| Libertarian | V. Luther Etzel | 294 | 0.12% | |
| Total votes | 243,014 | 100% | ||
| Democratic hold | ||||
1986
| Party | Candidate | Votes | % | |
|---|---|---|---|---|
| Democratic | Thomas R. Carper (incumbent) | 106,351 | 66% | |
| Republican | Thomas Nueberger | 53,767 | 33% | |
| American | Patrick Harrison | 639 | 0.40% | |
| Total votes | 160,757 | 100% | ||
| Democratic hold | ||||
1988
| Party | Candidate | Votes | % | |
|---|---|---|---|---|
| Democratic | Thomas R. Carper (incumbent) | 158,338 | 68% | |
| Republican | James P. Krapf | 76,179 | 32% | |
| Total votes | 234,517 | 100% | ||
| Democratic hold | ||||
1990
| Party | Candidate | Votes | % | |
|---|---|---|---|---|
| Democratic | Thomas R. Carper (incumbent) | 116,274 | 66% | |
| Republican | Ralph Williams | 58,037 | 33% | |
| Libertarian | Richard Cohen | 3,121 | 1% | |
| N/A | Write-ins | 3 | <0.01% | |
| Total votes | 177,435 | 100% | ||
| Democratic hold | ||||
1992
| Party | Candidate | Votes | % | |||
|---|---|---|---|---|---|---|
| Republican | Mike Castle | 153,037 | 55% | |||
| Democratic | S. B. Woo | 117,426 | 43% | |||
| Libertarian | Peggy Schmitt | 5,661 | 2% | |||
| Total votes | 276,124 | 100% | ||||
| Republican gain from Democratic | ||||||
1994
| Party | Candidate | Votes | % | |
|---|---|---|---|---|
| Republican | Mike Castle (incumbent) | 137,945 | 71% | |
| Democratic | Carol Ann DeSantis | 51,793 | 27% | |
| Libertarian | Danny Ray Beaver | 3,866 | 2% | |
| Delaware Independent | Donald M. Hockmuth | 1,404 | 0.72% | |
| Total votes | 195,008 | 100% | ||
| Republican hold | ||||
1996
| Party | Candidate | Votes | % | |
|---|---|---|---|---|
| Republican | Mike Castle (incumbent) | 185,577 | 70% | |
| Democratic | Dennis E. Williams | 73,258 | 27% | |
| Libertarian | George A. Jurgensen | 4,000 | 2% | |
| Constitution | Felicia B. Johnson | 3,009 | 1% | |
| Natural Law | Bob Mattson | 987 | 0.37% | |
| Total votes | 266,831 | 100% | ||
| Republican hold | ||||
1998
| Party | Candidate | Votes | % | |
|---|---|---|---|---|
| Republican | Mike Castle (incumbent) | 119,811 | 66% | |
| Democratic | Micheal C. Miller | 57,446 | 32% | |
| Constitution | James P. Webster | 2,411 | 1% | |
| Natural Law | Kim Stanley Bemis | 859 | 1% | |
| N/A | Write-ins | 2 | <0.01% | |
| Total votes | 180,529 | 100% | ||
| Republican hold | ||||
2000
| Party | Candidate | Votes | % | |
|---|---|---|---|---|
| Republican | Mike Castle (incumbent) | 211,797 | 68% | |
| Democratic | Micheal C. Miller | 96,488 | 31% | |
| Constitution | James P. Webster | 2,490 | 0.5% | |
| Libertarian | Brad C. Thomas | 2,351 | 0.5% | |
| Total votes | 313,126 | 100% | ||
| Republican hold | ||||
2002
| Party | Candidate | Votes | % | |
|---|---|---|---|---|
| Republican | Mike Castle (incumbent) | 164,605 | 72% | |
| Democratic | Micheal C. Miller | 61,011 | 27% | |
| Libertarian | Brad C. Thomas | 2,789 | 1% | |
| Total votes | 228,405 | 100% | ||
| Republican hold | ||||
2004
| Party | Candidate | Votes | % | |
|---|---|---|---|---|
| Republican | Mike Castle (incumbent) | 245,978 | 69% | |
| Democratic | Paul Donnelly | 105,716 | 30% | |
| Delaware Independent | Maurice J. Barros (write-in) | 2,337 | 0.5% | |
| Libertarian | William E. Morris | 2,014 | 0.5% | |
| Total votes | 356,045 | 100% | ||
| Republican hold | ||||
2006
| Party | Candidate | Votes | % | |
|---|---|---|---|---|
| Republican | Mike Castle (incumbent) | 143,897 | 57% | |
| Democratic | Dennis Spivack | 97,565 | 39% | |
| Delaware Independent | Karen M. Hartley-Nagle | 5,769 | 2% | |
| Green | Michael Berg | 4,463 | 2% | |
| Total votes | 251,694 | 100% | ||
| Republican hold | ||||
2008
| Party | Candidate | Votes | % | |
|---|---|---|---|---|
| Republican | Michael Castle (incumbent) | 235,437 | 61% | |
| Democratic | Karen Hartley-Nagle | 146,434 | 38% | |
| Libertarian | Mark Parks | 3,586 | 1% | |
| Total votes | 385,457 | 100% | ||
| Republican hold | ||||
2010
| Party | Candidate | Votes | % | |||
|---|---|---|---|---|---|---|
| Democratic | John Carney | 173,543 | 57% | |||
| Republican | Glen Urquhart | 125,442 | 41% | |||
| Independent | Earl R. Lofland | 3,704 | 1% | |||
| Libertarian | Brent Wangen | 1,986 | 1% | |||
| Independent | Jeffrey Brown | 961 | 0.31% | |||
| Total votes | 305,636 | 100% | ||||
| Voter turnout | % | |||||
| Democratic gain from Republican | ||||||
2012
| Party | Candidate | Votes | % | |
|---|---|---|---|---|
| Democratic | John Carney (incumbent) | 249,905 | 64% | |
| Republican | Tom Kovach | 129,749 | 33% | |
| Green | Bernard August | 4,273 | 2% | |
| Libertarian | Scott Gesty | 4,096 | 1% | |
| Total votes | 388,023 | 100% | ||
| Democratic hold | ||||
2014
| Party | Candidate | Votes | % | |
|---|---|---|---|---|
| Democratic | John Carney (incumbent) | 137,251 | 59% | |
| Republican | Rose Izzo | 85,146 | 37% | |
| Green | Bernard August | 4,801 | 2% | |
| Libertarian | Scott Gesty | 4,419 | 2% | |
| Total votes | 231,617 | 100% | ||
| Democratic hold | ||||
Living former Members
As of July 2016, there are five former members of the U.S. House of Representatives from Delaware's at-large congressional district who are currently living at this time.
| Representative | Term of office | District | Date of birth (and age) |
|---|---|---|---|
| Harry G. Haskell, Jr. | 1957–1959 | At-large | May 27, 1921 |
| Pierre S. du Pont IV | 1971–1977 | At-large | January 22, 1935 |
| Thomas B. Evans, Jr. | 1977–1983 | At-large | November 5, 1931 |
| Tom Carper | 1983–1993 | At-large | January 23, 1947 |
| Michael Castle | 1993–2011 | At-large | July 2, 1939 |
References
- Barone, Michael; Richard E. Cohen (2005). The Almanac of American Politics. Washington: National Journal Group. ISBN 0-89234-112-2.
- Martin, Roger A. (1995). Memoirs of the Senate. Newark, DE: Roger A. Martin.
- ↑ http://clerk.house.gov/member_info/electionInfo/1980/1980Stat.htm#8
- ↑ http://clerk.house.gov/member_info/electionInfo/1982/1982Stat.htm#8
- ↑ http://clerk.house.gov/member_info/electionInfo/1984/1984Stat.htm#8
- ↑ http://clerk.house.gov/member_info/electionInfo/1986/1986Stat.htm#8
- ↑ http://clerk.house.gov/member_info/electionInfo/1988/1988Stat.htm#8
- ↑ http://clerk.house.gov/member_info/electionInfo/1990/1990Stat.htm#8
- ↑ http://clerk.house.gov/member_info/electionInfo/1992/1992Stat.htm#8
- ↑ http://clerk.house.gov/member_info/electionInfo/1994/1994Stat.htm#8
- ↑ http://clerk.house.gov/member_info/electionInfo/1996/1996Stat.htm#8
- ↑ http://clerk.house.gov/member_info/electionInfo/1998/1998Stat.htm#8
- ↑ http://clerk.house.gov/member_info/electionInfo/2000/2000Stat.htm#8
- ↑ http://clerk.house.gov/member_info/electionInfo/2002/2002Stat.htm#8
- ↑ http://clerk.house.gov/member_info/electionInfo/2004/2004Stat.htm#8
- ↑ http://clerk.house.gov/member_info/electionInfo/2006/2006Stat.htm#8
- ↑ "State of Delaware Primary Election Official Results". State of Delaware. Retrieved November 7, 2012.
- ↑ "State of Delaware General Election (Official Results)". State of Delaware Election Commissioner. Retrieved November 27, 2014.