Deficit reduction in the United States
| This article is part of a series on the |
| Budget and debt in the United States of America |
|---|
  |
|
Programs |
|
Contemporary issues In specific years |
|
Terminology |
Deficit reduction in the United States refers to taxation, spending, and economic policy debates and proposals designed to reduce the Federal budget deficit. Government agencies including the Government Accountability Office (GAO), Congressional Budget Office (CBO), the Office of Management and Budget (OMB) and the U.S. Treasury Department have reported that the federal government is facing a series of important long-run financing challenges, mainly driven by an aging population, rising healthcare costs per person, and rising interest payments on the national debt.
CBO reported in July 2014 that the continuation of present tax and spending policies for the long-run (into the 2030s) results in a budget trajectory that causes debt to grow faster than GDP, which is "unsustainable." Further, CBO reported that high levels of debt relative to GDP may pose significant risks to economic growth and the ability of lawmakers to respond to crises.[1]
President-elect Donald J. Trump has proposed policies including significant tax cuts and increased spending on defense and infrastructure. The Committee for a Responsible Federal Budget and Moody's Analytics reported in 2016 that enacting these policies would dramatically increase the annual budget deficits and national debt over the 2017-2026 periods, relative to the current policy baseline, which already includes a sizable debt increase.[2][3]
Understanding key terms


A budget deficit refers to expenditures that exceed tax collections during a given period and require borrowing to fund the difference. The U.S. federal government has run annual deficits in 36 of the past 40 fiscal years, with surpluses from 1998-2001. Debt represents the accumulation of deficits over time. Debt held by the public, a partial measure of the U.S. national debt representing securities held by investors, rose in dollar terms each year except during the 1998-2001 surplus period. Total national debt rose in dollar terms each year from 1972-2014.[4]
The budget deficit and debt challenge can be described using various measures:[5]
- Dollars: The 2014 deficit was approximately $486 billion, with tax revenues of $2.75 trillion and spending or outlays of $3.45 trillion. CBO projected in February 2013 that the debt held by the public will rise from $11.3 trillion in 2012 to $18.9 trillion in 2022 under its "baseline scenario," an increase of $7.6 trillion over 10 years. The total national debt will rise from $16 trillion in 2012 to $24.9 trillion by 2022, an increase of $8.9 trillion.[6]
- Deficit as percentage of the size of the economy (GDP): The historical average annual deficit pre-2008 was about 3% GDP, with 18% GDP average tax revenues and 21% GDP average expenditures. However, in 2009 the deficit rose to 10% GDP due to a combination of economic conditions and policy choices. It then fell as a % GDP for five consecutive years back to 2.8% GDP in 2014. With GDP of $16.8 trillion in 2013, 1% GDP represents approximately $170 billion.
- Debt as a percentage of GDP: Debt held by the public ranged between 23% GDP and 50% GDP during the 1971-2007 period, then rose significantly in the wake of the financial crisis and recession, ending FY2014 at about 75% GDP. As of September 30, 2014 debt held by the public was approximately $12.79 trillion. Intra-governmental debt, such as the Social Security trust fund, was at $5.03 trillion, giving a combined public debt or national debt of $17.82 trillion or about 105% GDP.[7] The debt-to-GDP ratio is projected to continue rising if the U.S. continues current policies.
- Unfunded liabilities: This is an actuarial concept used to measure the value in today's dollars of a difference between tax revenue and expenditures for particular programs. This concept is described further below in the sections on Social Security and Medicare.
CBO projections
The Congressional Budget Office is a key official source of budget historical information and projections of future revenues, expenses, deficits, and debt under various scenarios.
Overview
CBO publishes a report annually ("Options for Reducing the Deficit") with an extensive list of policy options and their impact on the deficit. CBO reported in November 2013 that addressing the long-term debt challenge would require reducing future budget deficits. Lawmakers would need to increase revenues further relative to the size of the economy, decrease spending on Social Security or major health care programs relative to current law, cut other federal spending to even lower levels by historical standards, or adopt a combination of these approaches.[8]
CBO reported that: "The amount of deficit reduction that would be needed would depend on lawmakers’ objectives for federal debt. For example:
- Decreasing that debt in 2038 to just below 70% GDP—slightly less than what it is now but still quite high by historical standards—could be achieved if deficits were reduced by $2 trillion (excluding interest costs) during the next decade, and the reduction in the deficit as a percentage of output in 2023 was maintained in later years.
- Lowering the debt in 25 years to about 30% GDP—which would be a little below the average over the past 40 years—could be achieved by reducing deficits by $4 trillion (excluding interest costs) during the next decade and maintaining that reduction in subsequent years.
- Achieving savings of $2 trillion or more during the 2014-2023 period would require significant increases in taxes, significant cuts in federal benefits or services, or both."[8]
Short-term
CBO reported in October 2014 that: "The federal government ran a budget deficit of $486 billion in fiscal year 2014, the Congressional Budget Office (CBO) estimates—$195 billion less than the shortfall recorded in fiscal year 2013, and the smallest deficit recorded since 2008. Relative to the size of the economy, that deficit—at an estimated 2.8 percent of gross domestic product (GDP)—was slightly below the average experienced over the past 40 years, and 2014 was the fifth consecutive year in which the deficit declined as a percentage of GDP since peaking at 9.8 percent in 2009. By CBO's estimate, revenues were about 9 percent higher and outlays were about 1 percent higher in 2014 than they were in the previous fiscal year."[9]
Next Ten Years: 2015-2024
CBO reported in July 2014 that:
- "If current laws governing taxes and spending stayed generally the same—an assumption that underlies CBO’s 10-year baseline budget projections—the anticipated further strengthening of the economy and constraints on federal spending built into law would keep deficits between 2.5% and 3% of GDP from 2015 through 2018..."
- "In succeeding years, however, deficits would become notably larger under current law. The pressures stemming from an aging population, rising health care costs, and an expansion of federal subsidies for health insurance would cause spending for some of the largest federal programs to increase relative to GDP. Moreover, CBO expects interest rates to rebound in coming years from their current unusually low levels, raising the government’s interest payments. That additional spending would contribute to larger budget deficits—equaling close to 4 percent of GDP—toward the end of the 10-year period spanned by the baseline, CBO anticipates. Altogether, deficits during that 2015–2024 period would total about $7.6 trillion."
- "With deficits expected to remain close to their current percentage of GDP for the next few years, federal debt held by the public is projected to stay between 72% and 74% of GDP from 2015 through 2020. Thereafter, larger deficits would boost debt to 78% of GDP by the end of 2024."[1]
Long-term
CBO projected in July 2014 that:
- "The gap between federal spending and revenues would widen after 2015 under the assumptions of the extended baseline...By 2039, the deficit would equal 6.5% GDP, larger than in any year between 1947 and 2008, and federal debt held by the public would reach 106% of GDP, more than in any year except 1946—even without factoring in the economic effects of growing debt."
- "Beyond the next 25 years, the pressures caused by rising budget deficits and debt would become even greater unless laws governing taxes and spending were changed. With deficits as big as the ones that CBO projects, federal debt would be growing faster than GDP, a path that would ultimately be unsustainable."[1]
Risks
There are several risks associated with high and rising debt levels. However, when an economy is growing slowly and unemployment is elevated, there is risk that a budget deficit is too small. When the private sector is unable to grow the economy sufficiently, government spending can make up for the shortfall, although this increases the deficit and debt in the short-run. Many economists have argued, as Keynes did, that the time for fiscal austerity is during the economic boom, not the bust.[10][11]
High debt levels
The CBO reported several types of risk factors related to high and rising debt levels in a July 2010 publication:
- A growing portion of savings would go towards purchases of government debt, rather than investments in productive capital goods such as factories and computers, leading to lower output and incomes than would otherwise occur;
- If higher marginal tax rates were used to pay rising interest costs, savings would be reduced and work would be discouraged;
- Rising interest costs would force reductions in important government programs;
- Restrictions to the ability of policymakers to use fiscal policy to respond to economic challenges; and
- An increased risk of a sudden fiscal crisis, in which investors demand higher interest rates.[12]
Risks to economic growth from reducing deficits
Reducing the budget deficit by tax increases or spending cuts may slow economic growth. One example was the United States fiscal cliff which referred to a series of tax increases and spending cuts scheduled to go into effect at the end of 2012. The risks arose primarily from the expiration of the Bush tax cuts and implementation of the Budget Control Act of 2011. CBO projected that economic growth would have slowed considerably in 2013 if the tax hikes and spending cuts had gone into effect, with the 2013 GDP growth rate dropping from +1.7% to -0.5% (causing a mild recession) and higher unemployment. Most of the tax increases were avoided by the American Taxpayer Relief Act, although the spending cuts from the Budget Control Act (also referred to as "the sequester") were not addressed.[13]
Loss of credit rating
A lowered credit rating can result in investors demanding higher interest rates or more difficulty raising funds in global financial markets. On August 5, 2011, S&P made the decision to give a first-ever downgrade to U.S. sovereign debt, lowering the rating one notch to a "AA+" rating, with a negative outlook.[14] S&P stated that "[w]e lowered our long-term rating on the U.S. because we believe that the prolonged controversy over raising the statutory debt ceiling and the related fiscal policy debate indicate that further near-term progress containing the growth in public spending, especially on entitlements, or on reaching an agreement on raising revenues is less likely than we previously assumed and will remain a contentious and fitful process."[14]
However, despite the lowered credit rating by S&P, other agencies did not follow suit and the U.S. has been able to borrow at record low interest rates through November 2012.[15]
Fiscal crisis and inflation
There is a risk that some investors may someday decide that the deficit or debt is out of control and refuse to invest in U.S. Treasury bonds. This would likely mean that the Federal Reserve would have to purchase them, increasing inflation due to money creation. However, in 2012 both interest rates and inflation were extremely low, indicating this risk was very unlikely to be realized in the short-run. In traditional economic models, inflation becomes more of a risk when the economy is closer to its capacity, because consumers are demanding more goods and services relative to supply, bidding up prices. There is significant slack in the economy since the 2008 crisis began, making inflation unlikely. Further, if the economy strongly picked up and inflation became a risk, the deficit would likely fall due to higher tax revenue and lower safety net costs, lowering the risk of a fiscal crisis.[16]
General strategies for deficit reduction

Strategies for addressing the deficit problem may include policy choices regarding taxation and spending, along with policies designed to increase economic growth and reduce unemployment. These policy decisions may be evaluated in the context of a framework:[17][18]
- Promote economic growth and employment: A fast-growing economy offers the win-win outcome of a larger proverbial economic pie to divide, with higher employment and tax revenues, lower safety net spending and a lower debt-to-GDP ratio.
- Make equitable trade-offs: Many budget choices have win-lose outcomes, reflecting how government revenues are divided, with some benefiting and others incurring costs. For example, taking away benefits from those in or near retirement may be considered inequitable, while phasing out retirement benefits for younger workers may be considered less so.
- Keep short- and long-term issues in perspective: Healthcare cost inflation and an aging population are the primary long-term deficit drivers. Unemployment and various tax and spending policy choices are the primary short-term deficit drivers. Measures to encourage economic growth today can be implemented along with other measures to reduce future deficits.[19]
- Limit or avoid future spending increases: Policy choices may focus on preventing future increases via freezes or reducing annual rates of increase. Annual growth rates since 2001 in the top three expenditure categories (Healthcare, Social Security, and Defense) are far above the economic growth rate. In the long-run, expenditures related to healthcare programs such as Medicare and Medicaid are projected to grow faster than the economy overall as the population matures.[20][21]
- Invest productively: Some spending can be categorized as investments that lower future deficits. For example, if infrastructure, education or R&D investments could make U.S. workers and products more competitive or generate a revenue stream, these could reduce future deficits. Examples might include installing windows that reduce energy costs, toll roads and bridges, or power plants.[18]
- Avoid uncertainty and unnecessary regulation: Complex legislation may create uncertainty regarding future costs of doing business, which affects investment decisions made by businesses and households.[22]
- Implement budget process reforms: Budget rules could be implemented that require new legislation or programs to be funded by either cutting other spending or raising taxes (i.e., "Pay as you go" or PAYGO rules.)[23]
Historically, government spending increased year-over-year in nominal (i.e., unadjusted for inflation) terms from 1971 to 2009. However, by limiting the rate of growth in discretionary spending (defense and non-defense) while growing revenues, the budget was balanced from 1998-2001. From 1990 to 1999, discretionary spending grew by a total of 14%, while revenues grew 77%. In contrast, from 2000–2009, discretionary spending grew by a total of 101% while revenues grew only 4% (see graphic at right).[24] Though a balanced budget is ideal, allowing down payment on debt and more flexibility within government budgeting, limiting deficits to within 1% to 2% of GDP is sufficient to stabilize the debt.
Revenue proposals

Democrats and Republicans mean very different things when they talk about tax reform. Democrats argue for the wealthy to pay more via higher income tax rates, while Republicans focus on lowering income tax rates. While both parties discuss reducing tax expenditures (i.e., exemptions and deductions), Republicans focus on preserving lower tax rates for capital gains and dividends, while Democrats prefer educational credits and capping deductions. Political realities make it unlikely that more than $150 billion per year in individual tax expenditures could be eliminated. One area with more common ground is corporate tax rates, where both parties have generally agreed that lower rates and fewer tax expenditures would align the U.S. more directly with foreign competition.[25]
Historical perspective
During FY2012, the federal government collected approximately $2.45 trillion in tax revenue, up $147 billion or 6% versus FY2011 revenues of $2.30 trillion. Primary receipt categories included individual income taxes ($1,132B or 47%), Social Security/Social Insurance taxes ($845B or 35%), and corporate taxes ($242B or 10%).[26] Other revenue types included excise, estate and gift taxes. Revenues rose across all categories in FY2012 versus FY2011.
FY2012 revenues were 15.8% GDP, versus 15.4% GDP in FY2011. Tax revenues averaged approximately 18.3% of gross domestic product (GDP) over the 1970-2009 period, generally ranging plus or minus 2% from that level. Tax revenues are significantly affected by the economy. Recessions typically reduce government tax collections as economic activity slows. For example, tax revenues declined from $2.5 trillion in 2008 to $2.1 trillion in 2009, and remained at that level in 2010. From 2008 to 2009, individual income taxes declined 20%, while corporate taxes declined 50%. At 15.1% of GDP, the 2009 and 2010 collections were the lowest level of the past 50 years.[27]
Income tax revenue
President Obama proposed during July 2012 allowing the Bush tax cuts to expire for individual taxpayers earning over $200,000 and couples earning over $250,000, which represents the top 2% of income earners. Reverting to Clinton-era tax rates for these taxpayers would mean increases in the top rates to 36% and 39.6% from 33% and 35%. This would raise approximately $850 billion in revenue over a decade. It would also mean raising the tax rate on investment income, which is highly concentrated among the wealthy, to 20% from 15%.[28]
Allowing the Bush tax cuts to expire at all income levels would have a significant deficit reduction effect. In August 2010, CBO estimated that extending the tax cuts for the 2011-2020 time period would add $3.3 trillion to the national debt: $2.65 trillion in foregone tax revenue plus another $0.66 trillion for interest and debt service costs.[29]
The American Taxpayer Relief Act of 2012 resulted in the expiration of the lower Bush income tax rates for individual taxpayers earning over $400,000 and couples earning over $450,000. This was expected to bring in an additional $600 billion over ten years.[30]
From 2002 to 2011, the nine US states with the highest income taxes grew their economy 8.2%, all states with an income tax grew 6.3%, and the nine states without an income tax grew 5.2%.[31]
During 2012, Warren Buffett proposed establishing an minimum effective tax rate of 30% on taxpayers earning over $1 million.[32][33] This became known as the Buffett Rule. Many high income taxpayers face lower effective tax rates because a significant portion of their income is derived from capital, which is taxed at a lower level than labor. The Tax Policy Center estimated that 217,000 households would be subject to the Buffett rule, with the average tax burden increasing $190,000, a total of approximately $41 billion per year.[34]
Payroll tax revenue
President Obama reduced the Social Security payroll tax portion paid by workers by two percentage points as part of the Tax Relief, Unemployment Insurance Reauthorization, and Job Creation Act of 2010. These cuts expired at the end of 2012, increasing revenue by approximately $100 billion per year.[13]
For 2014, the maximum taxable earnings is $117,000 and for 2015 it is $118,500. Social Security payroll taxes are not paid on income over this maximum.[35] CBO estimated in 2010 that removing this maximum would add up to 0.6% GDP to tax revenue per year. Increasing the payroll tax by one percentage point today would add approximately 0.3% GDP to tax revenue per year.[36]
Corporate income tax revenue

Republicans have argued for a reduction in the corporate income tax rate, from a 35% rate to 25%, which would reduce tax revenues by $1 trillion over ten years.[37]
The corporate income tax rate of 35% is one of the highest compared to other countries. However, U.S. corporate income tax collections of 1.2% GDP in 2011 were lower than nearly all OECD countries (which average 2.5% GDP) and versus U.S. historical levels (2.7% GDP as recently as 2007).[38]
U.S. federal corporate income tax revenues have declined relative to profits, falling from approximately 27% in 2000 to 17% in 2012.[39]
In comparing corporate taxes, the Congressional Budget Office found in 2005 that the top statutory tax rate was the third highest among OECD countries behind Japan and Germany. However, the U.S. ranked 27th lowest of 30 OECD countries in its collection of corporate taxes relative to GDP, at 1.8% vs. the average 2.5%.[40]
Tax expenditures
The term "tax expenditures" refers to income exemptions or deductions that reduce the tax collections that would be made applying a particular tax rate alone. According to the Center for American Progress, annual tax expenditures have increased from $526 billion in 1982 to $1,025 billion in 2010, adjusted for inflation (measured in 2010 dollars).[41] Economist Mark Zandi wrote in July 2011 that tax expenditures should be considered a form of government spending.[42]
Republicans have proposed reducing tax expenditures (i.e., deductions and exemptions) rather than increasing income tax rates. One proposal relates to limiting the amount of income tax deductions that can be claimed. For example, 2012 Presidential Candidate Mitt Romney proposed capping itemized deductions at $25,000, which would add $1.3 trillion to tax revenues over 10 years.[37]
The Congressional Research Service reported that even though there is more than $1 trillion per year in tax expenditures, it is unlikely that more than $150 billion/year could be cut due to political support for various deductions and exemptions. For example, according to the Tax Policy Center, the home mortgage interest deduction accounted for $75 billion in foregone revenue in 2011 but over 33 million households (roughly one-third) benefited from it.[25] The Center on Budget and Policy Priorities estimated in April 2013 that approximately 77% of the benefits from the home mortgage deduction go to those earning over $100,000 per year.[43]
Value-added tax
Many nations, but not the U.S., use a federal value-added tax or VAT. A VAT tax is similar conceptually to a federal sales tax. Many economists have advocated such a tax. For example, economists William Gale and Benjamin Harris proposed a 5 percent VAT with a $450 per adult, $200 per child annual refund (which is equivalent to the spending of a family making $26,000). They estimated this would raise about $160 billion a year, or 1 percent of GDP.[44]
Spending or outlay proposals


Historical perspective
During FY 2012, the federal government spent $3.54 trillion on a budget or cash basis, down $60 billion or 1.7% vs. FY 2011 spending of $3.60 trillion. Major categories of FY 2012 spending included: Medicare & Medicaid ($802B or 23% of spending), Social Security ($768B or 22%), Defense Department ($670B or 19%), non-defense discretionary ($615B or 17%), other mandatory ($461B or 13%) and interest ($223B or 6%). Social Security spending increased versus 2011 while Defense, Medicare and Medicaid spending fell.[26]
Expenditures are classified as mandatory, with payments required by specific laws, or discretionary, with payment amounts renewed annually as part of the budget process. Expenditures averaged 20.6% GDP from 1971 to 2008, generally ranging +/-2% GDP from that level. The 2012 spend was 22.8% GDP, versus 2011 spend of 24.1% GDP.[26][27]
Defense spending
The military budget of the United States during FY 2012 was approximately $650 billion in expenses for the Department of Defense (DoD). The DoD baseline budget, excluding supplemental funding for the wars, has grown from $297 billion in FY2001 to a budgeted $534 billion for FY2010, an 81% increase. The U.S. defense budget (excluding spending for the wars in Iraq and Afghanistan, Homeland Security, and Veteran's Affairs) is around 5% of GDP. Adding these other costs places defense spending between 6% and 7% of GDP. DoD spending has fallen from as high as 7% GDP in 1971 to 3% GDP in 2000, before rising to around 5% GDP in 2012.[45] According to the CBO, defense spending grew 9% annually on average from fiscal year 2000-2009.[46]
The spending sequesters in the Budget Control Act of 2011 (BCA) essentially freeze defense spending in current dollar terms for the 2013-2022 period, limiting growth to approximately 1.5% per year (about the rate of inflation) versus approximately 8% over the past decade. CBO estimated defense spending under the sequester (excluding war spending called "overseas contingency operations") from 2012 to 2021 would be $5.8 trillion, versus $6.3 trillion estimated prior to passage of the BCA, an avoidance of about $500 billion in additional spending over a decade.[45]
Non-defense discretionary spending
Discretionary spending funds the Cabinet Departments and other government agencies. This spending was approximately $566 billion in 2011 or about 4% GDP. This spending has generally ranged between 3.75% GDP and 5.25% GDP since 1971. The spending sequester in the Budget Control Act of 2011 (BCA) essentially freezes non-defense discretionary spending in current dollar terms for the 2013-2022 period, limiting growth to approximately 1.5% per year (about the rate of inflation) versus approximately 6% over the past decade. CBO estimated spending under the sequester from 2012 to 2021 would be $5.4 trillion, versus $5.9 trillion estimated prior to passage of the BCA, an avoidance of about $500 billion in additional spending over a decade.[45]
Mandatory programs
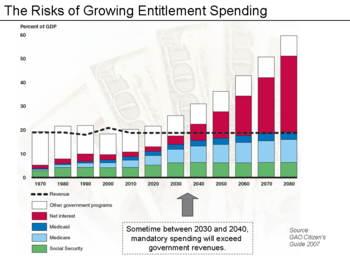
Several government agencies provide budget and debt data and analysis. These include the Government Accountability Office (GAO), the Congressional Budget Office (CBO), the Office of Management and Budget (OMB), and the U.S. Treasury Department. These agencies have reported that the federal government is facing a series of critical long-term financing challenges. This is because expenditures related to mandatory or "entitlement" programs such as Social Security, Medicare, and Medicaid are growing considerably faster than the economy overall, as the population grows older.
These agencies have indicated that under current law, sometime between 2030 and 2040, mandatory spending (primarily Social Security, Medicare, Medicaid, and interest on the national debt) will exceed tax revenue. In other words, all "discretionary" spending (e.g., defense, homeland security, law enforcement, education, etc.) will require borrowing and related deficit spending. These agencies have used such language as "unsustainable" and "trainwreck" to describe such a future.[47]
CBO wrote in November 2012: "The aging of the baby-boom generation portends a significant and sustained increase in coming years in the share of the population that will receive benefits from Social Security and Medicare and long-term care services financed through Medicaid. Moreover, per capita spending on health care is likely to continue to grow faster than per capita spending on other goods and services for many years. Without significant changes in the laws governing Social Security, Medicare, and Medicaid, those factors will boost federal outlays as a percentage of GDP well above the average of the past four decades—a conclusion that applies under any plausible assumptions about future trends in demographics, economic conditions, and health care costs."[17]
Medicare

CBO reported that the primary long-term deficit and debt risk is driven by healthcare costs. For example, CBO projects that Social Security spending will rise from 5.0% GDP in 2012 to 5.4% GDP in 2022 and 6.2% GDP in 2037 and stabilize around that level. However, CBO projects that combined Medicare and Medicaid spending will rise from 5.4% GDP in 2012 to 7.5% GDP by 2022 and 10.4% GDP by 2037 and continue rising thereafter.[48][49]
- The present value of unfunded obligations under Medicare was $35.6 trillion over a 75-year forecast period (2012-2086), including Medicare Parts A, B and D. The estimated annual shortfall averages 3.2% GDP. Over the infinite horizon, these numbers were $56.3 trillion and 3.8% GDP.[50]
The Patient Protection and Affordable Care Act, also known as "Obamacare," includes cuts of $716 billion in Medicare over a decade, mainly reductions to projected future increases. These cuts would be paid by suppliers of Medicare services such as hospitals, not patients.
Proposals to reduce Medicare costs align with proposals to reduce healthcare costs more generally. Many healthcare reform proposals were made during the Obama administration. Topics included obesity, defensive medicine or tort reform, rationing, a shortage of doctors and nurses, intervention vs. hospice, fraud, and use of imaging technology.
The Medicare Trustees provide an annual report of the program's finances. The forecasts from 2009 and 2015 differ materially, mainly due to changes in the projected rate of healthcare cost increases, which have moderated considerably. Rather than rising to nearly 12% GDP over the forecast period (through 2080) as forecast in 2009, the 2015 forecast has Medicare costs rising to 6% GDP, comparable to the Social Security program.[51] The long-term budget situation has considerably improved in the 2015 forecast versus the 2009 forecast per the Trustees Report.[52]
Social Security

Social Security is facing a long-run shortfall of approximately 1% GDP per year or $155 billion/year in 2012 dollars. Key reform proposals include:[53]
- Removing the cap on the payroll tax. Income over a threshold ($110,100 in 2012) is not subject to the payroll tax, nor are additional benefits paid to those with income above this level. Removing the cap would fund the entire 75-year shortfall.
- Raising the retirement age gradually. Raising the full-benefit retirement age to 70 would fund half the 75-year shortfall.
- Reducing cost of living adjustments (COLA), which are annual payout increases to keep pace with wages. Reducing each year's COLA by 0.5% versus the current formula would fund half the shortfall over 75 years.
- Means testing for wealthier retirees, beyond taxation of benefits which is already arguably a form of means testing.
- Raising the payroll tax rate. Raising the rate by one percentage point would cover half the shortfall for 75 years. Raising the rate by two percentage points gradually over 20 years would cover the entire shortfall.
One way to measure mandatory program risks is in terms of unfunded liabilities, the amount that would have to be set aside today such that principal and interest would cover program shortfalls (spending over tax revenue dedicated to the program). These are measured over a 75-year period and infinite horizon by the program's Trustees:
- The present value of unfunded obligations under Social Security was approximately $8.6 trillion over a 75-year forecast period (2012-2086). The estimated annual shortfall averages 2.5% of the payroll tax base or 0.9% of gross domestic product (a measure of the size of the economy). Measured over the infinite horizon, these figures are $20.5 trillion, 3.9% and 1.3%, respectively.[54]
Raising eligibility ages for Social Security and Medicare
CBO estimated in January 2012 that raising the full retirement age for Social Security from 67 to 70 would reduce outlays by about 13%. Raising the early retirement age from 62 to 64 has little impact, as those who wait longer to begin receiving benefits get a higher amount. Over the long-term, CBO estimates raising the Social Security retirement age increases the size of the workforce and the size of the economy marginally. Raising the Medicare eligibility age from 65 to 67 would reduce Medicare costs by 5%.[55]
Raising the retirement ages in one or both programs brings forth a host of questions around fairness, as some professions are harder to sustain for elderly (e.g., manual labor) and the poor do not have as long a life expectancy as the rich.[56]
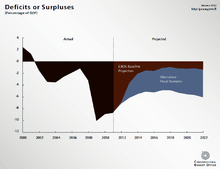
Interest expense
Budgeted net interest on the public debt was approximately $245 billion in FY2012 (7% of spending). During FY2012, the government also accrued a non-cash interest expense of $187 billion for intra-governmental debt, primarily the Social Security Trust Fund, for a total interest expense of $432 billion. This accrued interest is added to the Social Security Trust Fund and therefore the national debt each year and will be paid to Social Security recipients in the future. However, since it is a non-cash expense it is excluded from the budget deficit calculation.[57]
Net interest costs paid on the public debt declined from $203 billion in 2011 to $187 billion in 2012 because of lower interest rates. Should these rates return to historical averages, the interest cost would increase dramatically.[57]
During 2013, the U.S. Federal Reserve is expected to purchase about $45 billion of U.S. treasury securities per month in addition to the $40 billion in mortgage debt it’s purchasing, effectively absorbing about 90 percent of net new dollar-denominated fixed-income assets. This reduces the supply of bonds available for sale to investors, raising bond prices and lowering interest rates, which helps boost the U.S. economy. During 2012, global demand for U.S. debt was strong and interest rates were near record lows.[58]
Public debt owned by foreigners has increased to approximately 50% of the total or approximately $3.4 trillion.[59] As a result, nearly 50% of the interest payments are now leaving the country, which is different from past years when interest was paid to U.S. citizens holding the public debt. Interest expenses are projected to grow dramatically as the U.S. debt increases and interest rates rise from very low levels in 2009 to more typical historical levels. CBO estimates that nearly half of the debt increases over the 2009–2019 period will be due to interest.[60]
Should interest rates return to historical averages, the interest cost would increase dramatically. Historian Niall Ferguson described the risk that foreign investors would demand higher interest rates as the U.S. debt levels increase over time in a November 2009 interview.[61]
Economic proposals
In addition to policies regarding revenue and spending, policies that encourage economic growth are the third major way to reduce deficits. Economic growth offers the "win-win" scenario of higher employment, which increases tax revenue while reducing safety net expenditures for such things as unemployment compensation and food stamps. Other deficit proposals related to spending or revenue tend to take money or benefits from one constituency and give it to others, a "win-lose" scenario. Democrats typically advocate Keynesian economics, which involves additional government spending during an economic downturn. Republicans typically advocate Supply-side economics, which involves tax cuts and deregulation to encourage the private sector to increase its spending and investment.
Economic growth and job creation are affected by globalization, technology change or automation, international competition, education levels, demographics, trade policy, and other factors. Cyclical unemployment is due to variation in the economic cycle and is responsive to stimulus measures, while structural unemployment is unrelated to the economic cycle and is unresponsive to stimulus measures. For example, a general reduction in employment across multiple industries would likely be cyclical, while a skills or geographic mismatch for available jobs would be structural issue.
Conservative organizations such as the U.S. Chamber of Commerce have advocated growth and employment strategies based on a reduction in government regulations; empowering state education systems; teacher pay for performance strategies; training programs better focused on available jobs; creation of a private and public infrastructure bank to finance investments; tax rate reductions for corporations; free trade agreements; and reducing labor union power.[62]
Inflation or negative real interest rates
Contrary to popular belief, reducing the debt burden (i.e., lowering the ratio of debt relative to GDP) is almost always accomplished without running budget surpluses. The U.S. has only run surpluses in four of the past 40 years (1998-2001) but had several periods where the debt to GDP ratio was lowered. This was accomplished by growing GDP (in real terms and via inflation) relatively faster than the increase in debt.
Since 2010, the U.S. Treasury has been obtaining negative real interest rates on government debt.[63] Such low rates, outpaced by the inflation rate, occur when the market believes that there are no alternatives with sufficiently low risk, or when popular institutional investments such as insurance companies, pensions, or bond, money market, and balanced mutual funds are required or choose to invest sufficiently large sums in Treasury securities to hedge against risk.[64][65] Lawrence Summers, Matthew Yglesias and other economists state that at such low rates, government debt borrowing saves taxpayer money, and improves creditworthiness.[66][67]
In the late 1940s through the early 1970s, the US and UK both reduced their debt burden by about 30% to 40% of GDP per decade by taking advantage of negative real interest rates, but there is no guarantee that government debt rates will continue to stay so low.[64][68] Between 1946 and 1974, the US debt-to-GDP ration fell from 121% to 32% even though there were surpluses in only eight of those years which were much smaller than the deficits.[69]
Balancing economic growth with deficit reduction
Actions can be taken now to encourage economic growth while implementing measures that reduce future deficits. Ben Bernanke wrote in September 2011: "...the two goals--achieving fiscal sustainability, which is the result of responsible policies set in place for the longer term, and avoiding creation of fiscal headwinds for the recovery--are not incompatible. Acting now to put in place a credible plan for reducing future deficits over the long term, while being attentive to the implications of fiscal choices for the recovery in the near term, can help serve both objectives."[70]
Stimulus vs. austerity

There is significant debate regarding whether lowering the deficit (i.e., fiscal austerity) is the proper economic policy course when unemployment is elevated and economic growth is slow. Economist Laura D'Andrea Tyson wrote in July 2011: "Like many economists, I believe that the immediate crisis facing the United States economy is the jobs deficit, not the budget deficit. The magnitude of the jobs crisis is clearly illustrated by the jobs gap – currently around 12.3 million jobs. That is how many jobs the economy must add to return to its peak employment level before the 2008-9 recession and to absorb the 125,000 people who enter the labor force each month. At the current pace of recovery, the gap will be not closed until 2020 or later." She explained further that job growth between 2000 and 2007 was only half what it had been in the preceding three decades, pointing to several studies by other economists indicating globalization and technology change had highly negative effects on certain sectors of the U.S. workforce and overall wage levels.[11]
Economic policies that stimulate demand (e.g., higher government spending or tax cuts) generally increase employment but raise the deficit as well. Strategies that involve short-term stimulus with longer-term austerity are not mutually exclusive. Steps can be taken in the present that will reduce future spending, such as "bending the curve" on pensions by reducing cost of living adjustments or raising the retirement age for younger members of the population, while at the same time creating short-term spending or tax cut programs to stimulate the economy to create jobs.
IMF managing director Christine Lagarde wrote in August 2011: "For the advanced economies, there is an unmistakable need to restore fiscal sustainability through credible consolidation plans. At the same time we know that slamming on the brakes too quickly will hurt the recovery and worsen job prospects. So fiscal adjustment must resolve the conundrum of being neither too fast nor too slow. Shaping a Goldilocks fiscal consolidation is all about timing. What is needed is a dual focus on medium-term consolidation and short-term support for growth and jobs. That may sound contradictory, but the two are mutually reinforcing. Decisions on future consolidation, tackling the issues that will bring sustained fiscal improvement, create space in the near term for policies that support growth and jobs."[71]
Paul Krugman wrote in August 2011: "What would a real response to our problems involve? First of all, it would involve more, not less, government spending for the time being — with mass unemployment and incredibly low borrowing costs, we should be rebuilding our schools, our roads, our water systems and more. It would involve aggressive moves to reduce household debt via mortgage forgiveness and refinancing. And it would involve an all-out effort by the Federal Reserve to get the economy moving, with the deliberate goal of generating higher inflation to help alleviate debt problems."[72]
Former Treasury Secretary Lawrence Summers mentioned the importance of economic growth and job creation as critical to addressing the deficit issue during July 2011.[10] The President's 2012 budget forecasts annual real GDP growth averaging 3.2% from 2011-2021 (3.7% from 2011–2016 and 2.6% from 2017-2021.)[73] The change in real GDP was -0.3% in 2008, -3.5% in 2009 and +3.0% in 2010. During 2011, real GDP increased at an annual rate of +0.4% during the first quarter and +1.0% during the second quarter.[74]
Federal Reserve Chair Ben Bernanke testified in February 2013 that the Federal government should replace the sequester with smaller spending cuts today and larger cuts in the future, due to concerns the sequester would slow the economy.[75] He reminded lawmakers of the CBO's guidance that recent austerity measures were projected to reduce economic growth by up to 1.5 percentage points in 2013 (relative to what it would have been otherwise), of which 0.6 percentage points related to the sequester. Bernanke stated that the long-run fiscal issues mainly related to an aging population and healthcare costs. He wrote: "To address both the near- and longer-term [fiscal] issues, the Congress and the Administration should consider replacing the sharp, front-loaded spending cuts required by the sequestration with policies that reduce the federal deficit more gradually in the near term but more substantially in the longer run. Such an approach could lessen the near-term fiscal headwinds facing the recovery while more effectively addressing the longer-term imbalances in the federal budget."[76]
Job creation sectors
Economist Michael Spence said in August 2011 that over the 1990-2008 period, job creation was almost entirely in the "non-tradable" sector, which produces goods and services that must be consumed domestically, like healthcare, and few jobs created in the "tradable" sector which produces goods that can be sold internationally, like manufacturing. He falsely claimed that job creation in both sectors is necessary and that various factors, such as the housing bubble, hid the lack of job creation in the tradable sector. He stated: "We’re going to have to try to fix the ineffective parts of our educational system...We’re under-investing in things like infrastructure...we’ve just been living on consumption and we need to live a little bit more on investment, including public-sector investment." He also advocated tax policy changes to encourage hiring of U.S. workers.[77]
Income inequality
Economist Robert Reich wrote in September 2011 that political policies have resulted in relatively stagnant U.S. wages for the middle class since 1979 and record income inequality. Despite more women entering the workforce to provide a second family incomes, U.S. consumption became increasingly debt-financed and unsustainable. He advocated higher taxation on the wealthy, stronger safety nets, strengthening labor unions (which represented less than 8% of the private labor force), Medicare for all, raising the average wages in trading partner countries, and a focus on education.[78]
Economist Joseph Stiglitz wrote in 2012 that moving money from the bottom to the top of the income spectrum through income inequality lowers consumption, and therefore economic growth and job creation. Higher-income individuals consume a smaller proportion of their income than do lower-income individuals; those at the top save 15-25% of their income, while those at the bottom spend all of their income.[79] This can reduce the tax revenue the government collects, raising the deficit relative to an economy with more income equality.[80]
Reducing fractional reserve lending
The International Monetary Fund published a working paper entitled The Chicago Plan Revisited suggesting that the debt could be eliminated by raising bank reserve requirements, converting from fractional reserve banking to full reserve banking.[81][82] Economists at the Paris School of Economics have commented on the plan, stating that it is already the status quo for coinage currency,[83] and a Norges Bank economist has examined the proposal in the context of considering the finance industry as part of the real economy.[84] A Centre for Economic Policy Research paper agrees with the conclusion that, "no real liability is created by new fiat money creation, and therefore public debt does not rise as a result."[85]
Specific deficit reduction proposals
National Research Council
During January 2010, the National Research Council and the National Academy of Public Administration reported a series of strategies to address the problem. They included four scenarios designed to prevent the public debt to GDP ratio from exceeding 60%:
- Low spending and low taxes. This path would allow payroll and income tax rates to remain roughly unchanged, but it would require sharp reductions in the projected growth of health and retirement programs; defense and domestic spending cuts of 20 percent; and no funds for any new programs without additional spending cuts.
- Intermediate path 1. This path would raise income and payroll tax rates modestly. It would allow for some growth in health and retirement spending; defense and domestic program cuts of 8 percent; and selected new public investments, such as for the environment and to promote economic growth.
- Intermediate path 2. This path would raise income and payroll taxes somewhat higher than with the previous path. Spending growth for health and retirement programs would be slowed, but less than under the other intermediate path; and spending for all other federal responsibilities would be reduced. This path gives higher priority to entitlement programs for the elderly than to other types of government spending.
- High spending and taxes. This path would require substantially higher taxes. It would maintain the projected growth in Social Security benefits for all future retirees and require smaller reductions over time in the growth of spending for health programs. It would allow spending on all other federal programs to be higher than the level implied by current policies.[86][87]
Allowing laws already on the books to take effect

As of November 2014, there was no major legislation scheduled to expire or take effect projected by CBO to have a material net impact on the budget deficit. However, an unusual situation developed in early 2013, referred to as the fiscal cliff, in which the Bush tax cuts of 2001 and 2003 were scheduled to expire (causing income tax revenues to rise significantly) and spending cuts due to the Budget Control Act of 2011 (also known as "the sequester") were scheduled to begin taking effect. CBO estimated allowing those laws to take effect would have dramatically reduced the deficit over a decade, but also would have slowed the economy and increased unemployment at a time when the economy was recovering from the subprime mortgage crisis.
Specifically, allowing laws on the books in 2011 to take effect would have reduced future debts by up to $7.1 trillion over a decade:
- $3.3T from letting temporary income and estate tax cuts enacted in 2001, 2003, 2009, and 2010 (some of which were known as the Bush tax cuts to expire on schedule at the end of 2012;
- $1.2T from implementing the sequester (spending freezes / reductions) in the Budget Control Act of 2011);
- $0.8T other temporary tax cut expirations (the “extenders” that Congress has regularly extended on a “temporary” basis) expire on schedule;
- $0.3T from letting cuts in Medicare physician reimbursements scheduled under current law (required under the Medicare Sustainable Growth Rate formula enacted in 1997, but which have been postponed since 2003) take effect (i.e., no longer applying the Doc fix);
- $0.7T from letting the temporary increase in the exemption amount under the Alternative Minimum Tax expire, thereby returning the exemption to the level in effect in 2001;
- $0.9T in lower interest payments on the debt as a result of the deficit reduction achieved from not extending these current policies.[88]
CBO reported in November 2012: "Under the current-law assumptions embodied in CBO’s baseline projections, the budget deficit would shrink markedly—from nearly $1.1 trillion in fiscal year 2012 to about $200 billion in 2022—and debt would decline to 58 percent of GDP in 2022. However, those projections depend heavily on the significant increases in taxes and decreases in spending that are scheduled to take effect at the beginning of January [2013]."[17]
The fiscal cliff was partially resolved by the American Taxpayer Relief Act of 2012 or ATRA, which extended the Bush tax cuts for the bottom 99% of income earners, resulting in considerably less deficit reduction than if they had been allowed to expire at all income levels according to CBO. Further, the sequester was delayed for two months but contributed to moderately lower defense and non-defense discretionary spending in 2013 and beyond versus the 2011 law baseline.
Raising income tax rates for the bottom 99% of income earners to their pre-2001 levels would require entirely new legislation. The sequester was implemented, so reversing its impact would also require new legislation.
CBO budget options reports
CBO publishes a report annually ("Options for Reducing the Deficit") with an extensive list of policy options and their impact on the deficit. CBO reported in November 2013 that addressing the long-term debt challenge would require reducing future budget deficits. Lawmakers would need to increase revenues further relative to the size of the economy, decrease spending on Social Security or major health care programs relative to current law, cut other federal spending to even lower levels by historical standards, or adopt a combination of these approaches.[8]
Republican proposals
Rep. Paul Ryan (R) has proposed the Roadmap for America's Future, which is a series of budgetary reforms. His January 2010 version of the plan includes partial privatization of Social Security, the transition of Medicare to a voucher system, discretionary spending cuts and freezes, and tax reform.[89] A series of graphs and charts summarizing the impact of the plan are included.[90] Economists have both praised and criticized particular features of the plan.[91][92] The CBO also did a partial evaluation of the bill.[93] The Center for Budget and Policy Priorities (CBPP) was very critical of the Roadmap.[94] Rep. Ryan provided a response to the CBPP's analysis.[95]
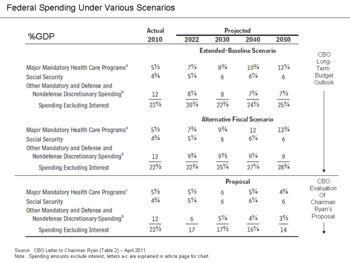
The House of Representatives Committee on the Budget, chaired by Paul Ryan, released a budget resolution in April 2011, titled The Path to Prosperity: Restoring America's Promise. The Path focuses on tax reform (lowering income tax rates and reducing tax expenditures or loopholes); spending cuts and controls; and redesign of the Medicare and Medicaid programs. It does not propose significant changes to Social Security.[96] The CBO did an analysis of the resolution (a less rigorous evaluation than full scoring of legislation), estimating that the Path would balance the budget by 2030 and reduce the level of debt held by the public to 10% GDP by 2050, vs. 62% in 2010. The Path assumes revenue collection of 19% GDP after 2022, up from the current 15% GDP and closer to the historical average of 18.3% GDP. A grouping of spending categories called "Other Mandatory and Defense and Non-Defense Discretionary spending" would be reduced from 12% GDP in 2010 to 3.5% by 2050.[97] Economist Paul Krugman called it "ridiculous and heartless" due to a combination of income tax rate reductions (which he argued mainly benefit the wealthy) and large spending cuts that would affect the poor and middle classes.[98][99]
The Republican Party website includes an alternative budget proposal provided to the President in January 2010. It includes lower taxes, lower annual increases in entitlement spending growth, and marginally higher defense spending than the President's 2011 budget proposal.[100] During September 2010, Republicans published "A Pledge to America" which advocated a repeal of recent healthcare legislation, reduced spending and the size of government, and tax reductions.[101] The NYT editorial board was very critical of the Pledge, stating: "...[The Pledge] offers a laundry list of spending-cut proposals, none of which are up to the scale of the problem, and many that cannot be taken seriously."[102]
Fiscal reform commission

President Obama established a budget reform commission, the National Commission on Fiscal Responsibility and Reform, during February, 2010. The Commission "shall propose recommendations designed to balance the budget, excluding interest payments on the debt, by 2015. This result is projected to stabilize the debt-to-GDP ratio at an acceptable level once the economy recovers." Unfortunately the Commission was unable to garner the required supermajority of its members in support of its proposals, and disbanded without issuing an official report to Congress.[103] The final, failed draft report, which received 11 of the required 14 votes for approval, was released to the public in December 2010.[104]
The Commission released a draft of its proposals on November 10, 2010. It included various tax and spend adjustments to bring long-run government tax revenue and spending into line at approximately 21% of GDP. For fiscal year 2009, tax revenues were approximately 15% of GDP and spending was 24% of GDP. The Co-chairs summary of the plan states that it:
- Achieves nearly $4 trillion in deficit reduction through 2020 via 50+ specific ways to cut outdated programs and strengthen competitiveness by making Washington cut and invest, not borrow and spend.
- Reduces the deficit to 2.2% of GDP by 2015, exceeding President’s goal of primary balance (about 3% of GDP).
- Reduces tax rates, abolishes the alternative minimum tax, and cuts backdoor spending (e.g., mortgage interest deductions) in the tax code.
- Stabilizes debt by 2014 and reduces debt to 60% of GDP by 2024 and 40% by 2037.
- Ensures lasting Social Security solvency, prevents projected 22% cuts in 2037, reduces elderly poverty, and distributes burden fairly.[105]
The Center on Budget and Policy Priorities evaluated the draft plan, praising that it "puts everything on the table" but criticizing that it "lacks an appropriate balance between program cuts and revenue increases."[106]
President Obama's proposals
Budgets and April 2011 proposal
President Obama outlined his strategy for reducing future deficits in April 2011 and explained why this debate is important: "...as the Baby Boomers start to retire in greater numbers and health care costs continue to rise, the situation will get even worse. By 2025, the amount of taxes we currently pay will only be enough to finance our health care programs -- Medicare and Medicaid -- Social Security, and the interest we owe on our debt. That’s it. Every other national priority -– education, transportation, even our national security-–will have to be paid for with borrowed money." He warned that interest payments may reach $1 trillion annually by the end of the decade.
He outlined core principles of his proposal, which includes investments in key areas while reducing future expenditures. "I will not sacrifice the core investments that we need to grow and create jobs. We will invest in medical research. We will invest in clean energy technology. We will invest in new roads and airports and broadband access. We will invest in education. We will invest in job training. We will do what we need to do to compete, and we will win the future." He outlined his proposals for reducing future deficits, by:
- Reducing non-defense discretionary spending, by freezing or limiting increases in future spending;
- Finding savings in the defense budget, building on $400 billion in savings already identified by Defense Secretary Gates;
- Reducing healthcare spending, by reducing subsidies and erroneous payments, negotiating for lower prescription drug prices and use of generics, improving efficiencies in the Medicaid program, altering doctor incentives, and empowering a panel of experts to recommend cost-effective treatments and solutions;
- Strengthening the Social Security program, without reducing commitments to current or future retirees (by implication revenue increases); and
- Raising revenues, primarily by raising taxes on the wealthy and reducing certain types of tax expenditures.[107]
President Obama's actual 2012 budget proposal was defeated in the Senate by a margin of 0-97 votes.[108]
September 2011 proposal
President Obama announced a 10-year (2012–2021) plan in September 2011 called: "Living Within Our Means and Investing in the Future: The President’s Plan for Economic Growth and Deficit Reduction." The plan included tax increases on the wealthy, along with cuts in future spending on defense and Medicare. Social Security was excluded from the plan. The plan included $3,670 billion in deficit reduction over 10 years, offset by $447 billion in deficit increases (spending and tax cuts) for the proposed American Jobs Act, for a net deficit reduction of $3,222 billion. If the recently passed Budget Control Act of 2011 is included, this adds another $1,180 billion in deficit reduction for a total of $4,403 billion. Plan estimates indicate that if all these measures were implemented, the deficit in 2021 would be 2.3% GDP or $565 billion. Key categories of savings over the 10 years included in the $3,670 billion are:
- Mandatory program savings $257B;
- Health savings $320B;
- Reduction in military spending related to the wars $1,084B;
- Tax increases and reform of $1,573B; and
- Interest cost avoidance $436B.[109]
The Center on Budget and Policy Priorities supported the proposal, stating: "President Obama proposed a balanced and well-designed package today that would boost economic growth and jobs in the short run while stabilizing federal debt as a share of the economy after 2013. By keeping federal debt held by the public from growing as a share of the economy, the President's proposal would meet the definition of a 'sustainable budget' that economists often use." [110]
Congressional Progressive Caucus "The People's Budget"
The Congressional Progressive Caucus (CPC) consists of 75 members of the House of Representatives and one senator. It proposed "The People's Budget" in April 2011, which includes the following recommendations, which it claims would balance the budget by 2021 while maintaining debt as a % GDP under 65%:
- Reversing most of the Bush tax cuts;
- Reinstating historical marginal income tax rates of approximately 45% on income earners over $1 million and 49% for earners over $1 billion.
- Taxing capital gains and qualified dividends as ordinary income;
- Raising the income tax cap ($106,800) on the Social Security payroll tax;
- Restoring the estate tax;
- Reducing tax subsidies for corporations, particularly in the oil and gas industries;
- Ending overseas contingency defense spending for the wars in Iraq and Afghanistan;
- Reducing defense spending overall and reducing the U.S. global defense footprint;
- Investing in a jobs program; and
- Implementing a public option to reduce healthcare costs.[111]
The Economic Policy Institute, a liberal think tank, evaluated the proposal.[112] The Economist also discussed it.[113] Economist Paul Krugman wrote in April 2011: "It’s worth pointing out that if you want to balance the budget in 10 years, you pretty much must do it largely by cutting defense and raising taxes; you can’t make huge cuts in the rest of the budget without inflicting extreme pain on millions of Americans."[114]
Private "think-tank" proposals
The Peter G. Peterson Foundation solicited proposals from six organizations, which included the American Enterprise Institute, the Bipartisan Policy Center, the Center for American Progress, the Economic Policy Institute, The Heritage Foundation, and the Roosevelt Institute Campus Network. These proposals were reviewed by a former CBO director and the Tax Policy Institute to provide a common scoring mechanism. The recommendations of each group were reported in May 2011.[115]
The Bipartisan Policy Center sponsored a Debt Reduction Task Force, co-chaired by Pete V. Domenici and Alice M. Rivlin. This panel created a report called "Restoring America's Future," which was published in November 2010. The plan claimed to stabilize the debt to GDP ratio at 60%, with up to $6 trillion in debt reduction over the 2011-2020 period. Specific plan elements included:
- Freeze defense spending for 5 years, after which defense spending would be held to the rate of GDP growth;
- Freeze non-defense discretionary spending for 4 years, after which it would be capped at the rate of GDP growth;
- Reduce the current six income tax rates to just two (15% and 27%). It would reduce the corporate tax rate to 27% from 35% today. The panel would also eliminate most tax expenditures (roughly $1 trillion per year), with the exception of the mortgage interest and charitable deductions.
- Implement a national sales tax or value-added tax (VAT), starting at 3% in 2012 and rising to 6.5% by 2013.
- Reform Social Security, by raising the cap on the payroll tax, reducing the annual cost of living adjustment, and reducing benefits for those who retire early.[116][117]
Commentary
CBO perspective
The CBO reported in September 2011 that: "Given the aging of the population and rising costs for health care, attaining a sustainable federal budget will require the United States to deviate from the policies of the past 40 years in at least one of the following ways:
- Raise federal revenues significantly above their average share of GDP;
- Make major changes to the sorts of benefits provided for Americans when they become older; or
- Substantially reduce the role of the rest of the federal government relative to the size of the economy."[118]
During testimony before the Congressional Joint Deficit Reduction Committee in September 2011, CBO Director Douglas Elmendorf counseled members of Congress to make decisions about the role of the federal government, then make policy choices to obtain the revenue necessary to fund those roles, to put the U.S. on a sustainable fiscal path.[119]
General strategies
In January 2008, then GAO Director David Walker presented a strategy for addressing what he called the federal budget "burning platform" and "unsustainable fiscal policy." This included improved financial reporting to better capture the obligations of the government; public education; improved budgetary and legislative processes, such as "pay as you go" rules; the restructure of entitlement programs and tax policy; and creation of a bi-partisan fiscal reform commission. He pointed to four types of "deficits" that make up the problem: budget, trade, savings and leadership.[23]
Then OMB Director Peter Orszag stated in a November 2009 interview: "It's very popular to complain about the deficit, but then many of the specific steps that you could take to address it are unpopular. And that is the fundamental challenge that we are facing, and that we need help both from the American public and Congress in addressing." He characterized the budget problem in two parts: a short- to medium-term problem related to the financial crisis of 2007–2010, which has reduced tax revenues significantly and involved large stimulus spending; and a long-term problem primarily driven by increasing healthcare costs per person. He argued that the U.S. cannot return to a sustainable long-term fiscal path by either tax increases or cuts to non-healthcare cost categories alone; the U.S. must confront the rising healthcare costs driving expenditures in the Medicare and Medicaid programs.[120]
Fareed Zakaria said in February 2010: "But, in one sense, Washington is delivering to the American people exactly what they seem to want. In poll after poll, we find that the public is generally opposed to any new taxes, but we also discover that the public will immediately punish anyone who proposes spending cuts in any middle class program which are the ones where the money is in the federal budget. Now, there is only one way to square this circle short of magic, and that is to borrow money, and that is what we have done for decades now at the local, state and federal level...So, the next time you accuse Washington of being irresponsible, save some of that blame for yourself and your friends."[121]
Andrew Sullivan said in March 2010: "...the biggest problem in this country is...they're big babies. I mean, people keep saying they don't want any tax increases, but they don't want to have their Medicare cut, they don't want to have their Medicaid [cut] or they don't want to have their Social Security touched an inch. Well, it's about time someone tells them, you can't have it, baby...You have to make a choice. And I fear that—and I always thought, you see, that that was the Conservative position. The Conservative is the Grinch who says no. And, in some ways, I think this in the long run, looking back in history, was Reagan's greatest bad legacy, which is he tried to tell people you can have it all. We can't have it all."[122]
Harvard historian Niall Ferguson stated in a November 2009 interview: "The United States is on an unsustainable fiscal path. And we know that path ends in one of two ways; you either default on that debt, or you depreciate it away. You inflate it away with your currency effectively." He said the most likely case is that the U.S. would default on its entitlement obligations for Social Security and Medicare first, by reducing the obligations through entitlement reform. He also warned about the risk that foreign investors would demand a higher interest rate to purchase U.S. debt, damaging U.S. growth prospects.[123]
In May 2011, the Wells Fargo Economics Group wrote that: "The failure to control spending will result in some combination of higher inflation, higher interest rates, a weaker dollar, weaker economic growth and, hence, a lower standard of living in the United States..."[124] Thomas Friedman wrote in September 2011: "But as long as every solution that is hard is off the table, then our slow national decline will remain on the table."[125]
Healthcare cost control
Economist Paul Krugman has recommended a series of policy and economic actions to address the budget deficit. He wrote in February 2011: "What would a serious approach to our fiscal problems involve? I can summarize it in seven words: health care, health care, health care, revenue...Long-run projections suggest that spending on the major entitlement programs will rise sharply over the decades ahead, but the great bulk of that rise will come from the health insurance programs, not Social Security. So anyone who is really serious about the budget should be focusing mainly on health care...[by] getting behind specific actions to rein in costs."[126]
Taxation and spending reforms
Economist Nouriel Roubini wrote in May 2010: "There are only two solutions to the sovereign debt crisis — raise taxes or cut spending — but the political gridlock may prevent either from happening...In the US, the average tax burden as a share of GDP is much lower than in other advanced economies. The right adjustment for the US would be to phase in revenue increases gradually over time so that you don't kill the recovery while controlling the growth of government spending."[127]
David Leonhardt wrote in The New York Times in March 2010: "For now, political leaders in both parties are still in denial about what the solution will entail. To be fair, so is much of the public. What needs to happen? Spending will need to be cut, and taxes will need to rise. They won’t need to rise just on households making more than $250,000, as Mr. Obama has suggested. They will probably need to rise on your household, however much you make...A solution that relied only on spending cuts would dismantle some bedrock parts of modern American society...A solution that relied only on taxes would muzzle economic growth."[128]
Fed Chair Ben Bernanke stated in January 2007: "The longer we wait, the more severe, the more draconian, the more difficult the objectives are going to be. I think the right time to start was about 10 years ago."[129] Bernanke wrote in April 2010: "Thus, the reality is that the Congress, the Administration, and the American people will have to choose among making modifications to entitlement programs such as Medicare and Social Security, restraining federal spending on everything else, accepting higher taxes, or some combination thereof."[130]
Journalist Steven Pearlstein advocated in May 2010 a comprehensive series of budgetary reforms. These included: Spending caps on Medicare and Medicaid; gradually raising the eligibility age for Social Security and Medicare; limiting discretionary spending increases to the rate of inflation; and imposing a value-added tax.[131] Journalist Robert J. Samuelson also recommended a ten-point deficit reduction plan.[132]
Public opinion polls
According to a December 2012 Pew Research Center poll, only a few of the frequently discussed deficit reduction ideas have majority support:
- 69% support raising the tax rate on income over $250,000.
- 54% support limiting deductions taxpayers can claim.
- 52% support raising the tax on investment income.
- 51% support reducing Medicare payments to high-income seniors.
- 51% support reducing Social Security payments to high-income seniors.
Fewer than 50% support raising the retirement age for Social Security or Medicare, reducing military defense spending, limiting the mortgage interest deduction, or reducing federal funding for low income persons, education and infrastructure.[133]
According to a CBS News/New York Times poll in July 2009, 56% of people were opposed to paying more taxes to reduce the deficit and 53% were also opposed to cutting spending. According to a Pew Research poll in June 2009, there was no single category of spending that a majority of Americans favored cutting. Only cuts in foreign aid (less than 1% of the budget), polled higher than 33%. Economist Bruce Bartlett wrote in December 2009: "Nevertheless, I can't really blame members of Congress for lacking the courage or responsibility to get the budget under some semblance of control. All the evidence suggests that they are just doing what voters want them to do, which is nothing."[134]
A Bloomberg/Selzer national poll conducted in December 2009 indicated that more than two-thirds of Americans favored tax increases on the rich (individuals making over $500,000) to help solve the deficit problem. Further, an across-the-board 5% cut in all federal discretionary spending would be supported by 57%; this category is about 30% of federal spending. Only 26% favored tax increases on the middle class and only 23% favored reducing the growth rate in entitlements, such as Social Security.[135][136]
A Rasmussen Reports survey in February 2010 showed that only 35% of voters correctly believe that the majority of federal spending goes to just defense, Social Security and Medicare. Forty-four percent (44%) say it’s not true, and 20% are not sure. [137] A January 2010 Rasmussen report showed that overall, 57% would like to see a cut in government spending, 23% favor a freeze, and 12% say the government should increase spending. Republicans and unaffiliated voters overwhelmingly favor spending cuts. Democrats are evenly divided between spending cuts and a spending freeze.[138]
According to a Pew Research poll in March 2010, 31% of Republicans would be willing to decrease military spending to bring down the deficit. A majority of Democrats (55%) and 46% of Independents say they would accept cuts in military spending to reduce the deficit.[139]
A National Journal poll in February 2012 reported: "When asked to identify the biggest reason the federal government faces large deficits for the coming years, just 3 percent of those surveyed said it was because of 'too much government spending on programs for the elderly'; only 14 percent said the principal reason was 'too much government spending on programs for poor people.' Those explanations were dwarfed by the 24 percent who attributed the deficits primarily to excessive defense spending, and the 46 percent plurality who said their principal cause was that 'wealthy Americans don’t pay enough in taxes.' While minorities were more likely than whites to pin the blame on the wealthy avoiding taxes, even 43 percent of whites agreed."[140]
A September 2012 survey by The Economist found those earning over $100,000 annually were twice as likely to name the budget deficit as the most important issue in deciding how they would vote than middle- or lower-income respondents. Among the general public, about 40% say unemployment is the most important issue while 25% say that the budget deficit is.[141]
External links
References
- 1 2 3 CBO Long-Term Budget Outlook-July 15, 2014
- ↑ Mark Zandi; Chris Lafakis; Dan White; Adam Ozimek (June 2016). "The Macroeconomic Consequences of Mr. Trump's Economic Policies" (PDF). Moody's Analytics. Retrieved November 7, 2016.
- ↑ Fiscal Fact Check: How Do Donald Trump's Campaign Proposals So Far Add Up?, Committee for a Responsible Federal Budget (February 13, 2016).
- ↑ U.S. Treasury Direct-Historical Debt Outstanding-Retrieved October 2014
- ↑ CBO-An Update to the Budget and Economic Outlook: Fiscal Years 2012 to 2022-August 22, 2012
- ↑ CBO Budget and Economic Outlook-February 2013
- ↑ Treasury Direct-Monthly Statement of the Public Debt-January 2013
- 1 2 3 CBO-Options for Reducing the Deficit-November 2013
- ↑ CBO-Monthly Budget Review-September 2014
- 1 2 CNN's Fareed Zakaria GPS-Larry Summers Interview Transcript-July 17, 2011
- 1 2 NYT-Economix-Laura D'Andrea Tyson-Jobs Deficit, Investment Deficit, Budget Deficit-July 2011
- ↑ Huntley, Jonathan (July 27, 2010). "Federal debt and the risk of a fiscal crisis". Congressional Budget Office: Macroeconomic Analysis Division. Retrieved February 2, 2011.
- 1 2 Schwabish, Jonathan (August 22, 2012). "Fiscal Tightening in 2013 and Its Economic Consequences". Congressional Budget Office. Retrieved August 28, 2012.
- 1 2 "United States of America Long-Term Rating Lowered To 'AA+' On Political Risks And Rising Debt Burden; Outlook Negative" (PDF). standardandpoors.com. Retrieved August 5, 2011.
- ↑ FRED Database-10 Year Treasury Constant Maturity Rate-Retrieved November 20, 2012
- ↑ Washington Post-Neil Irwin-Joe Scarborough, Paul Krugman and the economist-pundit divide on debt and deficits-January 2013
- 1 2 3 CBO-Choices for Deficit Reduction-November 2012
- 1 2 Bittle, Scott (2011). Where Does the Money Go?. Harper. ISBN 978-0-06-124187-1.
- ↑ Alice M. Rivlin Congressional Testimony-January 2009
- ↑ Charlie Rose Show-Senators Bayh, Gregg and Roger Altman-February 1, 2010
- ↑ Center on Budget and Policy Priorities-The Right Target: Stabilize the Federal Debt January 2010
- ↑ U.S. Chamber of Commerce-Another Pivot Back to Jobs-Retrieved September 2011
- 1 2 GAO-U.S. Financial Condition and Fiscal Future Briefing-David Walker-January 2008
- ↑ CBO Historical Tables 1971-2010
- 1 2 Washington Post-Greg Ip-Five Myths About Tax Reform-December 14, 2012
- 1 2 3 CBO Historical Tables-February 2013
- 1 2 CBO Historical Tables
- ↑ NYT Editorial Board-The Need to Agree to Agree-July 2012
- ↑ Congressional Budget Office-The Budget and Economic Outlook-August 2010-Table 1.7 on Page 24
- ↑ CBO-Budget and Economic Outlook-2013 to 2023
- ↑ "States with "High Rate" Income Taxes are Still Outperforming No-Tax States" (PDF). Institute on Taxation and Economic Policy. February 2013. p. 3. Retrieved 24 March 2013.
- ↑ NYT-Warren Buffett-A Minimum Tax for the Wealthy
- ↑ Warren Buffett-NYT-Stop Coddling the Super Rich-August 2011
- ↑ NPR-What Would the Buffett Rule Mean for the Economy?-April 2012
- ↑ Social Security Administration-Maximum Taxable Earnings-Retrieved October 2014
- ↑ CBO-Social Security Policy Options-July 2010
- 1 2 Bloomberg-Cap of $25,000 on Deductions Would Cover 32% of Tax Cuts
- ↑ CBO-The Budget and Economic Outlook: Fiscal Years 2012-2021-See Historical Budget Data-January 2012
- ↑ FRED Database-Corporate Profits and Federal Income tax revenues-Retrieved May 25, 2013
- ↑ CBO-Corporate Income Tax Rates International Comparison-November 2005
- ↑ Center for American Progress-Ten Charts that Prove the U.S. is a Low Tax Country-June 2011
- ↑ Washington Post-Mark Zandi-How to Cut the Deficit, and What Happens if We Don't-July 2011
- ↑ CBPP-Mortgage Interest Deduction Is Ripe for Reform-April 2013
- ↑ Dylan Mathews (February 26, 2013). "Brookings wants to revamp the federal budget. Here are its 11 best ideas.". Washington Post. Retrieved February 26, 2013.
- 1 2 3 CBO (October 26, 2011). "CBO Testimony Discretionary Spending". CBO. Retrieved August 4, 2012.
- ↑ CBO-Monthly Budget Review-Sept 09
- ↑ Congress of the United States, Government Accountability Office (February 13, 2009). "The federal government's financial health: a citizen's guide to the 2008 financial report of the United States government", pp. 7–8. United States Government Accountability Office (GAO) [website]. Retrieved February 1, 2011.
- ↑ CBO-Long Term Budget Outlook-Table 1.2 Document Page 12-June 5, 2012
- ↑ Heritage Foundation-Book of Charts-Entitlement Spending-Retrieved November 7, 2012
- ↑ Medicare Trustees Report-2012
- ↑ 2015 Annual Report of the Boards of Trustees of the Federal Hospital Insurance and Federal Supplementary Medicare Insurance Trust Funds-Retrieved July 28, 2015
- ↑ NYT-Paul Krugman-The Disappearing Entitlements Crisis-July 26, 2015
- ↑ CBO-Social Security Policy Options-July 2010
- ↑ Social Security Trustees Report 2012-Table IV.B6
- ↑ CBO - Raising the Ages of Eligibility for Social Security and Medicare-January 2012
- ↑ NYT-Paul Krugman-Life, Death and Deficits-November 2012
- 1 2 "GAO Audit Report on Treasury Debt - FY2012" (PDF). November 2012. p. 13. Retrieved November 2012. Check date values in:
|access-date=(help) - ↑ Bloomberg-Treasury Scarcity to Grow as Fed Buys 90% of New Bonds-November 2012
- ↑ United States Department of the Treasury and Federal Reserve Board (January 18, 2011) "Major foreign holders of Treasury securities" U.S. Department of the Treasury [website]. Retrieved January 22, 2011.
- ↑ Sahadi, Jeanne (December 20, 2009). "$4.8 trillion-interest on U.S. debt". CNNMoney.com. Retrieved February 6, 2011.
- ↑ Ferguson, Niall (November 3, 2009). "Interview with Charlie Rose". Charlie Rose [website]. Retrieved February 6, 2011.
- ↑ U.S. Chamber of Commerce
- ↑ Saint Louis Federal Reserve (2012) "5-Year Treasury Inflation-Indexed Security, Constant Maturity" FRED Economic Data chart from government debt auctions (the x-axis at y=0 represents the inflation rate over the life of the security)
- 1 2 Carmen M. Reinhart and M. Belen Sbrancia (March 2011) "The Liquidation of Government Debt" National Bureau of Economic Research working paper No. 16893
- ↑ David Wessel (August 8, 2012) "When Interest Rates Turn Upside Down" Wall Street Journal (full text)
- ↑ Lawrence Summers (June 3, 2012) "Breaking the negative feedback loop" Reuters
- ↑ Matthew Yglesias (May 30, 2012) "Why Are We Collecting Taxes?" Slate
- ↑ William H. Gross (May 2, 2011) "The Caine Mutiny (Part 2)" PIMCO Investment Outlook
- ↑ "Why the U.S. Government Never, Ever Has to Pay Back All Its Debt" The Atlantic, February 1, 2013
- ↑ Federal Reserve-Ben Bernanke-The U.S. Economic Outlook-September 2011
- ↑ The Financial Times-Christine Lagarde Op Ed-Don't Let Fiscal Brakes Stall Global Recovery-August 2011
- ↑ NYT-Krugman-The Hijacked Crisis-August 2011
- ↑ OMB-President's 2012 Budget-Table S-13
- ↑ Bureau of Economic Analysis-Q2 GDP Press Release
- ↑ NYT-Binyamin Appelbaum-Austerity Kills Government Jobs as Cuts to Budgets Loom-February 26, 2013
- ↑ "FRB Testimony on the Seminannual Monetary Policy Report to Congress". Federal Reserve. February 26, 2013. Retrieved March 2, 2013.
- ↑ McKinsey Quarterly-Michael Spence-August 2011
- ↑ NYT-Robert Reich-The Limping Middle Class-September 2011
- ↑ Stiglitz, Joseph E. (2012-06-04). The Price of Inequality: How Today's Divided Society Endangers Our Future (p. 85). Norton. Kindle Edition. See also: Karen E. Dynan, Jonathan Skinner, and Stephen P. Zeldes, "Do the Rich Save More?," Journal of Political Economy 112, no. 2 (2004): 397– 444.
- ↑ NYT-Joseph Stiglitz-Inequality is holding back the recovery-January 2013
- ↑ Ambrose Evans-Pritchard (October 21, 2012) "IMF's epic plan to conjure away debt and dethrone bankers" The Telegraph
- ↑ Jaromir Benes and Michael Kumhof (August 2012) "The Chicago Plan Revisited" International Monetary Fund working paper WP/12/202
- ↑ "Debt-Deflation versus the Liquidity Trap: the Dilemma of Nonconventional Monetary Policy" CNRS, CES, Paris School of Economics, ESCP-Europe, October 23, 2012
- ↑ "Credit and debt in Economic Theory: Which Way forward?" “Economics of Credit and Debt workshop, November 2012
- ↑ "The economic crisis: How to stimulate economies without increasing public debt", Centre for Economic Policy Research, August 2012
- ↑ National Academies-Choosing the Nation's Fiscal Future-2010
- ↑ Fiscal Reform Commission-Testimony of Rudolph Penner-April 2010
- ↑ Washington Post-EJ Dionne-Why Doing Nothing Yields $7.1 trillion in deficit cuts-November 16, 2011
- ↑ Republican Website-Roadmap for America's Future
- ↑ Roadmap for America's Future-Charts & Graphs-February 2010
- ↑ Washington Post-Robert Samuelson-Paul Ryan's Lonely Challenge-February 2010
- ↑ Forbes-Bartlett-Paul Ryan's Budgetary Holy Grail-February 2010
- ↑ CBO-Ryan Roadmap Letter-January 2010
- ↑ CBPP-Ryan Bill Analysis-March 10, 2010
- ↑ Paul Ryan-Response to CBPP Study-March 11, 2010
- ↑ House of Representatives-Committee on the Budget-Retrieved April 2011
- ↑ CBO-Long-Term Analysis of a Budget Proposal by Chairman Ryan-April 5 2011
- ↑ Paul Krugman-Ludicrous and Cruel-April 7, 2011
- ↑ Paul Krugman-Ryan and Taxes-April 8, 2011
- ↑ GOP Solutions for America-Budget-Retrieved September, 2010
- ↑ Republican Party-A Pledge to America-September 2010
- ↑ NYT Editorial-The GOP's Pledge-September 25, 2010
- ↑ Debt Plan Lacks Supermajority International Business Times, 3 December 2010
- ↑ Fiscal Commission-Final Report-December 2010
- ↑ Nation Commission-Co-Chairs Report Draft-November 10,2010
- ↑ CBPP-Bowles Simpson Plan Evaluation-November 16,2010
- ↑ President Obama-Remarks by the President on Fiscal Policy-April 13, 2011
- ↑ Zero Democrats vote to proceed on Obama budget, fails 0-97
- ↑ OMB-President Obama-Living within our Means and Investing in Our Future-September 2011-Table S-1
- ↑ CBPP-Statement on President Obama's Fiscal Package-September 19,2011
- ↑ CPC-The People's Budget-April 2011
- ↑ Economic Policy Institute-Evaluation of CPC Budget Proposal-April 2011
- ↑ Economist-The Courageous Progressive Caucus Budget-April 2011
- ↑ NYT-Paul Krugman-The Progressive Budget Alternative-April 2011
- ↑ PGPF-Solutions Summit-May 2011
- ↑ Bipartisan Policy Center Domenici-Rivlin Debt Reduction Task Force-
- ↑ CNN-Jeanne Sahadi-New Deficit Plan Would Cut $6 trillion-November 2010
- ↑ CBO CBO-Presentation to Macroeconomic Advisers-September 2011
- ↑ CBO-Confronting the Nation's Fiscal Policy Challenges-September 2011
- ↑ Charlie Rose Show-Peter Orszag Interview-November 3, 2009
- ↑ Zakaria GPS-February 21, 2010
- ↑ Zakaria GPS-April 4,2010
- ↑ Charlie Rose Interview with Niall Ferguson-November 3, 2009
- ↑ Wells Fargo Economics-Raise the Roof: A Perspective on Federal Spending-May 16, 2011
- ↑ Thomas Friedman-NYT-The Whole Truth and Nothing But-September 2011
- ↑ NYT-Paul Krugman-Willie Sutton Wept-February 2011
- ↑ Gulfnews-Nouriel Roubini-U.S. Faces Inflation or Default-May 2010
- ↑ Leonhardt-NYT-The Perils of Pay Less, Get More-March 16, 2010
- ↑ MSNBC-Bernanke Warns of Vicious Cycle in Deficits-January 18, 2007
- ↑ Ben Bernanke-Speech before the National Commission on Fiscal Responsibility and Reform-April 2010
- ↑ Washington Post-Steven Pearlstein-Solving the Deficit Problem Requires an Open Mind, Common Sense and Courage-May 2010
- ↑ Washington Post-Robert J. Samuelson-Ten Ways to Fix the Budget-August 2011
- ↑ Pew Center-Only a handful of proposals for reducing the deficit get majority support-December 20, 2015
- ↑ Bartlett-Forbes-Not Another Budget Commission!-December 2010
- ↑ Americans want government to spend for jobs, send bill to rich
- ↑ Bloomberg/Selzer-Poll Data Detail
- ↑ Rassmussen Reports-February 2010
- ↑ Rassmussen Reports-January 28, 2010
- ↑ Pew Research-Deficit Concerns Rise, but Solutions are Elusive-March 2010
- ↑ National Journal-Americans Split on Concern for Very Poor-February 2012
- ↑ Cha, J.M. (December 7, 2012) "Why is Washington Reducing the Deficit Instead of Creating Jobs?" Demos Explainer