Data model (GIS)
A data model in geographic information systems is a mathematical construct for representing geographic objects or surfaces as data. For example, the vector data model represents geography as collections of points, lines, and polygons; the raster data model represent geography as cell matrices that store numeric values; and the TIN data model represents geography as sets of contiguous, nonoverlapping triangles.[1]
Representing three-dimensional map information
There are two approaches for representing three-dimensional map information, and for managing it in the data model.[2]
Vector-based stack-unit
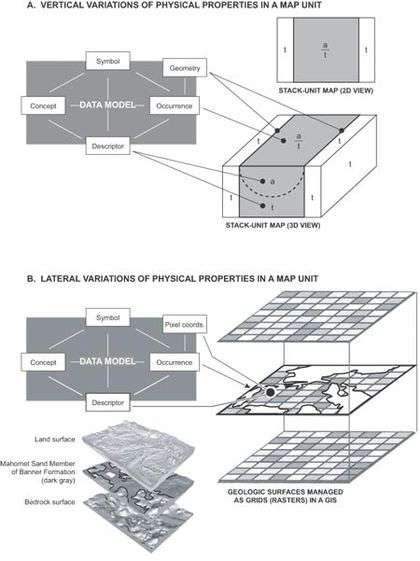
Vector-based stack-unit maps depict the vertical succession of geologic units to a specified depth (here, the base of the block diagram). This mapping approach characterizes the vertical variations of physical properties in each 3-D map unit. In this example, an alluvial deposit (unit “a”) overlies glacial till (unit “t”), and the stack-unit labeled “a/t” indicates that relationship, whereas the unit “t” indicates that glacial till extends down to the specified depth. In a manner similar to that shown in figure 11, the stack-unit’s occurrence (the map unit’s outcrop), geometry (the map unit’s boundaries), and descriptors (the physical properties of the geologic units included in the stack-unit) are managed as they are for a typical 2-D geologic map.[2]
Raster-based stacked surfaces
Raster-based stacked surfaces depict the surface of each buried geologic unit, and can accommodate data on lateral variations of physical properties. In this example from Soller and others (1999),[3] the upper surface of each buried geologic unit was represented in raster format as an ArcInfo Grid file. The middle grid is the uppermost surface of an economically important aquifer, the Mahomet Sand, which fills a pre- and inter-glacial valley carved into the bedrock surface. Each geologic unit in raster format can be managed in the data model, in a manner not dissimilar from that shown for the stack-unit map. The Mahomet Sand is continuous in this area, and represents one occurrence of this unit in the data model. Each raster, or pixel, on the Mahomet Sand surface has a set of map coordinates that are recorded in a GIS (in the data model bin that is labeled “Pixel coordinates”, which is the raster corollary of the “Geometry” bin for vector map data). Each pixel can have a unique set of descriptive information, such as surface elevation, unit thickness, lithology, transmissivity, etc.).
See also
References
- ↑ Wade, T. and Sommer, S. eds. A to Z GIS
- 1 2 3 David R. Soller1 and Thomas M. Berg (2003). The National Geologic Map Database Project: Overview and Progress U.S. Geological Survey Open-File Report 03–471.
- ↑ D.R. Soller et al. (1999). "Proposed guidelines for inclusion of digital map products in the National Geologic Map Database". In Soller, D.R., ed., Digital Mapping Techniques ‘99—Workshop Proceedings:. U.S. Geological Survey Open-File Report 99-386, p. 35–38,
Further reading
| Wikimedia Commons has media related to Data model (GIS). |
- B.R. Johnson et al. (1998). Digital geologic map data model. v. 4.3: AASG/USGS Data Model Working Group Report, http://geology.usgs.gov/dm/.
- Soller, D.R., Berg, T.M., and Wahl, Ron (2000). "Developing the National Geologic Map Database, phase 3—An online, "living" database of map information". In Soller, D.R., ed., Digital Mapping Techniques ‘00—Workshop Proceedings: U.S. Geological Survey Open-File Report 00-325, p. 49–52, http://pubs.usgs.gov/openfile/of00-325/soller4.html.
- Soller, D.R., and Lindquist, Taryn (2000). "Development and public review of the draft "Digital cartographic standard for geologic map symbolization". In Soller, D.R., ed., Digital Mapping Techniques ‘00—Workshop Proceedings: U.S. Geological Survey Open-File Report 00-325, p. 43–47, http://pubs.usgs.gov/openfile/of00-325/soller3.html.