1974–75 Australian region cyclone season
| |
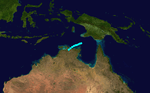
| Season summary map |
| First system formed |
17 October 1974 |
| Last system dissipated |
25 May 1975 |
| Strongest storm1 |
Trixie – 925 hPa (mbar), |
| Tropical lows |
16 |
| Tropical cyclones |
5 |
| Severe tropical cyclones |
3 |
| Total fatalities |
Unknown |
| Total damage |
Unknown |
| 1Strongest storm is determined by lowest pressure |
Australian region tropical cyclone seasons
1972–73, 1973–74, 1974–75, 1975–76, 1976–77 |
| Related articles |
|
|
The 1974–75 Australian region cyclone season saw above normal activity.
Storms
Tropical Cyclone Marcia
| Category 2 tropical cyclone (Australian scale) |
| Tropical storm (SSHWS) |
|
|
| Duration |
October 17 – October 25 |
| Peak intensity |
95 km/h (60 mph) (10-min) 988 hPa (mbar) |
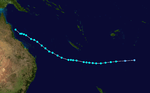
The first named storm of the season developed as a small depression out over the open waters of the southern Indian Ocean. Over the following three days, the system gradually developed into a tropical cyclone as it tracked towards the southeast. On 18 October, a ship named Alkuwait encountered the storm and reported winds near hurricane-force; however, the satellite presentation of the system was not supportive of these winds. Later named Marcia, the storm is estimated to have attained peak winds around 85 km/h (50 mph) on 20 October.[1] Around this time Marcia also attained a barometric pressure of 989 mbar (hPa; 29.2 inHg).[2] The following day, as the storm was situated 320 km (200 mi) west-southwest of the Cocos Islands, the outer bands of Marcia brought unsettled weather to the islands.[1] On 22 October, the storm slowed and began tracking towards the west. A weakened system, the remnants of Marcia crossed 90°E into the South-West Indian Ocean basin.[2]
Tropical Cyclone Norah
| Category 2 tropical cyclone (Australian scale) |
| Tropical storm (SSHWS) |
|
|
| Duration |
October 28 – November 4 |
| Peak intensity |
100 km/h (65 mph) (10-min) 981 hPa (mbar) |
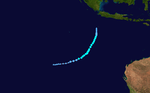
Cyclone Norah existed over the eastern Indian Ocean from October 28 to November 4.
Severe Tropical Cyclone Penny
| Category 3 severe tropical cyclone (Australian scale) |
| Tropical storm (SSHWS) |
|
|
| Duration |
November 6 – November 16 |
| Peak intensity |
130 km/h (80 mph) (10-min) 981 hPa (mbar) |
Cyclone Penny also existed over the eastern Indian Ocean from November 6 to November 16.
Cyclone Selma
| Tropical storm (SSHWS) |
|
|
| Duration |
December 1 – December 9 |
| Peak intensity |
110 km/h (70 mph) (1-min) 980 hPa (mbar) |
Cyclone Selma was predicted to impact Darwin, but it dissipated before it impacted land.
Severe Tropical Cyclone Tracy
| Category 4 severe tropical cyclone (Australian scale) |
| Category 3 tropical cyclone (SSHWS) |
|
|
| Duration |
December 19 – December 25 |
| Peak intensity |
175 km/h (110 mph) (10-min) 950 hPa (mbar) |
Cyclone Tracy devastated the city of Darwin, Northern Territory, Australia, from Christmas Eve to Christmas Day, 1974. It is the most compact cyclone or equivalent-strength hurricane on record in the Australian basin, with gale-force winds extending only 48 kilometres (30 mi) from the centre and was the most compact system worldwide until Tropical Storm Marco of the 2008 Atlantic hurricane season broke the record, with gale-force winds extending only 19 kilometres (12 mi) from the centre.[3][4] After forming over the Arafura Sea, the storm moved southwards and affected the city with Category 4 winds on the Australian cyclone intensity scale, while there is evidence to suggest that it had reached Category 3 on the Saffir-Simpson Hurricane Scale when it made landfall.[5]
Tracy killed 71 people, caused A$837 million in damage (1974 dollars) and destroyed more than 70 percent of Darwin's buildings, including 80 percent of houses.[6][7] Tracy left more than 41,000 out of the 47,000 inhabitants of the city homeless prior to landfall and required the evacuation of over 30,000 people.[8] Most of Darwin's population was evacuated to Adelaide, Whyalla, Alice Springs and Sydney, and many never returned to the city. After the storm passed, the city was rebuilt using more modern materials and updated building techniques. Bruce Stannard of The Age stated that Cyclone Tracy was a "disaster of the first magnitude ... without parallel in Australia's history."[9]
Tropical Cyclone Flora
| Category 2 tropical cyclone (Australian scale) |
| Tropical storm (SSHWS) |
|
|
| Duration |
January 12 – January 22 |
| Peak intensity |
100 km/h (65 mph) (10-min) 980 hPa (mbar) |
Tropical Cyclone Flora existed from January 12 to January 22.
Cyclone Robyn-Deborah
| Category 1 tropical cyclone (SSHWS) |
|
|
| Duration |
January 14 – January 28 |
| Peak intensity |
150 km/h (90 mph) (1-min) 964 hPa (mbar) |
Tropical Cyclone Robyn-Deborah existed from January 14 to January 28.
Severe Tropical Cyclone Gloria
| Category 3 severe tropical cyclone (Australian scale) |
| Tropical storm (SSHWS) |
|
|
| Duration |
January 14 – January 23 |
| Peak intensity |
120 km/h (75 mph) (10-min) 976 hPa (mbar) |
Tropical Cyclone Gloria existed from January 14 to January 23.
Severe Tropical Cyclone Shirley
| Category 3 severe tropical cyclone (Australian scale) |
| Tropical storm (SSHWS) |
|
|
| Duration |
February 3 – February 12 |
| Peak intensity |
130 km/h (80 mph) (10-min) 981 hPa (mbar) |
Tropical Cyclone Shirley existed from February 3 to February 12.
Severe Tropical Cyclone Trixie
| Category 5 severe tropical cyclone (Australian scale) |
| Category 4 tropical cyclone (SSHWS) |
|
|
| Duration |
February 15 – February 22 |
| Peak intensity |
215 km/h (130 mph) (10-min) 925 hPa (mbar) |
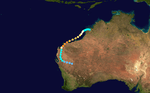
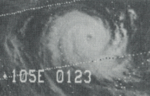
Wind gusts of 259 kilometres per hour (161 mph) at Mardie and 246 kilometres per hour (153 mph) at Onslow were measured during cyclone Trixie on 19 February 1975. The Onslow anemometer was destroyed after measuring its maximum gust during this storm. The gust at Mardie is the second-highest recorded on the Australian mainland, although the figure given was the limit of the anemometer, so the actual gusts may have been higher.[10]
Tropical Cyclone Wilma
| Tropical storm (SSHWS) |
|
|
| Duration |
March 10 – March 14 |
| Peak intensity |
110 km/h (70 mph) (1-min) 980 hPa (mbar) |
Tropical Cyclone Wilma existed from March 10 to March 14.
Severe Tropical Cyclone Vida
| Category 3 severe tropical cyclone (Australian scale) |
| Tropical storm (SSHWS) |
|
|
| Duration |
March 30 – April 12 |
| Peak intensity |
130 km/h (80 mph) (10-min) 982 hPa (mbar) |
On 20 March 1975 winds were recorded to 128 km/h at Fremantle, Western Australia and 109 km/h in neighbouring Perth. There was some damage including St George's Cathedral and Perry Lakes Stadium. At Rockingham a 7m-yacht sank, a 6m cabin cruiser was destroyed and many other craft were damaged.[11] Near Perth, the remnants of Vida produced strong winds, recorded up to 126 km/h (78 mph), damaged several structures.[12] Some homes lost their roofs and a few buildings had their walls collapse.[13] Offshore, several vessels were damaged by rough seas.[12] Relatively little rain was associated with the storm as only 17 mm (0.67 in) was measured in Cape Leeuwin. Overall losses from the storm reached A$1 million ($700,000 USD).[13]
Severe Tropical Cyclone Beverley
| Category 5 severe tropical cyclone (Australian scale) |
| Category 4 tropical cyclone (SSHWS) |
|
|
| Duration |
March 22 – April 3 |
| Peak intensity |
205 km/h (125 mph) (10-min) 929 hPa (mbar) |
Tropical cyclone Beverley affected Exmouth, Western Australia and the west coast in March 1975.
Cyclone Amelia
| Tropical storm (SSHWS) |
|
|
| Duration |
April 6 – April 8 |
| Peak intensity |
85 km/h (50 mph) (1-min) 990 hPa (mbar) |
Cyclone Amelia existed from April 6 to April 8.
Tropical Cyclone Clara
| Category 2 tropical cyclone (Australian scale) |
| Tropical storm (SSHWS) |
|
|
| Duration |
April 20 – April 26 |
| Peak intensity |
95 km/h (60 mph) (10-min) 985 hPa (mbar) |
Cyclone Clara existed from April 20 to April 26.
Tropical Cyclone Denise
| Category 1 tropical cyclone (Australian scale) |
| Tropical storm (SSHWS) |
|
|
| Duration |
May 18 – May 25 |
| Peak intensity |
75 km/h (45 mph) (10-min) 992 hPa (mbar) |
Cyclone Denise existed from May 18 to May 25.
See also
- Atlantic hurricane seasons: 1974, 1975
- Eastern Pacific hurricane seasons: 1974, 1975
- Western Pacific typhoon seasons: 1974, 1975
- North Indian Ocean cyclone seasons: 1974, 1975
References