Climate of Vancouver
| Vancouver Harbour | ||||||||||||||||||||||||||||||||||||||||||||||||||||||||||||
|---|---|---|---|---|---|---|---|---|---|---|---|---|---|---|---|---|---|---|---|---|---|---|---|---|---|---|---|---|---|---|---|---|---|---|---|---|---|---|---|---|---|---|---|---|---|---|---|---|---|---|---|---|---|---|---|---|---|---|---|---|
| Climate chart (explanation) | ||||||||||||||||||||||||||||||||||||||||||||||||||||||||||||
| ||||||||||||||||||||||||||||||||||||||||||||||||||||||||||||
| ||||||||||||||||||||||||||||||||||||||||||||||||||||||||||||
The climate of Vancouver, British Columbia, Canada is a moderate oceanic climate (Köppen climate classification Cfb) that borders on a warm-summer Mediterranean climate Csb. With summer months that are typically dry, often resulting in moderate drought conditions, usually in July and August. In contrast, the rest of the year is rainy, especially between October and March.
Like the rest of the British Columbia Coast, the city is tempered by the North Pacific Current, which has its origins in the milder Kuroshio Current and is also to an extent, sheltered by the mountains of Vancouver Island, to the west.
General conditions
The climatology of Vancouver applies to the entire Greater Vancouver region and not just to the City of Vancouver itself. While Vancouver's coastal location serves to moderate its temperatures, sea breezes and mountainous terrain make Greater Vancouver a region of microclimates, with local variations in weather sometimes being more exaggerated than those experienced in other coastal areas.
Predicting precipitation in the Greater Vancouver area is particularly complex. It is a rule of thumb that for every rise of 100 m (330 ft) in elevation, there is an additional 100 mm (3.9 in) (1.2 in (30 mm) per 100 ft (30 m)) of precipitation, so places such as the District of North Vancouver on the North Shore Mountains get more rain. Snow is problematic for meteorologists to predict due to temperatures remaining close to freezing during snow events.
Temperatures
The annual average temperature in Vancouver is 11.0 °C (51.8 °F) downtown and 10.4 °C (50.7 °F) at the airport, in Richmond, amongst the warmest in Canada. It is located in a USDA plant hardiness zone of 8,[1] similar to other coastal or near-coastal cities such as Seattle, Portland, Amsterdam and London, as well as places such as Atlanta, Georgia and Raleigh, North Carolina, far to the south. The mild climate allows plants such as the Windmill Palm to sustain. Vancouver's growing season averages 221 days, from March 29 until November 5. This is 72 days longer than Toronto's, and longer than any other major centre in Canada.[2]
Despite normally mild winters resulting from the onshore flow over the North Pacific Current, occasional arrivals of cold arctic outflows (sinking cold continental air that flows down though the Fraser Valley coastward) in winter can sometimes last a week or more. These arctic outbreaks occur on average about one to three times per winter. In an extreme case, the coldest month on record at Vancouver International Airport was in January 1950 when an arctic air inflow moved in from the Fraser Valley and remained locked over the city, with an average low of −9.7 °C (15 °F) and an average high of only −2.9 °C (27 °F), making for a daily average of −6.3 °C (20.7 °F), 10 °C (18 °F) colder than normal. The coldest temperature ever recorded in the city was −17.8 °C (0 °F).
With snow being an infrequent occurrence over a typically mild winter, many cold hearty flowers remain in bloom and are common in gardens and office exteriors throughout the winter. The arrival of spring is often first noticed in February with slightly milder temperatures and the return of flowering perennials. It's also not uncommon for cherry blossoms to begin blooming later in the month, as was seen prominently during the 2010 Winter Olympics.
The Greater Vancouver region is also subject to significant variations in summer temperatures, which can differ by as much as 5–10 °C (9–18 °F) between inland areas of the Fraser Valley and the ocean-tempered coastal regions when localized on-shore breezes are in effect. Conversely, winter temperatures tend to be cooler inland by a couple of degrees.
Daylight
Winters in Vancouver can be quite dark. The relatively high latitude of 49° 15′ 0″ N (e.g. like Paris, France) means early sunsets (as early as 4:15 pm) and late sunrises (as late as 8:10 am). From November to February, at the sunshine measuring station at the airport in Richmond, on average more than 70% of the already short daytime is completely cloudy. The percentage of cloudiness is higher in Vancouver and especially the North Shore because upslope winds going up the mountainsides lead to the development of clouds.
Summers, in contrast, are characterized by a nearly opposite weather pattern, with consistent high pressure and sunshine. July and August are the sunniest months. For several nights near the summer solstice, there are less than 7.5 hours between sunset and sunrise, with twilight lasting past 10 pm.
Statistics
| Climate data for Vancouver International Airport (Richmond), 1981–2010 normals, extremes 1898–present[lower-alpha 1] | |||||||||||||
|---|---|---|---|---|---|---|---|---|---|---|---|---|---|
| Month | Jan | Feb | Mar | Apr | May | Jun | Jul | Aug | Sep | Oct | Nov | Dec | Year |
| Record high humidex | 17.2 | 18.0 | 20.3 | 23.9 | 33.7 | 33.9 | 38.3 | 35.9 | 33.0 | 27.2 | 21.1 | 16.1 | 38.3 |
| Record high °C (°F) | 15.3 (59.5) |
18.4 (65.1) |
20.0 (68) |
26.1 (79) |
30.4 (86.7) |
33.3 (91.9) |
34.4 (93.9) |
33.3 (91.9) |
30.0 (86) |
25.0 (77) |
20.1 (68.2) |
15.0 (59) |
34.4 (93.9) |
| Average high °C (°F) | 6.9 (44.4) |
8.2 (46.8) |
10.3 (50.5) |
13.2 (55.8) |
16.7 (62.1) |
19.6 (67.3) |
22.2 (72) |
22.2 (72) |
18.9 (66) |
13.5 (56.3) |
9.2 (48.6) |
6.3 (43.3) |
13.9 (57) |
| Daily mean °C (°F) | 4.1 (39.4) |
4.9 (40.8) |
6.9 (44.4) |
9.4 (48.9) |
12.8 (55) |
15.7 (60.3) |
18.0 (64.4) |
18.0 (64.4) |
14.9 (58.8) |
10.3 (50.5) |
6.3 (43.3) |
3.6 (38.5) |
10.4 (50.7) |
| Average low °C (°F) | 1.4 (34.5) |
1.6 (34.9) |
3.4 (38.1) |
5.6 (42.1) |
8.8 (47.8) |
11.7 (53.1) |
13.7 (56.7) |
13.8 (56.8) |
10.8 (51.4) |
7.0 (44.6) |
3.5 (38.3) |
0.8 (33.4) |
6.8 (44.2) |
| Record low °C (°F) | −17.8 (0) |
−16.1 (3) |
−9.4 (15.1) |
−3.3 (26.1) |
0.6 (33.1) |
2.2 (36) |
6.1 (43) |
3.9 (39) |
−1.1 (30) |
−6.1 (21) |
−14.3 (6.3) |
−17.8 (0) |
−17.8 (0) |
| Record low wind chill | −22.6 | −21.2 | −14.5 | −5.4 | 0.0 | 0.0 | 0.0 | 0.0 | 0.0 | −11.4 | −21.3 | −27.8 | −27.8 |
| Average precipitation mm (inches) | 168.4 (6.63) |
104.6 (4.118) |
113.9 (4.484) |
88.5 (3.484) |
65.0 (2.559) |
53.8 (2.118) |
35.6 (1.402) |
36.7 (1.445) |
50.9 (2.004) |
120.8 (4.756) |
188.9 (7.437) |
161.9 (6.374) |
1,189 (46.811) |
| Average rainfall mm (inches) | 157.5 (6.201) |
98.9 (3.894) |
111.8 (4.402) |
88.1 (3.469) |
65.0 (2.559) |
53.8 (2.118) |
35.6 (1.402) |
36.7 (1.445) |
50.9 (2.004) |
120.7 (4.752) |
185.8 (7.315) |
148.3 (5.839) |
1,153.1 (45.4) |
| Average snowfall cm (inches) | 11.1 (4.37) |
6.3 (2.48) |
2.3 (0.91) |
0.3 (0.12) |
0.0 (0) |
0.0 (0) |
0.0 (0) |
0.0 (0) |
0.0 (0) |
0.1 (0.04) |
3.2 (1.26) |
14.8 (5.83) |
38.1 (15) |
| Average precipitation days (≥ 0.2 mm) | 19.5 | 15.4 | 17.7 | 14.8 | 13.2 | 11.5 | 6.3 | 6.7 | 8.3 | 15.4 | 20.4 | 19.7 | 168.9 |
| Average rainy days (≥ 0.2 mm) | 18.4 | 14.7 | 17.5 | 14.8 | 13.2 | 11.5 | 6.3 | 6.8 | 8.3 | 15.4 | 19.9 | 18.4 | 165.2 |
| Average snowy days (≥ 0.2 cm) | 2.6 | 1.4 | 0.9 | 0.2 | 0.0 | 0.0 | 0.0 | 0.0 | 0.0 | 0.03 | 0.8 | 2.8 | 8.73 |
| Average relative humidity (%) (at 1500 LST) | 81.2 | 74.5 | 70.1 | 65.4 | 63.5 | 62.2 | 61.4 | 61.8 | 67.2 | 75.6 | 79.5 | 80.9 | 70.3 |
| Mean monthly sunshine hours | 60.2 | 91.0 | 134.8 | 185.0 | 222.5 | 226.9 | 289.8 | 277.1 | 212.8 | 120.7 | 60.4 | 56.5 | 1,937.5 |
| Percent possible sunshine | 22.3 | 31.8 | 36.6 | 45.0 | 46.9 | 46.8 | 59.3 | 62.1 | 56.1 | 36.0 | 21.9 | 22.0 | 40.6 |
| Source: Environment Canada[5][6][7][8][9][10][11][12][13][14][15][16][17][18] | |||||||||||||
| Climate data for Vancouver Harbour CS (1971-2000) | |||||||||||||
|---|---|---|---|---|---|---|---|---|---|---|---|---|---|
| Month | Jan | Feb | Mar | Apr | May | Jun | Jul | Aug | Sep | Oct | Nov | Dec | Year |
| Record high °C (°F) | 15.6 (60.1) |
16.4 (61.5) |
19.1 (66.4) |
23.9 (75) |
32.7 (90.9) |
30.0 (86) |
31.7 (89.1) |
31.7 (89.1) |
28.5 (83.3) |
24.2 (75.6) |
17.0 (62.6) |
15.0 (59) |
32.7 (90.9) |
| Average high °C (°F) | 6.8 (44.2) |
8.4 (47.1) |
10.6 (51.1) |
13.5 (56.3) |
16.8 (62.2) |
19.6 (67.3) |
22.0 (71.6) |
22.3 (72.1) |
19.0 (66.2) |
13.9 (57) |
9.3 (48.7) |
6.8 (44.2) |
14.1 (57.4) |
| Daily mean °C (°F) | 4.8 (40.6) |
5.9 (42.6) |
7.6 (45.7) |
10.0 (50) |
13.2 (55.8) |
15.9 (60.6) |
18.1 (64.6) |
18.3 (64.9) |
15.4 (59.7) |
11.1 (52) |
7.1 (44.8) |
4.8 (40.6) |
11.0 (51.8) |
| Average low °C (°F) | 2.7 (36.9) |
3.4 (38.1) |
4.6 (40.3) |
6.5 (43.7) |
9.5 (49.1) |
12.2 (54) |
14.1 (57.4) |
14.4 (57.9) |
11.6 (52.9) |
8.2 (46.8) |
4.8 (40.6) |
2.8 (37) |
7.9 (46.2) |
| Record low °C (°F) | −13.3 (8.1) |
−6.7 (19.9) |
−5 (23) |
−1.1 (30) |
1.1 (34) |
2.8 (37) |
2.8 (37) |
5.0 (41) |
1.7 (35.1) |
−3.2 (26.2) |
−9.9 (14.2) |
−15.6 (3.9) |
−15.6 (3.9) |
| Average precipitation mm (inches) | 178.8 (7.039) |
183.8 (7.236) |
155.8 (6.134) |
117.9 (4.642) |
86.7 (3.413) |
69.9 (2.752) |
53.4 (2.102) |
50.8 (2) |
73.3 (2.886) |
147.8 (5.819) |
239.2 (9.417) |
231.3 (9.106) |
1,588.6 (62.543) |
| Average rainfall mm (inches) | 143.6 (5.654) |
173.5 (6.831) |
153.1 (6.028) |
117.0 (4.606) |
86.7 (3.413) |
69.9 (2.752) |
49.1 (1.933) |
48.3 (1.902) |
71.0 (2.795) |
131.9 (5.193) |
219.5 (8.642) |
211.5 (8.327) |
1,474.9 (58.067) |
| Average snowfall cm (inches) | 15.3 (6.02) |
10.2 (4.02) |
2.7 (1.06) |
0.9 (0.35) |
0.0 (0) |
0.0 (0) |
0.0 (0) |
0.0 (0) |
0.0 (0) |
0.0 (0) |
2.7 (1.06) |
11.8 (4.65) |
43.6 (17.17) |
| Average precipitation days (≥ 0.2 mm) | 18.3 | 16.4 | 16.6 | 14.9 | 12.9 | 11.6 | 7.6 | 7.7 | 9.4 | 14.9 | 19.8 | 19.1 | 169.1 |
| Average rainy days (≥ 0.2 mm) | 14.8 | 16.3 | 15.9 | 14.2 | 13.2 | 10.7 | 6.7 | 7.8 | 9.8 | 12.0 | 16.8 | 16.2 | 154.5 |
| Average snowy days (≥ 0.2 cm) | 2.8 | 1.9 | 0.89 | 0.24 | 0.0 | 0.0 | 0.0 | 0.0 | 0.0 | 0.05 | 0.88 | 2.9 | 9.6 |
| Mean monthly sunshine hours | 51.1 | 79.6 | 124.7 | 161.3 | 222.8 | 223.5 | 276.8 | 256.6 | 178.3 | 127.3 | 66.9 | 49.6 | 1,818.4 |
| Source #1: Environment Canada[19] | |||||||||||||
| Source #2: Environment Canada (sun, 1961-1990)[20] | |||||||||||||
| Climate data for Oakridge, Vancouver (1981-2010) | |||||||||||||
|---|---|---|---|---|---|---|---|---|---|---|---|---|---|
| Month | Jan | Feb | Mar | Apr | May | Jun | Jul | Aug | Sep | Oct | Nov | Dec | Year |
| Average precipitation mm (inches) | 222.7 (8.768) |
111.4 (4.386) |
125.0 (4.921) |
101.7 (4.004) |
75.3 (2.965) |
67.8 (2.669) |
42.6 (1.677) |
48.4 (1.906) |
59.1 (2.327) |
156.8 (6.173) |
238.5 (9.39) |
207.3 (8.161) |
1,456.6 (57.346) |
| Average rainfall mm (inches) | 207.0 (8.15) |
106.8 (4.205) |
122.5 (4.823) |
101.7 (4.004) |
75.1 (2.957) |
67.8 (2.669) |
42.6 (1.677) |
48.4 (1.906) |
59.1 (2.327) |
156.7 (6.169) |
233.5 (9.193) |
190.9 (7.516) |
1,412 (55.591) |
| Average snowfall cm (inches) | 15.7 (6.18) |
4.5 (1.77) |
2.6 (1.02) |
0.0 (0) |
0.2 (0.08) |
0.0 (0) |
0.0 (0) |
0.0 (0) |
0.0 (0) |
0.1 (0.04) |
5.0 (1.97) |
16.4 (6.46) |
44.6 (17.56) |
| Average precipitation days (≥ 0.2 mm) | 19.9 | 14.5 | 17.3 | 15.8 | 12.7 | 10.9 | 7.0 | 7.1 | 7.6 | 15.6 | 19.6 | 20.2 | 168.2 |
| Average rainy days (≥ 0.2 mm) | 18.4 | 13.9 | 16.9 | 15.8 | 12.7 | 10.9 | 7.0 | 7.1 | 7.6 | 15.6 | 19.1 | 18.8 | 163.7 |
| Average snowy days (≥ 0.2 cm) | 3.1 | 0.9 | 0.6 | 0.0 | 0.07 | 0.0 | 0.0 | 0.0 | 0.0 | 0.06 | 0.8 | 3.1 | 8.6 |
| Source: Environment Canada[21] | |||||||||||||
Precipitation
Rain

Vancouver is Canada's third most rainy city, with over 161 rainy days per year. As measured at Vancouver Airport in Richmond, Vancouver receives 1,153.1 mm (45.40 in) of rain per year. By comparison, the amount of rainfall in London, England is nearly half that of Vancouver. In North Vancouver, about 20 km (12 mi) away from the Vancouver airport, the amount of rain received doubles to 2,477 mm (97.5 in) per year as measured at the base of Grouse Mountain.[22]
Thunderstorms are rare, with an average of 6.1 thunderstorm days per year.[23] The weather in spring and autumn is usually showery and cool.
Grass-cutting season often begins in March and continues through October. Summers can be quite dry, and, as such, grass that has not been watered may not need to be cut for a month or even longer. Some summers may have no rain for five weeks or more, while others might have several very wet days in a row. In addition, Vancouver is one of the driest cities in Canada during the summer season, but the rest of the year the high pressure that locks in during the summer moves out and is replaced by the usual low pressure systems (rainy weather) by fall through to mid spring.
July is historically the driest month in Vancouver and, in fact, Vancouver International Airport recorded no rainfall at all during the whole month of July 2013;[24] the first time ever in recorded history. Many other Julys had recorded less than 1 mm (0.039 in) of rain in Vancouver.
Snow

Snow falls in the higher-lying areas of Greater Vancouver, such as Burnaby Mountain, Coquitlam, and North and West Vancouver, every winter. It is also common in places close to or at sea level, however in less amounts. There is a general misconception among visitors and residents of other parts of Canada that Vancouver does not receive any snow at all, but in fact there has never been a year in which traceable snow has not been observed at Vancouver International Airport. The year 2015 marks an entire year of no measurable snow; only a trace was recorded on December 17, 2015. Environment Canada has ranked Vancouver in 3rd place under the category of "Lowest Snowfall" among 100 major Canadian cities. Vancouver's coastal climate has nonetheless allowed it to be ranked in 59th place under the category of "Most huge snowfall days (25 cm or more)", placing it well above cities like Calgary and Toronto.[23]
Snow in Vancouver tends to be quite wet, which, combined with typical winter temperatures rising above and falling below 0 °C (32 °F) throughout the course of the day, can make for icy road conditions.
Years or months with snowfall surpassing 100 cm (39 in) are not completely exceptional. Snowfall exceeding 100 cm (39 in) occurred twice during the 1990s, and, in January 1972 alone, there was more than 120 cm (47 in) of snow. The snowiest year on record at Vancouver International Airport was 1971, which received a total of 242.6 cm (95.5 in), and the greatest snow depth reported was 61 cm (24 in) on January 15 of that year.
Although the 30–60 cm (12–24 in) which fell across Greater Vancouver and the Lower Mainland in a 24‑hour period in November 2006 was out of the ordinary, snow has in fact accumulated at sea level in all months except for June, July, and August. However, even small amounts of snow in the Vancouver area can cause school closures, as well as produce traffic problems. The low frequency of snowfall makes it hard to justify the public works infrastructure necessary for more effective snow removal, as the city is usually in a thaw situation long before plowing of streets are completed. The City budgets $400,000 per year for the maintenance of snow removal equipment, for the purchasing of deicing salt, and for the training of staff, but the costs of actual snow removal are funded separately from contingency reserve funds, and vary widely from season to season. For example, $1.1 million was spent in 1998, compared to $0 in 2001.[25] Blizzards are extremely rare, but heavy snowfall events are more common. One such event in 1996 resulted in over 60 cm (24 in) of snow in Vancouver and was responsible for millions of dollars in damage.
According to Environment Canada (2011), Vancouver now has a 20% chance of a White Christmas (up from 11%).[26] Vancouver experienced a White Christmas in 2008 after weeks of record breaking cold temperatures and four consecutive snow storms, leaving over 60 cm (24 in) of snow on the ground across Metro Vancouver. New snow also accumulated on Christmas Eve and Christmas Day giving it the title for Canada's whitest Christmas in 2008 with 41 cm (16 in) on ground (48 cm (19 in) at one point on Christmas Eve). Snow was also present for Christmas 2007, when 1 cm (0.39 in) was measured at the Vancouver International Airport. The previous official White Christmas occurred in 1998 when 20 cm (7.9 in) of snow was on the ground on Christmas Day following 31 cm (12 in) of snow and 20 mm (0.79 in) of rain. Despite higher frequency of snow during certain periods of the season (pattern unknown), generally, annual winter snowfall has decreased over the last 20 years.[27]
Severe weather

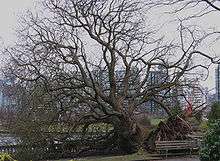
Gales are unlikely during the autumn months in Greater Vancouver. Three wind storms in the city's history have knocked down large swathes of trees in the forest of Stanley Park, the first having occurred in October 1934, with a blizzard the following January compounding its impact.[28] The second wind storm to hit Stanley Park was the remnant of Typhoon Freda in 1962 that levelled a 6-acre (24,000 m2) tract of forest. This is now site of the park's miniature railroad.[29]
Fall-winter 2006 storms
In November 2006, the Greater Vancouver region experienced above-average levels of rainfall and snowfall, breaking the previously established record of 18.1 cm (7.1 in) when 25.5 cm (10.0 in) of rain fell within the first 16 days of the month.[30] The heavy rain washed sediment into the city's reservoirs, and, as result, many businesses were advised to stop serving beverages prepared from tap water due to water contamination.
At Vancouver International Airport 28 cm (11 in) of snow was recorded from the night of November 25 to the morning of November 27. The temperature dropped to −12 °C (10 °F) on November 28, 1.8 °C (3 °F) higher than the record low for the day, which was set in November 1985. On November 29, 10 cm (3.9 in) more snow fell on the city. The snowfall resulted in the closure of a number of public institutions and caused power outages throughout Surrey and Langley.
The Hanukkah Eve Wind Storm of 2006 swept through Greater Vancouver on December 15, 2006 with winds reaching from 70 to 125 km/h (43 to 78 mph). In Stanley Park, it damaged or uprooted over 5,000 trees, and caused mudslides, one of which destroyed a section of the seawall.[31][32] Insured damages throughout the province were expected to reach CA$40 million and repairs to Stanley Park were expected to cost $9 million.[33][34]

Notes
References
- ↑ "Plant Hardiness Zone Map for North America".
- ↑ "Frost Chart for Canada". The Old Farmers Almanac. Retrieved 2012-10-01.
- ↑ "Daily Data Report for October 1898". Environment Canada. Retrieved 27 April 2016.
- ↑ "Monthly Data Report for 1937". Environment Canada. Retrieved 12 May 2016.
- ↑ "1981 to 2010 Canadian Climate Normals". Environment Canada. 2015-09-22. Climate ID: 1108447. Retrieved 2016-05-09.
- ↑ "Daily Data Report for March 1941". Canadian Climate Data. Environment Canada. Retrieved 12 May 2016.
- ↑ "Daily Data Report for April 1934". Canadian Climate Data. Environment Canada. Retrieved 12 May 2016.
- ↑ "Daily Data Report for June 1925". Canadian Climate Data. Environment Canada. Retrieved 12 May 2016.
- ↑ "Daily Data Report for September 1944". Canadian Climate Data. Environment Canada. Retrieved 12 May 2016.
- ↑ "Daily Data Report for October 1934". Canadian Climate Data. Environment Canada. Retrieved 12 May 2016.
- ↑ "Daily Data Report for December 1939". Canadian Climate Data. Environment Canada. Retrieved 12 May 2016.
- ↑ "Daily Data Report for June 1901". Canadian Climate Data. Environment Canada. Retrieved 12 May 2016.
- ↑ "Daily Data Report for July 1909". Canadian Climate Data. Environment Canada. Retrieved 12 May 2016.
- ↑ "Daily Data Report for August 1910". Canadian Climate Data. Environment Canada. Retrieved 12 May 2016.
- ↑ "Daily Data Report for September 1908". Canadian Climate Data. Environment Canada. Retrieved 12 May 2016.
- ↑ "Daily Data Report for October 1935". Canadian Climate Data. Environment Canada. Retrieved 12 May 2016.
- ↑ "Calculation Information". Environment Canada. Retrieved 2016-05-12.
- ↑ "Daily Data Report for November 2016". Canadian Climate Data. Environment Canada. Retrieved 9 November 2016.
- ↑ "Vancouver Harbour CS, British Columbia". Canadian Climate Normals 1971–2000. Environment Canada. Retrieved 2016-11-04.
- ↑ "Vancouver BCHPA, British Columbia". Canadian Climate Normals 1961–1990. Environment Canada. Retrieved 2013-02-20.
- ↑ "Vancouver Oakridge, British Columbia". Canadian Climate Normals 1981–2010. Environment Canada. Retrieved 2016-04-19.
- ↑ Osborn, Liz. "Canada's Rainiest Cities". CurrentResults.com. Retrieved 2013-12-26.
- 1 2 Weather Winners WebSites
- ↑ Driest July ever in Vancouver, record rain in Toronto
- ↑ Engineering Services, Streets
- ↑ "Environment Canada – Weather and Meteorology – Chance of White Christmas". Environment Canada. 2013-12-17. Archived from the original on 2013-03-01. Retrieved 2013-12-26.
- ↑ Climate Normals & Averages | Canada's National Climate Archive Archived June 27, 2013, at the Wayback Machine.. Climate.weatheroffice.gc.ca. Retrieved on 2013-12-15.
- ↑ "The Damage in the Park". Vancouver Daily Province. February 9, 1935.
- ↑ Hazlitt, Tom (May 22, 1964). "It's for real – this railroad". Vancouver Daily Province.
- ↑ Vancouver, The (2006-11-30). "Our wettest month ever". Canada.com. Retrieved 2013-12-26.
- ↑ Rook, Katie (2006-12-19). "Stanley Park 'looks like a war zone'". National Post. Retrieved 2006-12-20.
- ↑ Kieltyka, Matt (2006-12-18). "'Look around, it's just devastation'". 24 Hours. Retrieved 2006-12-20.
- ↑ "Insurance claims could hit $80m" by The Province
- ↑ "Stanley Park restoration cost rises to $9 million" by CanWest News Service