Circular flow of income

The circular flow of income or circular flow is a model of the economy in which the major exchanges are represented as flows of money, goods and services, etc. between economic agents. The flows of money and goods exchanges in a closed circuit and correspond in value, but run in the opposite direction. The circular flow analysis is the basis of national accounts and hence of macroeconomics.
The idea of the circular flow was already present in the work of Richard Cantillon.[2] François Quesnay developed and visualized this concept in the so-called Tableau économique.[3] Important developments of Quesnay's tableau were Karl Marx' reproduction schemes in the second volume of Capital: Critique of Political Economy, and John Maynard Keynes' General Theory of Employment, Interest and Money. Richard Stone further developed the concept for the United Nations (UN) and the Organisation for Economic Co-operation and Development to the system, which is now used internationally.
Overview
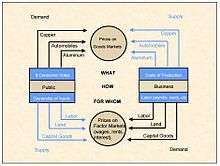
The circular flow of income is a concept for better understanding of the economy as a whole and for example the National Income and Product Accounts (NIPAs). In its most basic form it considers a simple economy consisting solely of businesses and individuals, and can be represented in a so-called "circular flow diagram." In this simple economy, individuals provide the labour that enables businesses to produce goods and services. These activities are represented by the green lines in the diagram.[4]

Alternatively, one can think of these transactions in terms of the monetary flows that occur. Businesses provide individuals with income (in the form of compensation) in exchange for their labor. That income is, in turn, spent on the goods and services businesses produce. These activities are represented by the blue lines in the diagram above.[4]
The circular flow diagram illustrates the interdependence of the “flows,” or activities, that occur in the economy, such as the production of goods and services (or the “output” of the economy) and the income generated from that production. The circular flow also illustrates the equality between the income earned from production and the value of goods and services produced.[4]
Of course, the total economy is much more complicated than the illustration above. An economy involves interactions between not only individuals and businesses, but also Federal, state, and local governments and residents of the rest of the world. Also not shown in this simple illustration of the economy are other aspects of economic activity such as investment in capital (produced—or fixed—assets such as structures, equipment, research and development, and software), flows of financial capital (such as stocks, bonds, and bank deposits), and the contributions of these flows to the accumulation of fixed assets.[4]
History
Cantillon
One of the earliest ideas on the circular flow was explained in the work of 18th century Irish-French economist Richard Cantillon,[2] who was influenced by prior economists, especially William Petty.[6] Cantillon described the concept in his 1730 Essay on the Nature of Trade in General, in chapter 11, entitled "The Par or Relation between the Value of Land and Labor" to chapter 13, entitled "The Circulation and Exchange of Goods and Merchandise, as well as their Production, are Carried On in Europe by Entrepreneurs, and at a Risk." Thornton eds. (2010) further explained:
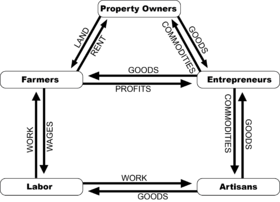
- Cantillon develops a circular-flow model of the economy that shows the distribution of farm production between property owners, farmers, and workers. Farm production is exchanged for the goods and services produced in the cities by entrepreneurs and artisans. While the property owners are “independent,” the model demonstrates the mutual interdependence between all the classes of people that Adam Smith dubbed the “invisible hand” in The Theory of Moral Sentiments (1759).[7]
Cantillon distinguished at least five types of economic agents: property owners, farmers, entrepreneurs, labors and artisans, as expressed in the contemporary diagram of the Cantillon’s Circular Flow Economy.[5]
Quesnay
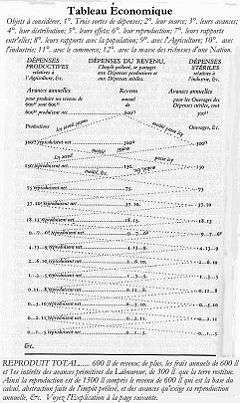
François Quesnay further developed these concepts, and was the first to visualize these interactions over time in the so-called Tableau économique.[3] Quesnay believed that trade and industry were not sources of wealth, and instead in his 1758 book Tableau économique (Economic Table) argued that agricultural surpluses, by flowing through the economy in the form of rent, wages, and purchases were the real economic movers, for two reasons.
- First, regulation impedes the flow of income throughout all social classes and therefore economic development.
- Second, taxes on the productive classes such as farmers should be reduced in favor of higher taxes for unproductive classes such as landowners, since their luxurious way of life distorts the income flow.
The model Quesnay created consisted of three economic agents: The "Proprietary" class consisted of only landowners. The "Productive" class consisted of all agricultural laborers. The "Sterile" class is made up of artisans and merchants. The flow of production and/or cash between the three classes started with the Proprietary class because they own the land and they buy from both of the other classes. Quesnay visualised the steps in the process in the Tableau économique.
Marx
In Marxian economics, economic reproduction refers to recurrent (or cyclical) processes[8] by which the initial conditions necessary for economic activity to occur are constantly re-created.[9]
Economic reproduction involves the physical production and distribution of goods and services, the trade (the circulation via exchanges and transactions) of goods and services, and the consumption of goods and services (both productive or intermediate consumption and final consumption).
Karl Marx developed the original insights of Quesnay to model the circulation of capital, money, and commodities in the second volume of Das Kapital to show how the reproduction process that must occur in any type of society can take place in capitalist society by means of the circulation of capital.[10]
Marx distinguishes between "simple reproduction" and "expanded (or enlarged) reproduction".[11] In the former case, no economic growth occurs, while in the latter case, more is produced than is needed to maintain the economy at the given level, making economic growth possible. In the capitalist mode of production, the difference is that in the former case, the new surplus value created by wage-labour is spent by the employer on consumption (or hoarded), whereas in the latter case, part of it is reinvested in production.
Further developments
An important development was John Maynard Keynes' 1933 publication of the General Theory of Employment, Interest and Money. Keynes' assistant Richard Stone further developed the concept for the United Nations (UN) and the Organisation for Economic Co-operation and Development to the systems, which is now used internationally.
The first to visualize the modern circular flow of income model was Frank Knight in 1933 publication of The Economic Organization.[12] Knight (1933) explained:
- [we may view the] economic organization as a system of prize relations. Seen in the large, free enterprise is an organization of production and distribution in which individuals or family units get their real income, their "living," by selling productive power for money to "business units" or "enterprises", and buying with the money income thus obtained the direct goods and services which they consume. This view, it will be remembered, ignores for the sake of simplicity the fact that an appreciable fraction of the productive power in use at any time is not really employed in satisfying current wants but to make provision for increased want-satisfaction in the future; it treats society as it would be, or would tend to become, with progress absent, or in a “static” state.[13]
Knight pictured a circulation of money and circulation of economic value between people (individuals, families) and business enterprises as a group,[14] explaining: "The general character of an enterprise system, reduced to its very simplest terms, can be illustrated by a diagram showing the exchange of productive power for consumption goods between individuals and business units, mediated by the circulation of money, and suggesting the familiar figure of the wheel of wealth."[15]
Types of models
Two sector model
In the basic circular flow of income, or two sector circular flow of income model, the state of equilibrium is defined as a situation in which there is no tendency for the levels of income (Y), expenditure (E) and output (O) to change, that is:
Y = E = O

This means that the expenditure of buyers (households) becomes income for sellers (firms). The firms then spend this income on factors of production such as labour, capital and raw materials, "transferring" their income to the factor owners. The factor owners spend this income on goods which leads to a circular flow of income.
This basic circular flow of income model consists of six assumptions:
- The economy consists of two sectors: households and firms.
- Households spend all of their income (Y) on goods and services or consumption (C). There is no saving (S).
- All output (O) produced by firms is purchased by households through their expenditure (E).
- There is no financial sector.
- There is no government sector.
- There is no foreign sector
Three sector model
It includes household sector, producing sector and government sector. It will study a circular flow income in these sectors excluding rest of the world i.e. closed economy income. Here flows from household sector and producing sector to government sector are in the form of taxes. The income received from the government sector flows to producing and household sector in the form of payments for government purchases of goods and services as well as payment of subsides and transfer payments. Every payment has a receipt in response of it by which aggregate expenditure of an economy becomes identical to aggregate income and makes this circular flow unending.
Four sector model
A modern monetary economy comprises a network of four sector economy these are:
- Household sector
- Firms or Producing sector
- Government sector
- Rest of the world sector.
Each of the above sectors receives some payments from the other in lieu of goods and services which makes a regular flow of goods and physical services. Money facilitates such an exchange smoothly. A residual of each market comes in capital market as saving which inturn is invested in firms and government sector. Technically speaking, so long as lending is equal to the borrowing i.e. leakage is equal to injections, the circular flow will continue indefinitely. However this job is done by financial institutions in the economy.
Five sector model

In the five sector model the economy is divided into five sectors:[16]
- Household sector
- Firms or Producing sector
- Financial sector : banks and non-bank intermediaries who engage in the borrowing (savings from households) and lending of money
- Government sector : consists of the economic activities of local, state and federal governments.
- Rest of the world sector: transforms the model from a closed economy to an open economy.
The five sector model of the circular flow of income is a more realistic representation of the economy. Unlike the two sector model where there are six assumptions the five sector circular flow relaxes all six assumptions. Since the first assumption is relaxed there are three more sectors introduced.
Circular flow of income topics
Leakage and injections
In the five sector model the economy there is leakage and injections
- Leakage means withdrawal from the flow. When households and firms save part of their incomes it constitutes leakage. They may be in form of savings, tax payments, and imports. Leakages reduce the flow of income.
- Injection means introduction of income into the flow. When households and firms borrow the savings, they constitute injections. Injections increase the flow of income. Injections can take the forms of investment, government spending and exports. As long as leakages are equal to injections circular flow of income continues indefinitely. Financial institutions or capital market play the role of intermediaries. This means that income individuals receive from businesses and the goods and services that are sold to them do not count as injections or leakages, as no new money is being introduced to the flow and no money is being taken out of the flow.
Leakage and injections can occur in the financial sector, government sector and overseas sector:
- In the financial sector
In terms of the circular flow of income model the leakage that financial institutions provide in the economy is the option for households to save their money. This is a leakage because the saved money can not be spent in the economy and thus is an idle asset that means not all output will be purchased. The injection that the financial sector provides into the economy is investment (I) into the business/firms sector. An example of a group in the finance sector includes banks such as Westpac or financial institutions such as Suncorp.
- In the government sector
The leakage that the Government sector provides is through the collection of revenue through Taxes (T) that is provided by households and firms to the government. For this reason they are a leakage because it is a leakage out of the current income thus reducing the expenditure on current goods and services. The injection provided by the government sector is Government spending (G) that provides collective services and welfare payments to the community. An example of a tax collected by the government as a leakage is income tax and an injection into the economy can be when the government redistributes this income in the form of welfare payments, that is a form of government spending back into the economy.
- In the overseas sector
The main leakage from this sector are imports (M), which represent spending by residents into the rest of the world. The main injection provided by this sector is the exports of goods and services which generate income for the exporters from overseas residents. An example of the use of the overseas sector is Australia exporting wool to China, China pays the exporter of the wool (the farmer) therefore more money enters the economy thus making it an injection. Another example is China processing the wool into items such as coats and Australia importing the product by paying the Chinese exporter; since the money paying for the coat leaves the economy it is a leakage.
- Summary of leakage and injections
LEAKAGES INJECTION Saving (S) Investment (I) Taxes (T) Government Spending (G) Imports (M) Exports (X)
- Table 1 All leakages and injections in five sector model
The state of equilibrium
In terms of the five sector circular flow of income model the state of equilibrium occurs when the total leakages are equal to the total injections that occur in the economy. This can be shown as:
OR
S + T + M = I + G + X.This can be further illustrated through the fictitious economy of Martinland where:
S + T + M = I + G + X
$100 + $150 + $50 = $50 + $100 + $150
$300 = $300
Therefore, since the leakages are equal to the injections the economy is in a stable state of equilibrium. This state can be contrasted to the state of disequilibrium where unlike that of equilibrium the sum of total leakages does not equal the sum of total injections. By giving values to the leakages and injections the circular flow of income can be used to show the state of disequilibrium. Disequilibrium can be shown as:
Therefore, it can be shown as one of the below equations where:
$150 (S) + $250 (T) + $150 (M) > $75 (I) + $200 (G) + $150 (X)
Or
Total Leakages < Total injections
$50 (S) + $200 (T) + $125 (M) < $75 (I) + $200 (G) + $150 (X)The effects of disequilibrium vary according to which of the above equations they belong to.
If S + T + M > I + G + X the levels of income, output, expenditure and employment will fall causing a recession or contraction in the overall economic activity. But if S + T + M < I + G + X the levels of income, output, expenditure and employment will rise causing a boom or expansion in economic activity.

To manage this problem, if disequilibrium were to occur in the five sector circular flow of income model, changes in expenditure and output will lead to equilibrium being regained. An example of this is if:
S + T + M > I + G + X the levels of income, expenditure and output will fall causing a contraction or recession in the overall economic activity. As the income falls households will cut down on all leakages such as saving, they will also pay less in taxation and with a lower income they will spend less on imports. This will lead to a fall in the leakages until they equal the injections and a lower level of equilibrium will be the result.
The other equation of disequilibrium, if S + T + M < I + G + X in the five sector model the levels of income, expenditure and output will greatly rise causing a boom in economic activity. As the households income increases there will be a higher opportunity to save therefore saving in the financial sector will increase, taxation for the higher threshold will increase and they will be able to spend more on imports. In this case when the leakages increase they wisituation will be a higher level of equilibrium.
Difference between real flow and money flow
- Real flow is the exchange of goods and services between household and firms whereas money flow is the monetary exchange between two sectors.
- In real flow household sector supplies raw material, land, labour, capital and enterprise to firms and in return firms sector provides finished goods and services to household sector. Whereas in money flow, firm sector gives remuneration in the form of money to household sector a wages and salaries, rent, interest etc.
- Difficulties of barter system for the exchange of goods and factor services between households and firms sector in real flow, whereas no such difficulty or inconvenience arise in money flow.
- When goods and services flow from one sector of the economy to another, it is known as real flow.
Phases or stages of circular flow of income
Production, consumption expenditure and generation of income are the three basic economic activities of an economy that go on endlessly and are titled as circular flow of income. Production gives rise to income, income gives rise to demand for goods and services ; such a demand gives rise to expenditure and expenditure induces for further production. The whole process forms the basis for circular flow of income and related activities- production, income and expenditure are known as phases or stages of circular flow of income.
Significance of study of circular flow of income
The book A General Approach to Macroeconomic Policy [17] identifies four possible areas of significance:
- Measurement of National Income - National income is an estimation of aggregation of any of economic activity of the circular flow. It is either the income of all the factors of production or the expenditure of various sectors of economy. However, aggregate amount of each of the activity is identical to each other.
- Knowledge of Interdependence - Circular flow of income signifies the interdependence of each of activity upon one another. If there is no consumption, there will be no demand and expenditure which in fact restricts the amount of production and income.
- Unending Nature of Economic Activities - It signifies that production, income and expenditure are of unending nature, therefore, economic activities in an economy can never come to a halt. National income is also bound to rise in future.
- Injections and Leakages
See also
References
- ↑ Daraban, Bogdan. "Introducing the Circular Flow Diagram to Business Students." Journal of Education for Business 85.5 (2010): 274-279.
- 1 2 Antoin E. Murphy. "John Law and Richard Cantillon on the circular flow of income." Journal of the History of Economic Thought. 1.1 (1993): 47-62.
- 1 2 Backhouse, Roger E., and Yann Giraud. "Circular flow diagrams." in: Famous Figures and Diagrams in Economics (2010): 221-230. Chapter 23.
- 1 2 3 4 Measuring the Economy : A Primer on GDP and the National Income and Product Accounts, by Bureau of Economic Analysis (BEA), U.S. Department of Commerce, October 2014.
- 1 2 Cantillon 2010, p. 66
- ↑ Aspromourgos, Tony. "'Political economy and the social division of labour: the economics of Sir William Petty." Scottish Journal of Political Economy 33.1 (1986): 28-45.
- ↑ Cantillon 2010, p. 69: Abstract of chapter 12.
- ↑ In a recurrent process, the same event repeats itself on multiple occasions. In a cyclical process, a sequence of events repeats itself on a regular basis.
- ↑ Michel Aglietta, introduction to Aglietta, A theory of capitalist regulation. London: NLB, 1979.
- ↑ Karl Marx, Capital, Volume II. Penguin Classics, 1992.
- ↑ Karl Marx, Capital, Volume I. Penguin Classics, 1990, chapter 23 and Capital, Volume II. Penguin Classics, 1992, chapter 20 and 21.
- ↑ Patinkin, Don (December 1973). "In Search of the" Wheel of Wealth": On the Origins of Frank Knight's Circular-Flow Diagram". The American Economic Review. 63 (5): 1037–1046. JSTOR 1813935. (registration required (help)).
- ↑ Frank Knight. The Economic Organization, 1933. p.59-60
- ↑ Knight (1933, p. 61)
- ↑ Knight (1933, p. 60)
- ↑ Jeremy Buultjens, Excel Preliminary Economics, Pascal Press, 2000. p. 10
- ↑ A General Approach to Macroeconomic Policy.
- Attribution
This article incorporates text from Bureau of Economic Analysis. Measuring the Economy : A Primer on GDP and the National Income and Product Accounts, 2014, a publication now in the public domain.
Further reading
- Backhouse, Roger E., and Yann Giraud. "Circular flow diagrams." in: Famous Figures and Diagrams in Economics (2010): 221-230. Chapter 23.
- Richard Cantillon, Chantal Saucier (translation) & Mark Thornton (editor) (2010) [1755]. An Essay on Economic Theory. Auburn, Alabama: Ludwig von Mises Institute. ISBN 0-415-07577-7.
- Daraban, Bogdan. "Introducing the Circular Flow Diagram to Business Students." Journal of Education for Business 85.5 (2010): 274-279.
- Mankiw, Gregory (2011). Principles of Economics, 6th edition. Thomson Europe.
- Marks, Melanie, and Gemma Kotula. "Using the circular flow of income model to teach economics in the middle school classroom." The Social Studies 100.5 (2009): 233-242.
- Lloyd A. Metzler. “Three Lags in the Circular Flow of Income”, in: Income, Employment and Public; essays in honor of Alvin H. Hansen, Lloyd A Metzler; New York, W.W. Norton [1948]. pp. 11–32
- Antoin E. Murphy. "John Law and Richard Cantillon on the circular flow of income." Journal of the History of Economic Thought. 1.1 (1993): 47-62.
- Sloman, John (1999). Economics, 3rd edition. Prentice Economics. Europe: Prentice-Hall. ISBN 0-273-65574-4.
External links
| Wikimedia Commons has media related to Economic circular flow diagrams. |
- Circular Flow, The Economic Lowdown Video Series at stlouisfed.org/