Chemical industry
The chemical industry comprises the companies that produce industrial chemicals. Central to the modern world economy, it converts raw materials (oil, natural gas, air, water, metals, and minerals) into more than 70,000 different products.
The plastics industry contains some overlap, as most chemical companies produce plastic as well as other chemicals.
History
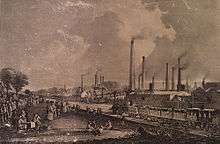
Although chemicals were made and used throughout history, the birth of the heavy chemical industry (production of chemicals in large quantities for a variety of uses) coincided with the beginnings of the Industrial Revolution in general.
Industrial Revolution
One of the first chemicals to be produced in large amounts through industrial process was sulfuric acid. In 1736, the pharmacist Joshua Ward developed a process for its production that involved heating saltpeter, allowing the sulfur to oxidize and combine with water. It was the first practical production of sulfuric acid on a large scale. John Roebuck and Samuel Garbett were the first to establish a large-scale factory in Prestonpans, Scotland, in 1749, which used leaden condensing chambers for the manufacture of sulfuric acid.[1][2]
In the early 18th century, cloth was bleached by treating it with stale urine or sour milk and exposing it to sunlight for long periods of time, which created a severe bottleneck in production. Sulfuric acid began to be used as a more efficient agent as well as lime by the middle of the century, but it was the discovery of bleaching powder by Charles Tennant that spurred the creation of the first great chemical industrial enterprise. His powder was made by reacting chlorine with dry slaked lime and proved to be a cheap and successful product. He opened a factory in St Rollox, north of Glasgow, and production went from just 52 tons in 1799 to almost 10,000 tons just five years later.[3]
Soda ash was used since ancient times in the production of glass, textile, soap, and paper, and the source of the potash had traditionally been wood ashes in Western Europe. By the 18th century, this source was becoming uneconomical due to deforestation, and the French Academy of Sciences offered a prize of 2400 livres for a method to produce alkali from sea salt (sodium chloride). The Leblanc process was patented in 1791 by Nicolas Leblanc who then built a Leblanc plant at Saint-Denis.[4] He was denied his prize money because of the French Revolution.[5]
However, it was in Britain that the Leblanc process really took off.[5] William Losh built the first soda works in Britain at the Losh, Wilson and Bell works on the River Tyne in 1816, but it remained on a small scale due to large tariffs on salt production until 1824. When these tariffs were repealed, the British soda industry was able to rapidly expand. James Muspratt's chemical works in Liverpool and Charles Tennant's complex near Glasgow became the largest chemical production centres anywhere. By the 1870s, the British soda output of 200,000 tons annually exceeded that of all other nations in the world combined.

These huge factories began to produce a greater diversity of chemicals as the Industrial Revolution matured. Originally, large quantities of alkaline waste were vented into the environment from the production of soda, provoking one of the first pieces of environmental legislation to be passed in 1863. This provided for close inspection of the factories and imposed heavy fines on those exceeding the limits on pollution. Methods were soon devised to make useful byproducts from the alkali.
The Solvay process was developed by the Belgian industrial chemist Ernest Solvay in 1861. In 1864, Solvay and his brother Alfred constructed a plant in the Belgian town of Charleroi and in 1874, they expanded into a larger plant in Nancy, France. The new process proved more economical and less polluting than the Leblanc method, and its use spread. In the same year, Ludwig Mond visited Solvay to acquire the rights to use his process, and he and John Brunner formed the firm of Brunner, Mond & Co., and built a Solvay plant at Winnington, England. Mond was instrumental in making the Solvay process a commercial success; he made several refinements between 1873 and 1880 that removed byproducts that could slow or halt the mass production of sodium carbonate through use of the process.
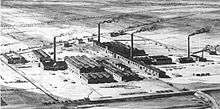
Expansion and maturation
The late 19th century saw an explosion in both the quantity of production and the variety of chemicals that were manufactured. Large chemical industries also took shape in Germany and later in the United States.
Production of artificial manufactured fertilizer for agriculture was pioneered by Sir John Lawes at his purpose-built Rothamsted Research facility. In the 1840s he established large works near London for the manufacture of superphosphate of lime. Processes for the vulcanization of rubber were patented by Charles Goodyear in the United States and Thomas Hancock in England in the 1840s. The first synthetic dye was discovered by William Henry Perkin in London. He partly transformed aniline into a crude mixture which, when extracted with alcohol, produced a substance with an intense purple colour. He also developed the first synthetic perfumes. However, it was German industry that quickly began to dominate the field of synthetic dyes. The three major firms BASF, Bayer and Hoechst produced several hundred different dyes, and by 1913, the German industry produced almost 90 percent of the world supply of dyestuffs and sold about 80 percent of their production abroad.[6] In the United States, Herbert Henry Dow's use of electrochemistry to produce chemicals from brine was a commercial success that helped to promote the country's chemical industry.[7]
The petrochemical industry can be traced back to the oil works of James Young in Scotland and Abraham Pineo Gesner in Canada. The first plastic was invented by Alexander Parkes, an English metallurgist. In 1856, he patented Parkesine, a celluloid based on nitrocellulose treated with a variety of solvents.[8] This material, exhibited at the 1862 London International Exhibition, anticipated many of the modern aesthetic and utility uses of plastics. The industrial production of soap from vegetable oils was started by William Lever and his brother James in 1885 in Lancashire based on a modern chemical process invented by William Hough Watson that used glycerin and vegetable oils.[9]
By the 1920s, chemical firms consolidated into large conglomerates; IG Farben in Germany, Rhône-Poulenc in France and Imperial Chemical Industries in Britain. Dupont became a major chemicals firm in the early 20th century in America.
Currently chemical production is a high-tech industry, where the competitiveness is more based on capacity in investment on research and development than the labour cost.[10]
Products
Polymers and plastics, especially polyethylene, polypropylene, polyvinyl chloride, polyethylene terephthalate, polystyrene and polycarbonate comprise about 80% of the industry’s output worldwide. These materials are often converted to fluoropolymer tubing products and used by the industry to transport highly corrosive materials.[11] Chemicals are used to make a wide variety of consumer goods, as well as thousands of inputs to agriculture, manufacturing, construction, and service industries. The chemical industry itself consumes 26 percent of its own output. Major industrial customers include rubber and plastic products, textiles, apparel, petroleum refining, pulp and paper, and primary metals. Chemicals are nearly a $3 trillion global enterprise, and the EU and U.S. chemical companies are the world's largest producers.
Sales of the chemical business can be divided into a few broad categories, including basic chemicals (about 35 to 37 percent of the dollar output), life sciences (30 percent), specialty chemicals (20 to 25 percent) and consumer products (about 10 percent).[12]
Basic chemicals & Commodity Chemicals to Polymers and Speciality Chemicals

Basic chemicals, or "commodity chemicals" are a broad chemical category including polymers, bulk petrochemicals and intermediates, other derivatives and basic industrials, inorganic chemicals, and fertilizers. Typical growth rates for basic chemicals are about 0.5 to 0.7 times GDP. Product prices are generally less than fifty cents per pound.
Polymers, the largest revenue segment at about 33 percent of the basic chemicals dollar value, includes all categories of plastics and man-made fibers. The major markets for plastics are packaging, followed by home construction, containers, appliances, pipe, transportation, toys, and games.
- The largest-volume polymer product, polyethylene (PE), is used mainly in packaging films and other markets such as milk bottles, containers, and pipe.
- Polyvinyl chloride (PVC), another large-volume product, is principally used to make pipe for construction markets as well as siding and, to a much smaller extent, transportation and packaging materials.
- Polypropylene (PP), similar in volume to PVC, is used in markets ranging from packaging, appliances, and containers to clothing and carpeting.
- Polystyrene (PS), another large-volume plastic, is used principally for appliances and packaging as well as toys and recreation.
- The leading man-made fibers include polyester, nylon, polypropylene, and acrylics, with applications including apparel, home furnishings, and other industrial and consumer use.
The principal raw materials for polymers are bulk petrochemicals.
Chemicals in the bulk petrochemicals and intermediates are primarily made from liquefied petroleum gas (LPG), natural gas, and crude oil. Their sales volume is close to 30 percent of overall basic chemicals. Typical large-volume products include ethylene, propylene, benzene, toluene, xylenes, methanol, vinyl chloride monomer (VCM), styrene, butadiene, and ethylene oxide. These basic or commodity chemicals are the starting materials used to manufacture many polymers and other more complex organic chemicals particularly those that are made for use in the specialty chemicals category (see below).
Other derivatives and basic industrials include synthetic rubber, surfactants, dyes and pigments, turpentine, resins, carbon black, explosives, and rubber products and contribute about 20 percent of the basic chemicals' external sales.
Inorganic chemicals (about 12 percent of the revenue output) make up the oldest of the chemical categories. Products include salt, chlorine, caustic soda, soda ash, acids (such as nitric acid, phosphoric acid, and sulfuric acid), titanium dioxide, and hydrogen peroxide.
Fertilizers are the smallest category (about 6 percent) and include phosphates, ammonia, and potash chemicals.
Life sciences
Life sciences (about 30 percent of the dollar output of the chemistry business) include differentiated chemical and biological substances, pharmaceuticals, diagnostics, animal health products, vitamins, and pesticides. While much smaller in volume than other chemical sectors, their products tend to have very high prices—over ten dollars per pound—growth rates of 1.5 to 6 times GDP, and research and development spending at 15 to 25 percent of sales. Life science products are usually produced with very high specifications and are closely scrutinized by government agencies such as the Food and Drug Administration. Pesticides, also called "crop protection chemicals", are about 10 percent of this category and include herbicides, insecticides, and fungicides.
Specialty chemicals
Specialty chemicals are a category of relatively high valued, rapidly growing chemicals with diverse end product markets. Typical growth rates are one to three times GDP with prices over a dollar per pound. They are generally characterized by their innovative aspects. Products are sold for what they can do rather than for what chemicals they contain. Products include electronic chemicals, industrial gases, adhesives and sealants as well as coatings, industrial and institutional cleaning chemicals, and catalysts. In 2012, excluding fine chemicals, the $546 billion global speciality chemical market was 33% Paints, Coating and Surface Treatments, 27% Advanced Polymer, 14% Adhesives and Sealants, 13% additives and 13% pigments and inks.[13]
Speciality chemicals are sold as effect or performance chemicals. Sometimes they are mixtures of formulations, unlike "fine chemicals," which are almost always single-molecule products.
Consumer products
Consumer products include direct product sale of chemicals such as soaps, detergents, and cosmetics. Typical growth rates are 0.8 to 1.0 times GDP.
Consumers rarely if ever come into contact with basic chemicals but polymers and speciality chemicals are the materials that they will encounter everywhere in their everyday lives, such as in plastics, cleaning materials, cosmetics, paints & coatings, electronic gadgets, automobiles and the materials used to construct their homes.[14] These speciality products are marketed by chemical companies to the downstream manufacturing industries as pesticides, speciality polymers, electronic chemicals, surfactants, construction chemicals, Industrial Cleaners, flavours and fragrances, speciality coatings, printing inks, water-soluble polymers, food additives, paper chemicals, oil field chemicals, plastic adhesives, adhesives and sealants, cosmetic chemicals, water management chemicals, catalysts, textile chemicals. Chemical companies rarely supply these products directly to the consumer.
Every year, the American Chemistry Council tabulates the U.S. production volume of the top 100 basic chemicals. In 2000, the aggregate production volume of the top 100 chemicals totalled 502 million tons, up from 397 million tons in 1990. Inorganic chemicals tend to be the largest volume, though much smaller in dollar revenue terms due to their low prices. The top 11 of the 100 chemicals in 2000 were sulfuric acid (44 million tons), nitrogen (34), ethylene (28), oxygen (27), lime (22), ammonia (17), propylene (16), polyethylene (15), chlorine (13), phosphoric acid (13) and diammonium phosphates (12).
Companies
The largest chemical producers today are global companies with international operations and plants in numerous countries. A list of the top 25 chemical companies by chemical sales in 2015 appears below. (Note: Chemical sales represent only a portion of total sales for some companies.)
Top chemical companies by chemical sales in 2015.[15]
Technology
From the perspective of chemical engineers, the chemical industry involves the use of chemical processes such as chemical reactions and refining methods to produce a wide variety of solid, liquid, and gaseous materials. Most of these products serve to manufacture other items, although a smaller number go directly to consumers. Solvents, pesticides, lye, washing soda, and portland cement provide a few examples of product used by consumers.
The industry includes manufacturers of inorganic- and organic-industrial chemicals, ceramic products, petrochemicals, agrochemicals, polymers and rubber (elastomers), oleochemicals (oils, fats, and waxes), explosives, fragrances and flavors. Examples of these products are shown in the Table below.
| Product Type | Examples |
|---|---|
| inorganic industrial | ammonia, chlorine, sodium hydroxide, sulfuric acid, nitric acid |
| organic industrial | acrylonitrile, phenol, ethylene oxide, urea |
| ceramic products | silica brick, frit |
| petrochemicals | ethylene, propylene, benzene, styrene |
| agrochemicals | fertilizers, insecticides, herbicides |
| polymers | polyethylene, Bakelite, polyester |
| elastomers | polyisoprene, neoprene, polyurethane |
| oleochemicals | lard, soybean oil, stearic acid |
| explosives | nitroglycerin, ammonium nitrate, nitrocellulose |
| fragrances and flavors | benzyl benzoate, coumarin, vanillin |
| industrial gases | nitrogen, oxygen, acetylene, nitrous oxide |
Although the pharmaceutical industry is often considered a chemical industry , it has many different characteristics that puts it in a separate category. Other closely related industries include petroleum, glass, paint, ink, sealant, adhesive, and food processing manufacturers.
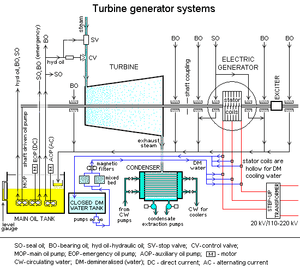
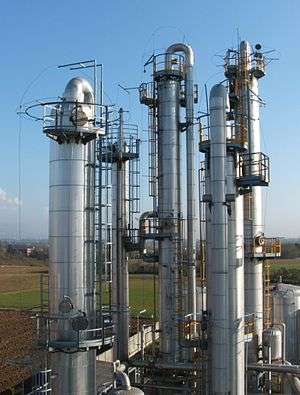
Chemical processes such as chemical reactions operate in chemical plants to form new substances in various types of reaction vessels. In many cases the reactions take place in special corrosion-resistant equipment at elevated temperatures and pressures with the use of catalysts. The products of these reactions are separated using a variety of techniques including distillation especially fractional distillation, precipitation, crystallization, adsorption, filtration, sublimation, and drying.
The processes and product or products are usually tested during and after manufacture by dedicated instruments and on-site quality control laboratories to ensure safe operation and to assure that the product will meet required specifications. More organizations within the industry are implementing chemical compliance software to maintain quality products and manufacturing standards.[16] The products are packaged and delivered by many methods, including pipelines, tank-cars, and tank-trucks (for both solids and liquids), cylinders, drums, bottles, and boxes. Chemical companies often have a research-and-development laboratory for developing and testing products and processes. These facilities may include pilot plants, and such research facilities may be located at a site separate from the production plant(s).
World Chemical Production
The scale of chemical manufacturing tends to be organized from largest in volume (petrochemicals and commodity chemicals), to specialty chemicals, and the smallest, fine chemicals.
The petrochemical and commodity chemical manufacturing units are on the whole single product continuous processing plants. Not all petrochemical or commodity chemical materials are made in one single location, but groups of related materials often are to induce industrial symbiosis as well as material, energy and utility efficiency and other economies of scale.
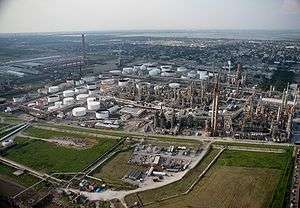
Those chemicals made on the largest of scales are made in a few manufacturing locations around the world, for example in Texas and Louisiana along the Gulf Coast of the United States, on Teesside in the Northeast of England in the United Kingdom, and in Rotterdam in the Netherlands. The large scale manufacturing locations often have clusters of manufacturing units that share utilities and large scale infrastructure such as power stations, port facilities, road and rail terminals. To demonstrate the clustering and integration mentioned above, some 50% of the United Kingdom's petrochemical and commodity chemicals are produced by the Northeast of England Process Industry Cluster on Teesside.
Specialty chemical and fine chemical manufacturing are mostly made in discrete batch processes. These manufacturers are often found in similar locations but in many cases they are to be found in multi sector business parks.
Continents and Countries
In the U.S. there are 170 major chemical companies. They operate internationally with more than 2,800 facilities outside the U.S. and 1,700 foreign subsidiaries or affiliates operating. The U.S. chemical output is $750 billion a year. The U.S. industry records large trade surpluses and employs more than a million people in the United States alone. The chemical industry is also the second largest consumer of energy in manufacturing and spends over $5 billion annually on pollution abatement.
In Europe the chemical, plastics and rubber sectors are among the largest industrial sectors. Together they generate about 3.2 million jobs in more than 60,000 companies. Since 2000 the chemical sector alone has represented 2/3 of the entire manufacturing trade surplus of the EU.
in 2012 The chemical sector accounted for 12% of the EU manufacturing industry's added value. Europe remains world’s biggest chemical trading region with 43% of the world’s exports and 37%of the world’s imports, although the latest data shows that Asia is catching up with 34% of the exports and 37% of imports.[17] Even so, Europe still has a trading surplus with all regions of the world except Japan and China where in 2011 there was a chemical trade balance. Europe’s trade surplus with the rest of the world today amounts to 41.7 billion Euros.[18]
Over the 20 years between 1991 and 2011 the European Chemical industry saw its sales increase 295 billion Euros to 539 billion Euros a picture of constant growth. Despite this the European industry’s share of the world chemical market has fallen from 36% to 20%. This has resulted from the huge increase production and sales in the emerging markets like India and China.[19] The data suggest that 95% of this impact is from China alone. In 2012 the data from the European Chemical Industry Council (CEFIC)shows that 5 European countries account for 71% of the EU's chemicals sales. These are Germany, France, United Kingdom, Italy and the Netherlands.[20]
The chemical industry has shown rapid growth for more than fifty years. The fastest-growing areas have involved the manufacture of synthetic organic polymers used as plastics, fibres and elastomers. Historically and presently the chemical industry has been concentrated in three areas of the world, Western Europe, North America and Japan (the Triad). The European Community remains the largest producer area followed by the US and Japan.
The traditional dominance of chemical production by the Triad countries is being challenged by changes in feedstock availability and price, labour cost, energy cost, differential rates of economic growth and environmental pressures. Instrumental in the changing structure of the global chemical industry has been the growth in China, India, Korea, the Middle East, South East Asia, Nigeria, and Brazil.
Just as companies emerge as the main producers of the chemical industry, we can also look on a more global scale to how industrialized countries rank, with regards to the billions of dollars worth of production a country or region could export. Though the business of chemistry is worldwide in scope, the bulk of the world’s $3.7 trillion chemical output is accounted for by only a handful of industrialized nations. The United States alone produced $689 billion, 18.6 percent of the total world chemical output in 2008.[21]
| Global Chemical Shipments by Country/Region (billions of dollars)[21] | 1998 | 1999 | 2000 | 2001 | 2002 | 2003 | 2004 | 2005 | 2006 | 2008 | 2009 |
|---|---|---|---|---|---|---|---|---|---|---|---|
| United States of America | 416.7 | 420.3 | 449.2 | 438.4 | 462.5 | 487.7 | 540.9 | 610.9 | 657.7 | 664.1 | 689.3 |
| Canada | 21.1 | 21.8 | 25.0 | 24.8 | 25.8 | 30.5 | 36.2 | 40.2 | 43.7 | 45.4 | 47.4 |
| Mexico | 19.1 | 21.0 | 23.8 | 24.4 | 24.3 | 23.5 | 25.6 | 29.2 | 32.0 | 33.4 | 37.8 |
| North America | 456.9 | 463.1 | 498.0 | 487.6 | 512.6 | 541.7 | 602.7 | 680.3 | 733.4 | 742.8 | 774.6 |
| Brazil | 46.5 | 40.0 | 45.7 | 41.5 | 39.6 | 47.4 | 60.2 | 71.1 | 82.8 | 96.4 | 126.7 |
| Other | 59.2 | 58.1 | 60.8 | 63.4 | 58.6 | 62.9 | 69.9 | 77.2 | 84.6 | 89.5 | 102.1 |
| Latin America | 105.7 | 98.1 | 106.5 | 104.9 | 98.2 | 110.3 | 130.0 | 148.3 | 167.4 | 185.9 | 228.8 |
| France | 79.1 | 78.5 | 76.5 | 76.8 | 80.5 | 99.6 | 111.1 | 117.5 | 121.3 | 138.4 | 158.9 |
| Germany | 124.9 | 123.2 | 118.9 | 116.1 | 120.1 | 148.1 | 168.6 | 178.6 | 192.5 | 229.5 | 263.2 |
| Italy | 63.9 | 64.6 | 59.5 | 58.6 | 64.5 | 75.8 | 86.6 | 89.8 | 95.3 | 105.9 | 122.9 |
| United Kingdom | 70.3 | 70.1 | 66.8 | 66.4 | 69.9 | 77.3 | 91.3 | 95.2 | 107.8 | 118.2 | 123.4 |
| Belgium | 27.1 | 27.0 | 27.5 | 27.1 | 28.7 | 36.1 | 41.8 | 43.5 | 46.9 | 51.6 | 62.6 |
| Ireland | 16.9 | 20.1 | 22.6 | 22.9 | 29.1 | 32.3 | 33.9 | 34.9 | 37.5 | 46.0 | 54.8 |
| Netherlands | 29.7 | 29.4 | 31.3 | 30.6 | 32.2 | 40.1 | 49.0 | 52.7 | 59.2 | 67.9 | 81.7 |
| Spain | 31.0 | 30.8 | 30.8 | 31.9 | 33.4 | 42.0 | 48.9 | 52.7 | 56.7 | 63.7 | 74.8 |
| Sweden | 11.1 | 11.4 | 11.2 | 11.0 | 12.5 | 15.9 | 18.2 | 19.3 | 21.2 | 21.2 | 22.6 |
| Switzerland | 22.1 | 22.2 | 19.4 | 21.1 | 25.5 | 30.3 | 33.8 | 35.4 | 37.8 | 42.7 | 53.1 |
| Other | 27.1 | 26.8 | 25.9 | 26.4 | 27.9 | 33.5 | 38.6 | 42.9 | 46.2 | 50.3 | 58.9 |
| Western Europe | 503.1 | 504.0 | 490.4 | 488.8 | 524.4 | 630.9 | 721.9 | 762.7 | 822.4 | 935.4 | 1,076.8 |
| Russia | 23.8 | 24.6 | 27.4 | 29.1 | 30.3 | 33.4 | 37.5 | 40.9 | 53.1 | 63.0 | 77.6 |
| Other | 22.3 | 20.3 | 21.9 | 23.4 | 25.3 | 31.4 | 39.6 | 46.2 | 55.0 | 68.4 | 87.5 |
| Central/Eastern Europe | 46.1 | 44.9 | 49.3 | 52.5 | 55.6 | 64.8 | 77.1 | 87.1 | 108.0 | 131.3 | 165.1 |
| Africa & Middle East | 52.7 | 53.2 | 59.2 | 57.4 | 60.4 | 73.0 | 86.4 | 99.3 | 109.6 | 124.2 | 160.4 |
| Japan | 193.8 | 220.4 | 239.7 | 208.3 | 197.2 | 218.8 | 243.6 | 251.3 | 248.5 | 245.4 | 298.0 |
| Asia-Pacific excluding Japan | 215.2 | 241.9 | 276.1 | 271.5 | 300.5 | 369.1 | 463.9 | 567.5 | 668.8 | 795.5 | 993.2 |
| China | 80.9 | 87.8 | 103.6 | 111.0 | 126.5 | 159.9 | 205.0 | 269.0 | 331.4 | 406.4 | 549.4 |
| India | 30.7 | 35.3 | 35.3 | 32.5 | 33.5 | 40.8 | 53.3 | 63.6 | 72.5 | 91.1 | 98.2 |
| Australia | 11.3 | 12.1 | 11.2 | 10.8 | 11.3 | 14.9 | 17.0 | 18.7 | 19.1 | 22.8 | 27.1 |
| Korea | 39.3 | 45.5 | 56.3 | 50.4 | 54.9 | 64.4 | 78.7 | 91.9 | 103.4 | 116.7 | 133.2 |
| Singapore | 6.3 | 8.5 | 9.5 | 9.4 | 12.5 | 16.1 | 20.0 | 22.0 | 25.8 | 28.9 | 31.6 |
| Taiwan | 21.9 | 23.7 | 29.2 | 26.8 | 28.4 | 34.3 | 44.5 | 49.5 | 53.8 | 57.4 | 62.9 |
| Other Asia/Pacific | 24.8 | 29.1 | 30.9 | 30.8 | 33.3 | 38.8 | 45.5 | 52.9 | 62.9 | 72.2 | 90.8 |
| Asia/Pacific | 409.0 | 462.3 | 515.7 | 479.7 | 497.7 | 587.8 | 707.5 | 818.8 | 917.3 | 1041.0 | 1291.2 |
| Total world shipments | 1573.5 | 1625.5 | 1719.0 | 1670.9 | 1748.8 | 2008.5 | 2325.6 | 2596.4 | 2858.1 | 3160.7 | 3696.8 |
See also
- Chemical engineering
- Chemical Leasing
- Pharmaceutical industry
- Industrial gas
- Prices of elements and their compounds
- Responsible Care
- fine chemicals
- speciality chemicals
- commodity chemicals
- petrochemicals
- Northeast of England Process Industry Cluster (NEPIC)
References
- ↑ Derry, Thomas Kingston; Williams, Trevor I. (1993). A Short History of Technology: From the Earliest Times to A.D. 1900. New York: Dover.
- ↑ Kiefer, David M. (2001). "Sulfuric Acid: Pumping Up the Volume". American Chemical Society. Retrieved 2008-04-21.
- ↑ "The Chemical Industries In The UK". American Chemical Society. Retrieved 2013-04-21.
- ↑ Aftalion, Fred (1991). A History of the International Chemical Industry. Philadelphia: University of Pennsylvania Press. pp. 11–13. ISBN 0-8122-1297-5.
- 1 2 Aftalion, Fred (1991). A History of the International Chemical Industry. Philadelphia: University of Pennsylvania Press. pp. 14–16. ISBN 0-8122-1297-5.
- ↑ Aftalion 1991, p. 104, Chandler 2004, p. 475
- ↑ "Electrolytic Production of Bromine - National Historic Chemical Landmark - American Chemical Society". American Chemical Society. Retrieved 2016-10-10.
- ↑ UK Patent office (1857). Patents for inventions. UK Patent office. p. 255.
- ↑ Jeannifer Filly Sumayku, Unilever: Providing Enjoyable and Meaningful Life to Customers, The President Post, 22 March 2010
- ↑ Centi, Gabriele (January 2012). "Resources and energy efficiency :the winning strategy for chemical industry" (PDF). La Chimica l'Industria. Società Chimica Italiana (1): 64–67.
- ↑ "PTFE Properties". Fluorotherm Polymers, Inc. Retrieved 31 October 2014.
- ↑ "Sectors of Chemical Industry". Technofunc. Retrieved 16 September 2013.
- ↑ Global Specialty Chemicals (PDF) (Report). =Marketline. May 2012. Retrieved 16 September 2012.
- ↑ Global Speciality Chemicals (PDF) (Report). MarketLine. May 2012.
- ↑ Tullo, Alexander H. "C&EN's Global Top 50 | July 25, 2016 Issue - Vol. 94 Issue 30 | Chemical & Engineering News". cen.acs.org. Retrieved 2016-10-10.
- ↑ "Chemical and Agrochemical Enterprise Quality Management Software". Sparta Systems, Inc. Retrieved 20 March 2015.
- ↑ "Facts and Figures 2012:The European chemicals industry in a worldwide perspective" (PDF). CEFIC. Retrieved 5 August 2013.
- ↑ Higgins, Stan (April 2013). "European Chemicals Industry:A review" (PDF). Chemical News. pp. 18–20.
- ↑ "Facts and Figures 2012:The European chemicals industry in a worldwide perspective" (PDF). CEFIC: 6. Retrieved 5 August 2013.
- ↑ "Facts and Figures 2012:The European chemicals industry in a worldwide perspective" (PDF). CEFIC: 7. Retrieved 5 August 2013.
- 1 2 "Global Business of Chemistry". Retrieved 26 February 2016.
- ‘World Of Chemicals’ is a chemical portal - a networking community for the chemical fraternity. http://www.worldofchemicals.com/
- Fred Aftalion A History of the International Chemical Industry. University of Pennsylvania Press. 1991. online version
- E. N. Brandt. Growth Company: Dow Chemical's First Century. Michigan State University Press. xxii+ 650 pp. Appendices, Select bibliography and index. ISBN 0-87013-426-4. online review
- Alfred D. Chandler. Shaping the Industrial Century: The Remarkable Story of the Evolution of the Modern Chemical and Pharmaceutical Industries. Harvard University Press, 2005. 366 pp. ISBN 0-674-01720-X. chapters 3-6 deal with DuPont, Dow Chemicals, Monsanto, American Cyanamid, Union Carbide, and Allied in US; and European chemical producers, Bayer, Farben, and ICI.
- Micheal McCoy, et al., "Facts & Figures of the Chemical Industry", Chemical & Engineering News, 84(28), July 10, 2006, pp. 35–72.
- Shreve, R. Norris, and Joseph A. Brink Jr. The Chemical Process Industries (4th ed. New York: McGraw Hill, 1977)
- Woytinsky, W. S., and E. S. Woytinsky. World Population and Production Trends and Outlooks (1953) pp 1176–1205; with many tables and maps on the worldwide chemical industry in 1950
- Chemical refinery resources http://www.ccc-group.com/chemicals/solutions/industrial-1