Chamical
| Chamical | ||
|---|---|---|
| City | ||
|
View southwest along Avenida Perón in downtown Chamical. The Sierra de los Quinteros range can be seen in distant background | ||
| ||
|
Nickname(s): Perla de los Llanos ("Pearl in the Plains") | ||
 Chamical Map of Argentina with Chamical highlighted | ||
| Coordinates: AR 30°21′S 66°19′W / 30.350°S 66.317°W | ||
| Country |
| |
| Province | La Rioja Province | |
| City status | 1955 | |
| Government | ||
| • Mayor | Daniel G. Elías | |
| Elevation | 471 m (1,545 ft) | |
| Population (2010) | ||
| • Total | 12,919 | |
| Time zone | ART (UTC-3) | |
| Zip code | F5380 | |
| Area code(s) | 03826 | |
| Climate | BSh | |


Chamical is a small city in, and the seat of government of, Chamical Department in the south of La Rioja Province, Argentina.[1] With a population of 12,919 permanent residents at the 2010 census [INDEC], up from 11,831 at the time of the 2001 census, it is the third-largest settlement in La Rioja Province after Chilecito. It used to be home to the CELPA aerospace test center. The town, which is crossed by the Tirante wadi, lies on National Route 38, around 140 km from La Rioja (2 hours by bus), and some 300 km from Córdoba (4 hours by bus). This young town has been an important site in several stages of Argentine history during the last fifty years.
Chamical is regarded as the tango hub in La Rioja Province.
Name origin
Chamical is named for the many chamico (Datura inoxia) bushes which grow wild in the area.
Climate
Chamical is located in the Llanos Riojanos (Spanish for "Riojan Plains") and has four distinct seasons, giving it a BSh hot semi-arid climate under the Köppen climate classification. The dry period of April to October is mild to cool, with the normal monthly mean temperature reaching its lowest in July at 11.7 °C (53.1 °F). The rainy period of November to March is warm to hot, with the normal monthly mean temperature peaking in January at 26.4 °C (79.5 °F). There has hardly ever been any snow or frost, but there has often been hail.
Total yearly precipitation averages a scanty 448.8 millimetres (18 in) with plentiful sunny days, and the rainfall centers in summer. The wettest month is January, during which time Chamical receives an average of 94.1 millimetres (4 in).
Winters are quite cool, but usually sunny; rather, snowfall is an odd occurrence. The Servicio Meteorológico Nacional reports that July is the coldest month with a mean high of 18.7 °C (65.7 °F) and a mean low of 5.7 °C (42.3 °F). Springtime is mild, windy and wontedly warm. Summers are hot (as is common with La Rioja Province), somewhat rainy and, most often, the mercury rises to 38 degrees Celsius (≈100 Fahrenheit) or higher in the shade, which means unpleasant. The rain brings some relief from the stifling Riojan heat. January, the warmest month, has an average high of 33.4 °C (92.1 °F) and an average low of 20.1 °C (68.2 °F). Fall is mild and pleasant, but can go chilly.
The highest temperature recorded was 45.5 °C (113.9 °F) on December 25, 2013 while the lowest temperature recorded was −7.7 °C (18.1 °F) on July 31, 1993.[2]
| Climate data for Chamical (1961–1990, extremes 1970–present) | |||||||||||||
|---|---|---|---|---|---|---|---|---|---|---|---|---|---|
| Month | Jan | Feb | Mar | Apr | May | Jun | Jul | Aug | Sep | Oct | Nov | Dec | Year |
| Record high °C (°F) | 44.0 (111.2) |
43.3 (109.9) |
40.2 (104.4) |
37.0 (98.6) |
34.4 (93.9) |
28.0 (82.4) |
31.5 (88.7) |
40.4 (104.7) |
41.7 (107.1) |
41.2 (106.2) |
42.8 (109) |
45.5 (113.9) |
45.5 (113.9) |
| Average high °C (°F) | 33.4 (92.1) |
31.8 (89.2) |
29.0 (84.2) |
25.6 (78.1) |
22.0 (71.6) |
18.3 (64.9) |
18.7 (65.7) |
21.6 (70.9) |
24.7 (76.5) |
28.9 (84) |
31.2 (88.2) |
33.1 (91.6) |
26.5 (79.7) |
| Daily mean °C (°F) | 26.4 (79.5) |
25.1 (77.2) |
22.7 (72.9) |
19.3 (66.7) |
15.8 (60.4) |
11.8 (53.2) |
11.7 (53.1) |
14.1 (57.4) |
17.5 (63.5) |
21.6 (70.9) |
24.0 (75.2) |
25.9 (78.6) |
19.7 (67.5) |
| Average low °C (°F) | 20.1 (68.2) |
19.1 (66.4) |
17.5 (63.5) |
13.9 (57) |
10.4 (50.7) |
6.2 (43.2) |
5.7 (42.3) |
7.1 (44.8) |
10.3 (50.5) |
14.7 (58.5) |
17.2 (63) |
19.4 (66.9) |
13.5 (56.3) |
| Record low °C (°F) | 10.3 (50.5) |
8.9 (48) |
4.5 (40.1) |
1.0 (33.8) |
−4.0 (24.8) |
−4.7 (23.5) |
−7.7 (18.1) |
−5.0 (23) |
−3.1 (26.4) |
1.0 (33.8) |
4.5 (40.1) |
6.0 (42.8) |
−7.7 (18.1) |
| Average precipitation mm (inches) | 94.1 (3.705) |
79.3 (3.122) |
67.7 (2.665) |
18.4 (0.724) |
7.1 (0.28) |
2.6 (0.102) |
4.8 (0.189) |
4.0 (0.157) |
12.4 (0.488) |
22.2 (0.874) |
57.4 (2.26) |
78.6 (3.094) |
448.8 (17.669) |
| Average precipitation days (≥ 0.1 mm) | 8 | 6 | 7 | 4 | 2 | 1 | 1 | 1 | 2 | 2 | 6 | 7 | 47 |
| Average relative humidity (%) | 59 | 63 | 66 | 67 | 66 | 66 | 62 | 50 | 45 | 45 | 49 | 53 | 58 |
| Source #1: NOAA,[3] Oficina de Riesgo Agropecuario (record highs and lows)[2] | |||||||||||||
| Source #2: Servicio Meteorológico Nacional (precipitation days)[4] | |||||||||||||
Landmark pictures
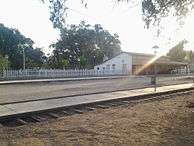 Chamical's former railroad station, now housing the local museum.
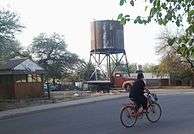 The dilapidated albeit picturesque railroad water tower in the background (behind the derelict truck) is a heritage asset; it was built up by a British company in the late nineteenth century.
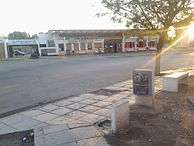 Chamical Bus Station. Wanderer, on passing through, don't miss the cozy buffet that runs here 24/7.
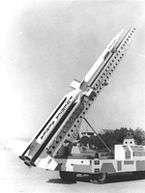 A sounding rocket on a mobile launch pad at CELPA launching facility. The picture dates back to 1969.
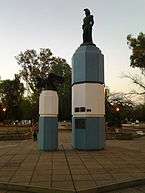 San Martín memorial at the middle of the namesake garden square in downtown at twilight.
 Chamical City Hall.
 The University of La Rioja campus at Chamical finds itself on the south side of town. It attracts a number of students from across the country.
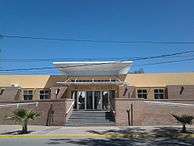 Façade of Hospital Luis Agote. This is the main hospital of public assistance in the Llanos Riojanos. Its name commemorates Argentina's breme physician Luis Agote.
References
- ↑ Ministerio del Interior (Spanish)
- 1 2 "Chamical, La Rioja". Estadísticas meteorológicas decadiales (in Spanish). Oficina de Riesgo Agropecuario. Retrieved June 15, 2015.
- ↑ "Chamical Aero Climate Normals 1961–1990". National Oceanic and Atmospheric Administration. Retrieved January 15, 2015.
- ↑ "Valores Medios de Temperatura y Precipitación-La Rioja: Chamical" (in Spanish). Servicio Meteorológico Nacional. Retrieved March 30, 2015.
Coordinates: 30°22′S 66°19′W / 30.367°S 66.317°W